Sources of errors in measurements of PAR
J. Ross
∗, M. Sulev
Tartu Observatory, Toravere, 61602 Tartumaa, Estonia
Received 4 May 1999; received in revised form 1 October 1999; accepted 9 October 1999
Abstract
Due to optical processes in the atmosphere the spectral distribution of global, direct solar and diffuse radiation is different and depends on solar elevation, atmosphere transparency etc. Because of various optical properties of phytoelements, the spectral distribution of penetrated and reflected radiation differs from that of incoming radiation. Owing to radiative transfer processes, photosynthetically active radiation (PAR) and its proportion in integral solar radiation is not constant. The aim of the paper is to study theoretically these changes and to estimate systematic errors caused by deviation of the spectral sensitivity of pyranometers and PAR sensors from the spectral sensitivity of ideal sensors.
The spectral distribution of radiation was estimated by combining different literature data and the spectral sensitivity of a typical pyranometer using available data for spectral transparency of glass domes and spectral reflectivity of black paints.
Simultaneous use of energetic and quantum treatments of radiation in biogeophysics and subsequent existence of different definitions of PAR is a source of uncertainties and misunderstanding. The basic concepts, units and conversion factors between integral radiation and PAR, as well PAR efficiency for different kinds of solar radiation, and spectral corrections for some radiation sensors will be discussed below.
Our calculations show that the conversion factorUPARis 1–3% higher for penetrated radiation and about 6% higher for reflected radiation compared withUPARQ =0.219 W smmol−1for global radiation under a cloudless sky.
Due to the different spectral sensitivity of ideal energetic and ideal quantum sensors for PAR, the radiation measured through them differs 3–13% depending on the kind of radiation. Hence PAR quantum efficiency is 3–13% higher when PAR is defined as measured by the ideal energetic PAR sensor than when it is estimated by the ideal quantum PAR sensor. Their quantum efficiency depends essentially on the kind of radiation: for diffuse radiation it is increased by 13% but for reflected radiation it is decreased to about one fourth compared with global and direct solar radiation. For penetrated global radiation, quantum efficiency decreases rapidly with canopy depth, being 8–9 times lower at the bottom of a dense canopy than above it.
For the LI-COR LI-190SA Quantum Sensor, systematic spectral errors do not exceed 1%. For the Kipp and Zonen PAR LITE sensor, errors are between 1 and 8% depending on the kind of radiation. For the LI-COR LI-200SA Pyranometer Sensor, systematic spectral errors for the global radiation reflected or penetrated by the canopy are high (20–40%), and this instrument cannot be recommended for measurements inside the canopy as is warned also by the manufacturers. ©2000 Elsevier Science B.V. All rights reserved.
Keywords:PAR quantum sensor; Pyranometer; PAR measurement; Spectral errors; Relation between PAR and integral radiation
∗Corresponding author. Tel.:+372-7-410-278; fax:+372-7-410-205.
E-mail address:[email protected] (J. Ross).
1. Introduction
Before discussing how to measure photosyntheti-cally active radiation (PAR) it should be clarified and
agreed upon as to what PAR is. In general use, PAR is defined as radiation within the range of wave lengths 400 and 700 nm, or 380 and 710 nm (e.g. Gaastra, 1959; Nichiporovich, 1960; McCree, 1966). Such a definition is vague and indefinite as was first pointed out by McCree (1972a). The wave length band of 400–700 nm, commonly accepted at present, does not cause misunderstanding. Another, more serious, prob-lem is how PAR is defined inside this wave length band. The expression “. . .radiation between 400 and 700 nm. . .” would lead physicists and actinometrists to the idea that radiation (radiation flux density) inside this band must be measured nonselectively (irrespec-tive of wave length) by the ideal PAR energetic sensor. Biologists and plant physiologists treat PAR as photon flux density which must be measured nonselectively in the PAR spectral region. According to this inter-pretation, PAR is to be measured using the ideal PAR quantum sensor, i.e. the sensor whose spectral sensi-tivity between 400 and 700 nm is proportional to wave length. These two conceptions are in principle differ-ent and this should be taken into account in theoretical treatments and especially in analysing or comparing experimental data (McCree, 1973). Since the authors avoid preferring one definition to the other, the prob-lems of PAR measurement will be considered, after a brief historical overview, in parallel following two possible definitions.
There exists no worldwide network for PAR mea-surements like the network of actinometric stations, where global, direct, diffuse and reflected solar ra-diation are measured using unified instruments and methodology and are metrologically based on the World Radiometric Reference (Romero et al., 1996). The problem becomes more complicated when it is necessary to measure PAR. In the Western coun-tries, PAR is defined as radiation in the spectral interval 400–700 nm (e.g. Gaastra, 1959; McCree, 1972a, b). In the former Soviet Union and social-ist countries, PAR was defined as radiation between 380 and 710 nm (Nichiporovich, 1960; Tooming and Gulyayev, 1967; Ross, 1981). Due to this difference, PAR data originating from the former socialist coun-tries (e.g. Moldau et al., 1963; Yefimova, 1965) are augmented 5–7% (Tooming and Gulyayev, 1967).
It is possible to estimate PAR theoretically by integrating the spectral irradiance I(l) determined
from model calculations over the PAR wave length
interval 400–700 nm. It was first done by McCree (1972a) who used forI(l) the data of Henderson and
Hodgkiss (1963). Later the models of global and dif-fuse radiation of Avaste et al. (1962) were used by Moldau et al. (1963) and McCree (1976). The SPEC-TRAL2 model of Bird and Riordan (1986) was used by Olseth and Skartveit (1997).
PAR measurements, carried out with different sen-sors and measuring systems, can be divided into three groups:
1. Measurements of spectral irradiance of global, direct, diffuse and reflected solar radiation us-ing spectroradiometers (e.g. Niilisk, 1962, 1965; Scott et al., 1968; Bird et al., 1982; Ross et al., 1986; Lee and Graham, 1986; Deering and Leone, 1986; Pearcy, 1989; Gueymard, 1989; Endler, 1993; Czarnowski, 1994a, b) and estimation of PAR by integrating spectral irradiance over the region 400–700 nm.
2. Measurements of global, diffuse or reflected PAR by pyranometers covered with hemispherical glass filters WG295 and RG695 (e.g. McCree, 1966; Rodskjer and Kornher, 1971; Stanhill and Fuchs, 1977; Stigter and Musabilha, 1982; Blackburn and Proctor, 1983; Hansen, 1984; Rao, 1984; Spitters et al., 1986; Slomka and Slomka, 1986), or mea-surements of direct solar PAR by pyrheliometers covered with identical flat filters (Tooming and Niilisk, 1967; Karalis, 1989; Jacovides et al., 1993).
3. Measurements of global, diffuse or reflected PAR with sensors based on silicon photodiodes. Following mass production of quantum sensors LI-190SA (silicon photodiode covered with a visible bandpass interference filter and a coloured glass filter) by LI-COR (LI-COR, 1986; 1991) use of quantum sensors has been rapidly ex-panded (e.g. Norman et al., 1969; Britton and Dodd, 1976; Howell et al., 1983; Pearcy, 1989; Alados et al., 1995; Ross et al., 1998).
Alados et al., 1995; Sulev and Ross, 1996). The values of PAR can be expressed in energy units (W m−2) or in
photobiological units (mmol m−2s−1); however,
con-version from one set of units to the other needs special care because it depends on the spectral composition of the measured radiation (Sulev and Ross, 1996).
Spectral sensitivity of real PAR sensors corresponds only approximately to that of the ideal PAR sensor (Li-COR, Instruction Manual, 1986; Pearcy, 1989), and in data processing the use of different correction factors appears necessary. These factors depend on the spectral sensitivity of the sensor as well on the spec-tral distribution of the measured radiation. Therefore, to obtain the most accurate values of PAR, various methodological problems have to be solved when one determines the different conversion factors and cor-rection coefficients. In this paper the methodological basis for determination of PAR is elaborated, formu-lae for calculation of different conversion factors and correction coefficients are derived and the results from the calculations are discussed.
2. Basic concepts
Radiant energy is one of the many interchangeable forms of energy which plays an important role in dif-ferent natural processes in the atmosphere, ground sur-face and plant canopy. A great deal of confusion has existed regarding the treatment and measurement of radiation, especially when emphasis is placed not on the energetic but some other aspect of radiation.
2.1. Terminology and units
The basic quantity in radiometry is spectral irradi-ance (radiant flux density)I(l), which is radiant flux
taken over an infinitesimal spectral range on either side of wavelengthλincident per unit area of surface. The
SI (International System of Units) unit of radiant flux is the watt (W) and, consequently, the unit of spectral irradiance is W m−2nm−1. In the plant sciences,
quan-tum units are commonly used for radiation. However, there is no official SI unit of photon flux. The mole of photons and the einstein are usually employed to designate Avogadro’s number of photons. While the einstein was applied in the plant sciences initially, the use of the mole is to be recommended since it is an
SI unit. Accordingly, mmol m−2s−1nm−1 is a
con-venient quantum unit for spectral irradiance (spectral photon flux density). To avoid misunderstanding, ra-diant quantities in energy units are marked below with the superscript index E and those in quantum units with the index Q.
These two unit systems are not independent but are linked through Planck’s lawE = hc/λ; the relation
between spectral irradiance in quantum units IQ(λ)
and the same irradiance in energy unitsIE(λ) can be
wave length in nm, NA is Avogadro’s quantity
(1mmol s−1m−2=6.022×10¹⁷ photons s−1m−2)
andg=NAhc(g=119.8 W s nmmmol−1).
More often, it is not spectral irradiance I(λ) but
integral irradiance over the spectral interval fromλmin
toλmax
I =
Z λmax
λmin
I (λ)dλ (2)
that is required. There are two possible treatments de-pending on how integral (Eq. (2)) is interpreted.
2.2. Energy treatment
Energy based treatment is used when the energy aspect of radiation is required (e.g. energy transfer and transformation in the atmosphere and at the ground surface etc.) and it is based on the wave nature of radiation. Integral irradiance is defined as
IEE=
Z λmax
λmin
IE(λ)dλ (2a)
and, to be exact, it should be called integral energy irradiance in energy units. It is possible to express integral energy irradiance also in quantum units using Eq. (1) (although it is rarely used)
IEQ= 1 γ
Z λmax
λmin
One can see that spectral irradiance in energy units
IE(λ) is integrated here with the weight proportional to wave lengthλ.
According to the definition of energy irradiance given by Eq. (2a) one can define the ideal energy sen-sor for measuringIEEas a sensor which measures
spec-tral irradianceIE(λ) equally (not depending on wave
lengthλ) over spectral region fromλmintoλmaxwhere
the radiationIE(λ) differs from zero.
When measuringIE(λ) we assumed that the sensor’s electrical outputnE(λ) is proportional toIE(λ)
nE(λ)=εEE(λ)IE(λ), (3)
where the proportionality factorεEE(λ)is the spectral sensitivity of energy sensors in energy units. It char-acterizes the optical and electrical parameters of the sensor and depends generally on wave lengthλ. Only for the ideal energy sensor, spectral sensitivity will be constant and we can write
εEidE(λ)=µE=const. (4)
When measuring the integral irradianceIEE in energy units over the whole spectral interval fromλmintoλmax
the integral electrical outputnEof the energy sensor is
nE= Integral sensitivity of the energy sensor in energy units is defined as
According to Eqs. (5) and (6) one has for the ideal energy sensor
nidE=µEIE; εidEE =µE. (7)
To collate the spectral sensitivity εEE(λ) of different energy sensors the relative spectral sensitivity
¯
Following Eqs. (6) and (8) the integral output of the energy sensor in measuring the irradianceIE(λ), is
nE=µE
Z λmax
λmin
¯
εEE(λ)IE(λ)dλ (5a) and integral sensitivity in energy unitsεEEis
εEE=nE
can be considered the spectral correction of the integral sensitivity of the real energy sensor relative to the ideal one in measuring radiationIE.
2.3. Quantum treatment
Quantum treatment of radiation, based on the quan-tum nature of radiation, is preferred when the quanquan-tum effect of radiation or the total number of photons is essential. The integral quantum irradianceIQQin quan-tum units is
IQQ=
Z λmax
λmin
IQ(λ)dλ. (2c)
Analogously to the energy treatment proceeding from Eq. (2c), one can define the ideal quantum sensor as a sensor which measures spectral irradiance expressed in quantum units irrespective of the wave lengthλ.
The electrical output of the quantum sensor is
nQ(λ)=εQQ(λ)IQ(λ), (3a)
whereεQQ(λ)is the spectral sensitivity of the quantum sensor in quantum units. When measuring the inte-gral quantum irradianceIQ the integral output of the quantum sensornQis
nQ= and its integral sensitivity in quantum units is
Spectral sensitivity of the ideal quantum sensor
εQidQ(λ) is constant over the spectral interval of the measured radiationIQ(λ)
εQidQ(λ)=µQ=const. (4a)
The relative spectral sensitivity of the quantum sensor is defined as
Following Eqs. (5b) and (8a) the integral output of the quantum sensor in measuring the irradianceIQ(λ) is
nQ=µQ
Z λmax
λmin
¯
εQQ(λ)IQ(λ)dλ (5c)
and its integral sensitivity
εQQ= nQ
It should be emphasized here that Eq. (8a) determines the relative spectral sensitivity of the quantum sensor in respect of the ideal quantum sensor. Usually, relative spectral sensitivity is determined relative to the ideal energy sensor. Taking into account that for a certain sensor, spectral output does not depend on the units selected to describe the spectral irradiance I(λ),one can write, following Eqs. (1) and (3a), for the quantum sensor
of the quantum sensor in energy units. The integral sensitivity of the quantum sensor in energy units is
εEQ=
is the relative spectral sensitivity of the quantum sensor as determined relative to the ideal energy sensor.
For the ideal quantum sensorε¯idQE (λ)=µQλ/µEγ
and
εidQE =
µQRλλminmaxγλIE(λ)dλ
IE . (12)
From Eqs. (11) and (12) it follows that the relative spectral sensitivity of the ideal quantum sensor rela-tive to the ideal energy sensor is proportional to wave length, and integral sensitivity depends on the spec-tral composition of the measured radiation. Therefore, comparison of the ideal energy and quantum sensors is possible only when they are calibrated using the same light source.
It should be mentioned here that relative spectral sensitivities are usually normalized in some way for better collation of different sensors. As a rule, the nor-malizing condition is that max[ε(λ)¯ ]≡1 orε(λ)¯ ≡1
at a certain wave lengthλ. Below, normalizing
con-stants will not be indicated in formulae, because, since our ultimate interest is to find out relative corrections or relations, the constants are cancelled out.
3. Photosynthetically active radiation
As we noted earlier, PAR is not unanimously de-fined. Accepting the nowadays more commonly used spectral interval from 400 to 700 nm, we will con-sider PAR in parallel following two possible defini-tions. PAR as integral energy irradiance within the mentioned spectral limits is denoted as PARE, while PAR as integral quantum irradiance within the same limits is designated as PARQ. Both can be expressed in energy or quantum units, which is marked with the superscript indexes E and Q, respectively. Hence, integral energy PARE in energy units is
IPAREE =
Z 700 400
IE(λ)dλ (2d)
IPAREQ = 1 γ
Z 700 400
λIE(λ)dλ. (2e)
Integral quantum PARQ in quantum units is
IPARQQ =
Z 700 400
IQ(λ)dλ (2f)
and in energy units
IPARQE =γ
Z 700 400
IQ(λ)
λ dλ. (2g)
All the above conclusions and relations regarding the energy and quantum treatments of radiation are valid also for PAR in the cases where the PAR spectral region and the spectral sensitivity of PAR sensors are taken into account.
Thus one can define the ideal PAR energy sen-sor as a sensen-sor which measures spectral irradiance
IE(λ) nonselectively in spectral region from 400 to 700 nm and is not sensitive at all outside this region, i.e.εEidPARE(λ)≡const=µEwhen 400≤l≤700 nm,
andεidPAREE (λ)≡0 whenλ <400 nm orλ> 700 nm. When measuring spectral irradiance in quantum units
IQ(λ) the spectral sensitivity of the ideal PAR energy sensor isεQidPARE(λ)=µEγ /λwithin the spectral
lim-its shown above.
The spectral sensitivity of the ideal PAR quantum sensorεQidPARQ(λ)≡const=µQat 400≤l≤700 nm, and εQidPARQ(λ) ≡ 0 at l<400 nm or l> 700 nm,
when irradiance is expressed in quantum units. When irradiance is expressed in energy units then
εEidPARQ(λ)=µQλ/γ.
When the same spectral irradiance is measured us-ing different ideal PAR sensors (ideal PAR energy sen-sor or ideal PAR quantum sensen-sor) the result will also be different.
From Eqs. (3b) and (3c) it is possible to draw two important conclusions:
(1) The relation between integral PARE and PARQ, measured according to different definitions of PAR, using ideal PAR energy and ideal PAR quantum sensors
is not constant; but depends on the spectral composi-tion of the measured radiacomposi-tion.
(2) The productµEγ /λin Eq. (3b) can be
consid-ered the spectral sensitivity of the ideal PAR energy sensor when the measured spectral irradiance is ex-pressed in quantum units. The relative spectral sen-sitivity of the ideal PAR energy sensor, determined relative to the ideal quantum sensor, is in this case
¯
εidPAREQ =µEγ /µQλ. For the ideal PAR quantum
sen-sor ε¯idPARQQ ≡ 1. Analogously, the relative spectral
sensitivity of the ideal PAR quantum sensor relative to the ideal energy sensor, when measuring spectral ir-radiance in energy units, isε¯idPARQE (λ)=µQλ/µEγ.
The spectral properties of the real PAR sensor are char-acterized by its spectral sensitivityε(λ)which can be expressed both in energy and quantum units. The elec-trical output of the real sensor is
n(λ)=εE(λ)IE(λ)=ε sensitivity of the real PAR sensor in quantum units. The relative spectral sensitivity of the real PAR sen-sor relative to the ideal energy sensen-sor is ε¯E(λ) = εE(λ)/µE, while relative to the ideal quantum sensor
isε¯Q(λ)=εQ(λ)/µQ =εE(λ)γ /λµQ.
UI=I
The conversion factorsUIandUPARI for different kinds of radiation are presented in Table 4. An important radiation characteristic in biogeophysical studies is the ratio of PAR to the integral radiationKIwhich can be expressed as
KI=I E PAR
IEE . (15)
Evidently, as a result of the wider application of PAR quantum sensors, another characteristic, PAR quantum efficiency χI , has been lately taken into use. It is
defined as
χI= I Q PAR
IEE . (16)
KIandχIare calculated for different sensors and for different kinds of radiation.
4. Spectral corrections
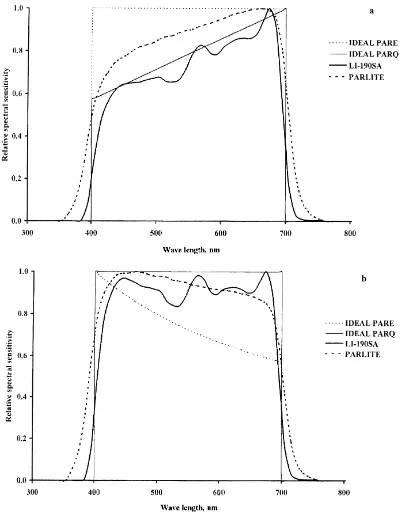
All real sensors for integral radiation as well for PAR differ from ideal ones in that their spectral in-terval of sensitivity does not correspond to that of the ideal sensor and also in that they are more or less selective within their spectral band (Figs. 1 and 2). These deviations cause systematic errors which are usually called spectral errors. Spectral errors depend on the spectral sensitivity of the sensorε(λ), the spec-tral composition of the measured irradianceI(λ) and the spectral composition of radiation used to calibrate the sensor. It should be emphasized that for correct de-termination of spectral corrections, the spectral sensi-tivity of each individual sensor as well as the spectral
composition of radiation in case of a certain measure-ment must be known. Practically, we know the aver-aged relative spectral sensitivity for a certain class of sensors and spectral irradiance of different kinds of radiation under typical conditions. Hence all spectral corrections are only approximate depending on how much the real situation differs from the expected one.
4.1. Sensors for integral solar radiation
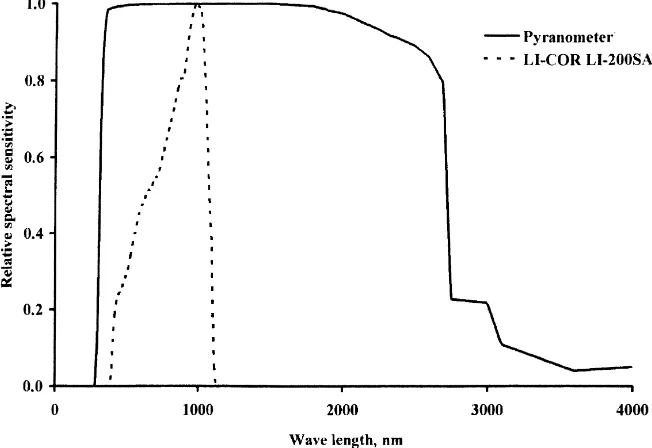
The ideal energy sensor of integral solar radia-tion must be nonselective in a wide spectral region of solar radiation, practically from 300 to 2500 nm. Sensors with unprotected black receiving surfaces (pyrheliometers, actinometers) are very close to ideal ones. While thermoelectrical pyranometers with glass domes also satisfy these conditions quite well, the instruments based on silicon photocells such as the LI-COR LI-200SA Pyranometer Sensor differ signif-icantly from ideal sensors.
Usually, pyranometers are calibrated relative to pyrheliometers or actinometers, which can be re-garded as ideal sensors, using direct solar radiation. In this case Eq. (9) can be used to calculate spectral corrections for different kinds of radiation
βPYRI =
Rλmax
λmin ε¯PYR(λ)I
E(λ)dλ
IE , (9a)
whereIE(λ) is direct solar, global, diffuse or reflected spectral irradiance.
When the pyranometer is calibrated relative to the reference pyranometer using global radiation GE(λ) spectral corrections have to be calculated as
βPYRI
where ε(λ)¯ REF is the relative spectral sensitivity of
the reference pyranometer andε(λ)¯ PYRis the relative
spectral sensitivity of the pyranometer to be calibrated;
IE(λ) is direct solar, diffuse or reflected spectral irra-diance.
Fig. 2. Relative spectral sensitivity of integral energy sensors relative to the ideal energy sensor.
presented in Table 1. It is evident that a typical pyra-nometer with a black receiving surface and double glass domes is very close to the ideal energy sensor. It should be noted here that spectral corrections for pyranometers with a black-and-white receiving sur-face such as Yanishevsky’s pyranometer are consider-ably larger (Ross, 1957).
4.2. PAR sensors
Due to technical problems, the relative spectral sensitivity of real PAR sensors is an approximation to the relative spectral sensitivity of the ideal PAR sen-sor (Fig.1). For a real sensen-sorε¯PAR(λ)6= ¯εidPAR(λ), so
errors will occur. Spectral corrections of the real PAR sensor can be calculated relative to the ideal PAR energy or ideal PAR quantum sensors. As the real PAR sensors under consideration (LI-COR LI-190SA Quantum Sensor and Kipp and Zonen PAR LITE (1999)) are closer to the ideal PAR quantum sensor, the spectral corrections presented in Eq. (9c) are cal-culated relative to the ideal PAR quantum sensor. The ratio of the output of the real sensor to that of the ideal PAR quantum sensor,βPARI , is
βPARI = nPAR nidPARQ =
Rλmax
λmin ε¯
E
PAR(λ)IE(λ)dλ
R700
400ε¯EidPARQ(λ)IE(λ)dλ
=δ1+δ2+δ3, (9c)
where
δ1=
Rλ400
λminε¯
E
PAR(λ)IE(λ)dλ
R700
400ε¯EidPARQ(λ)IE(λ)dλ ,
Table 1
Spectral correction factorsβI(Eqs. (9a) and (9b)) for the typical pyranometer calibrated relative to the normal pyrheliometer and for the LI-COR LI-200SA Pyranometer Sensor calibrated relative to the reference pyranometer for different kinds of radiation Radiation Pyranometer LI-200SA
Clear Overcast Clear Overcast
DirectS 1.000 – 1.010 –
DiffuseD 1.000 – 0.950 –
GlobalG 0.999 0.994 1.000 0.996 Penetrated global
δ2=
The ratioβPARI can be considered as the correction of the integral sensitivity of the real PAR quantum sensor relative to the ideal one when measuring the spectral irradiance IE(λ). The parameterδ1 characterizes the
error caused by the ‘parasitic’ sensitivity of the real sensor in the spectral interval lmin<l<400 andδ2
characterizes the same type of error in the interval 700< λ < λmax.The addend δ3 describes the error
caused by the deviation of the relative spectral sensi-tivity of the real PAR sensor from that of the ideal sen-sor within the PAR spectral region 400≤λ≤700 nm. When one knowsβPARI and its components for differ-ent kinds of radiation it is possible to estimate how close the real sensor is to the ideal PAR quantum sensor and how the deviations of the measured values
Table 2
Spectral correction factorsβPAR(Eq. (9b)) of PAR sensors due to the deviation of their spectral sensitivity from that of the ideal PAR
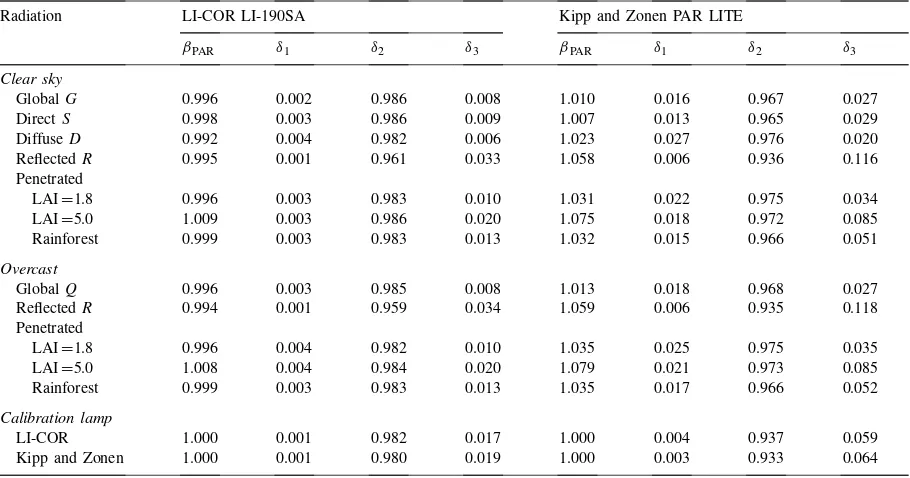
quantum sensor. The sensors are calibrated relative to the LI-COR calibration lamp
Radiation LI-COR LI-190SA Kipp and Zonen PAR LITE
βPAR δ1 δ2 δ3 βPAR δ1 δ2 δ3
Clear sky
GlobalG 0.996 0.002 0.986 0.008 1.010 0.016 0.967 0.027
DirectS 0.998 0.003 0.986 0.009 1.007 0.013 0.965 0.029
DiffuseD 0.992 0.004 0.982 0.006 1.023 0.027 0.976 0.020
ReflectedR 0.995 0.001 0.961 0.033 1.058 0.006 0.936 0.116
Penetrated
LAI=1.8 0.996 0.003 0.983 0.010 1.031 0.022 0.975 0.034
LAI=5.0 1.009 0.003 0.986 0.020 1.075 0.018 0.972 0.085
Rainforest 0.999 0.003 0.983 0.013 1.032 0.015 0.966 0.051
Overcast
GlobalQ 0.996 0.003 0.985 0.008 1.013 0.018 0.968 0.027
ReflectedR 0.994 0.001 0.959 0.034 1.059 0.006 0.935 0.118
Penetrated
LAI=1.8 0.996 0.004 0.982 0.010 1.035 0.025 0.975 0.035
LAI=5.0 1.008 0.004 0.984 0.020 1.079 0.021 0.973 0.085
Rainforest 0.999 0.003 0.983 0.013 1.035 0.017 0.966 0.052
Calibration lamp
LI-COR 1.000 0.001 0.982 0.017 1.000 0.004 0.937 0.059
Kipp and Zonen 1.000 0.001 0.980 0.019 1.000 0.003 0.933 0.064
from PAR depend on the spectral composition of radiation (Table 2).
PAR sensors are usually calibrated by manufactur-ers using standard lamps with a known spectral irra-dianceILE(λ). In this case integral sensitivity is
εPARL =µE
kinds of radiation for the real PAR quantum sensor calibrated relative to the standard lamp (Table 2).
5. Spectral composition of radiation above and inside vegetation canopies
As discussed earlier, to calculate different correc-tions and conversion factors, data on the spectral dis-tribution of radiation over the whole spectrum are needed. However, the data obtained from model calcu-lations or measurements with different types of spec-troradiometers and under different atmospheric condi-tions are unsystematic and of variable quality.
Using the standard model of the cloudless atmo-sphere Avaste et al. (1962) calculated the spectral dis-tribution of the direct solar radiationS(λ) and diffuse radiationD(λ) in mcal cm−2min−1(0.699 W m−2) at
sea level for different relative air massm, turbidityτ
and water vapour contentω. The calculations were per-formed for the whole spectral region of solar radiation 290–4000 nm. Bird and colleagues (Bird et al., 1982, 1983; Bird, 1984; Bird and Riordan, 1986) presented the spectral distribution (W m−2nm−1) of directS(λ),
diffuse D(λ) and global solar radiation G(λ)=S(λ) sinh+D(λ) and diffuse radiation of the cloudy sky
DC(λ). The calculations were performed for the
spec-tral interval 305–2450 nm using the models BRITE and SPECTRAL. Comparison of model calculations with data obtained from measurements by spectrora-diometers have shown fairly good agreement.
Czarnowski (1994a, b) and Czarnowski and Cebula (1996) performed a number of spectral irradiance mea-surements of incoming global, direct and diffuse ra-diation in the spectral interval 300–1100 nm using the LI-1800 spectroradiometer. They also measured global radiation above and inside tomato and green pepper crops in the greenhouse at different leaf area indexes. Endler (1993) studied the spectral radiance and ir-radiance of penetrated radiation in the PAR spectral region above and inside a riparian forest and discussed the influence of the spectral composition of PAR on plant growth.
Using the LI-1800 spectroradiometer Ross et al. (1986) studiedGQ(λ) and red/far-red ratio in the un-derstorey of boreal forest ecosystems in the spectral region 400–800 nm. Kylling (1993) calculatedDCE(λ)
in the interval 300–800 nm for the cloudy sub-arctic
summer atmosphere ath=30◦, studied the influence
of albedo onDCE(λ)and found that presence of water clouds generally reducesDCE(λ).
Spectral transmittance of solar radiation through a dense canopy is low, especially in the PAR region. Using the LI-COR spectroradiometer LI-1800, Lee (1987) measuredG(λ) between 300 and 1100 nm of a Costa Rica rainforest at solar elevation near the zenith. In the PAR region the transmittanceT(λ) is as low as about 0.5%, while in the near infrared (NIR) region it is about 4%. The height of the forest was 35 m, and although LAI was not given, such low transmittance indicates that it must have been about 10.
Similar results were obtained by Lee and Downum (1991) in Miami, Florida, where the spectroradiometer LI-1800 was also used.
The measurements made by Ross at al. (1986) in aPicea glaucaforest (Alberta, Canada) using identi-cal instruments, with the height of trees being 32 m, showed that PAR transmittance there was about 2–3% and NIR transmittance about 5%, i.e. 4–5 times higher than in the rainforest. Unfortunately, LAI was not known. The spectral distribution of the global radia-tionG(λ) in the interval 400–800 nm was measured in the open area (G0(λ)) and beneath the forest (GT(λ))
at a height of 1 m. Using these data we calculated the spectral transmittanceT(λ) as the ratioGT(λ)/G0(λ).
The spectral transmittanceT(λ) in the spectral in-terval 380–1550 nm of maize, sorghum, soybean and sunflower in a Mediterranean climate of Western Aus-tralia was measured by Bishnoi and Sedgley (1985). They used a portable ISCO spectroradiometer with a flat sensor 2 cm in diameter, fitted with a fibre optic extension cord. The results showed that in the PAR regionT(λ) varied between 3 and 8%. In the NIR re-gion variation was larger,T(λ) being between 15 and 35%. LAI of different crops ranges from 3.5 to 5.5. With increasing LAI, penetration decreases sharply in maize and sorghum crops which have an open foliage. Decrease is slower in a clustered foliage like that of soybean and cowpea. The authors concluded that the parameters of transmitted radiation and crop geome-try are strongly interdependent and regulate radiation transmission through the foliage.
spec-tral range 400–1050 nm. Transmission measurements were made using a fibre optic extension cord with a flat receiving surface of 2 cm in diameter, while re-flection measurements were performed with the angle of acceptance limited to 22◦. LAI of the crops varied
between 2 and 10.
The most comprehensive studies of spectral re-flectance and transmittance at the leaf level were carried out by Jacquemoud and Baret (1990). For cal-culations, they used the PROSPECT model and for laboratory measurements, the Varian Cary 17DI spec-trophotometer equipped with an integrating sphere coated with barium sulphate paint. The accuracy of the measurements was about 1% and agreement with the calculated data appeared very good (R=0.98). The results were published for leaves of green soy-bean and yellowing maize.
Jacquemoud (1993) calculated canopy reflectance as a function of LAI and leaf and soil optical prop-erties using the hybrid model PROSPECT+SAIL. These calculations show that in the spectral interval 500–1400 nm the canopy reflectance R(λ) increases
with increasing LAI, while in other spectral intervals this dependence is less pronounced.
For the soybean canopy, analogous calculations with the use of the more simplified model SHORT-WAVE were carried out by Lemeur and Rosenberg (1979).
Unfortunately, we have found only a few data (Sat-terwhite and Henley, 1990; Skidmore and Schmidt, 1998; Turner et al., 1998) for the spectra of green veg-etation measured in the whole solar radiation spectral interval 300–2400 nm.
For measurements of spectral reflectance in the spectral region 400–1900 nm, Shibayama and Akiyama (1989) used the field spectroradiometer with the 15◦field of view. Optical fibre light cords at 2.5 m
above the canopy were used, which limited the sam-ple area to 60 cm in diameter. The measurements were carried out for different rice cultivars at the heading stage. Due to the influence of the water body beneath the crop, the results are somewhat different from the measurements made in ‘canopy+soil’ system.
Using the spectroradiometer LI-1800 in the spectral interval 400–1100 nm, Lorenzen and Jensen (1991) measured the spectral reflectance of barley crop during the growing season. The results were similar to that of Scott et al. (1968). They found that the growing
sea-son can be divided into four district Feekesscale phe-nological periods on the basis of spectral reflectance . Using the above data we tried to construct a set of typical spectral curves of direct, diffuse and global incoming solar radiation as well as the radiation re-flected and transmitted by the vegetation.
When selecting initial data for estimation of spec-tral corrections and conversion factors, main attention was given to the reliability of the spectral composition of radiation under different typical conditions; but not to absolute values. As a rule, experimental data were preferred. The choice was to a certain extent subjec-tive and was partially based on the authors’ long-term experience. All data were calculated as mean values for 10 nm spectral intervals and these values were al-located to the midpoint of the wave length interval. To cover the spectral region from 300 to 4000 nm differ-ent data were combined in some cases, while in the longwave region from 2400 to 4000 nm arbitrary lin-ear extrapolation was used since the energy contribu-tion of this region is negligible.
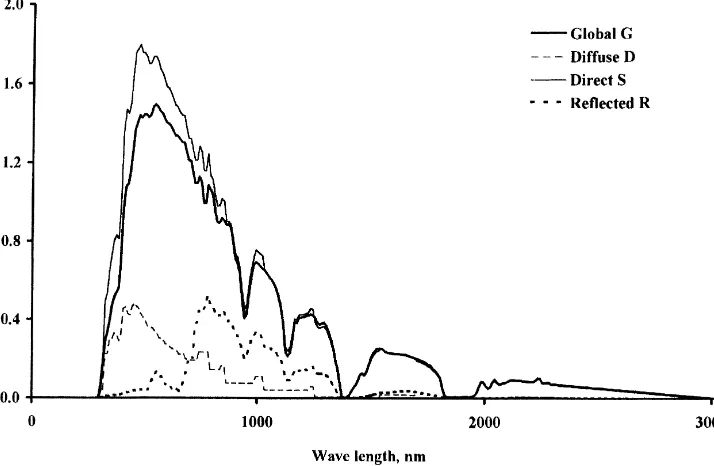
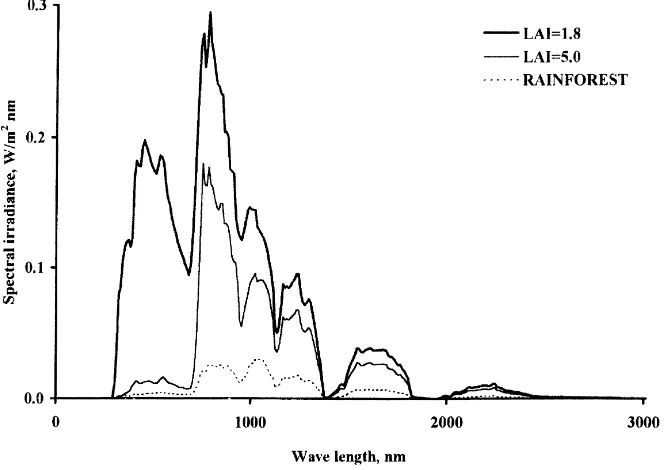
Spectral irradiance above the canopy (spectral ir-radiance of the incoming radiation and the radiation reflected from the canopy) is presented in Figs. 3 and 4. For direct solar radiation, data of the spec-tral irradiance S(λ), measured by Bird and Riordan (1986) at Golden (Colorado) at a solar elevation of 69◦, were used. These measurements cover the
spec-tral interval from 300 to 2300 nm; linear extrapolation was used starting from the last measured value, i.e. from 2300 to 3010 nm, whereS(λ) is assumed to be zero. For the clear sky diffuse radiationD(λ), the re-sults of the measurements by Endler (1993) were em-ployed. However, since these data cover only the inter-val 350–700 nm they were combined with the model calculations carried out by Avaste et al. (1962) in the regions 330–350 nm and 700–4000 nm. The spectral irradiance of global radiation was found as the sum
G(λ)=S(λ)sinh+D(λ), where h is solar elevation. For the cloudy sky, global radiation data were taken from Bird et al. (1982); starting from 2300 nm, linear extrapolation was used up to zero at 3100 nm.
Fig. 3. Typical spectral irradiance above the canopy (clear sky).
as in Jacquemoud and Baret (1990), complemented by data from Lemeur and Rosenberg (1979) in the spectral region 300–400 nm and by linear interpola-tion from 0.021 at 2420 nm to 0.010 at 4000 nm.
Due to the great variability and insufficient amount of reliable experimental data, spectral irradiance in-side the plant canopy appears most uncertain. Spec-tral transmittance for LAI=1.8 and LAI=5.0 in the
spectral region 350–1100 nm was calculated from the experimental data of spectral irradiance above and inside the plantation (Czarnowski and Cebula, 1996). Since below 350 nm experimental data are unreli-able due to technical problems, the constant value equal to spectral transmittance at 340 nm was used in the region 300–340 nm. In the spectral region from 1100 to 2500 nm, the spectral transmittance curve was extended using data from Jacquemoud and Baret (1990) for green soybean leaves, and in the region 2500–4000 nm transmittance was linear decreasing to half. Spectral transmittance was calculated also for deep shade under a rainforest at La Selva, Costa Rica, using experimental data from Lee and Graham (1986). Although LAI was not given, it must have been at least 10 judging by irradiance values. Spec-tral irradiance inside the canopy was calculated as a
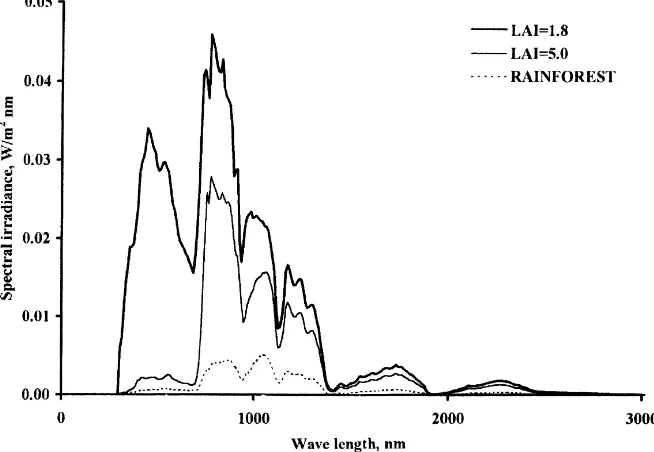
Fig. 5. Typical downward spectral irradiance inside the canopy (clear sky).
product of spectral transmittance and spectral global radiation above the canopy for the clear (Fig. 5) and the overcast sky (Fig. 6).
Fig. 6. Typical downward spectral irradiance inside the canopy (overcast).
Relative spectral sensitivities of sensors were normal-ized so that their maximum value max[ε(λ)¯ ]≡1.
6. Results of calculations
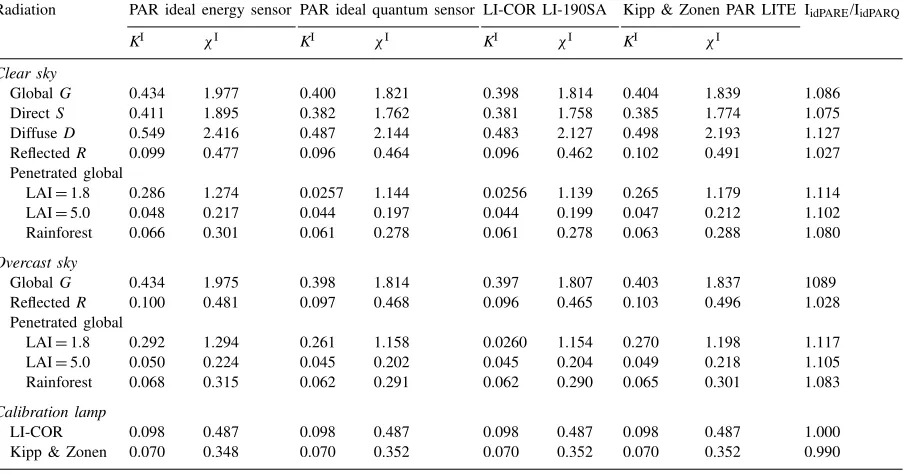
Table 3 presents the calculated values of the ratio of PAR to the integral radiationKIfor different ideal and real sensors. As the LI-COR LI-190SA Quantum Sensor is more widespread and also quite close to the ideal PAR quantum sensor, analysis will be given for this sensor type. It is evident from the Table that the role of PAR in integral radiation is the greatest for clear sky diffuse radiation, but is practically equal for global radiation of clear and the overcast sky. The most significant decrease in the share of PAR takes place inside the plant canopy: in upper canopy lay-ers (LAI=1.8) the ratioKIdecreases about 35%, but in the lower layers of a dense canopy (LAI=5.0) as
much as 8–9 times. The somewhat higher value ofKI
in the rainforest compared with dense vegetation is presumably caused by the higher degree of clumpi-ness and by the existence of larger gaps between the trees. Through the gaps one can see a part of the sky with a larger share of diffuse PAR compared with the
radiation scattered by leaves. The share of PAR in re-flected integral radiation is low (KI≈0.10). The share of PAR in the radiation originating from calibration lamps is also low due to their low radiation tempera-ture as compared with the Sun’s radiation temperatempera-ture. In general, PAR efficiencyχI follows the regularities of the ratioKI. The most important conclusion drawn from Table 3 is that the ratioKIdecreases rapidly with
increasing canopy depth and is low for the radiation reflected from the canopy. Therefore the values ofKI
estimated for incoming radiation above the canopy are not valid for penetrated or reflected radiation. When PAR is measured with the energy PAR sensor or cal-culated as energy irradiance between 400 and 700 nm, the ratioKI is 3–12% higher than it is in the cases when PAR is estimated as quantum irradiance.
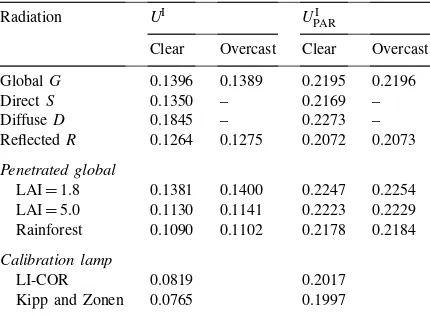
The conversion factor from quantum units to en-ergy units for PAR UPARI (Table 4) depends on the kind of radiation and is about 40% higher than for in-tegral radiation. The conversion factor of PAR,UPARI , is about 6% higher for incoming solar radiation than for reflected radiation.
pyrheliome-Fig. 7. Spectral irradiance of calibration lamps (dashed lines — blackbody approximation).
ter then a systematic error will occur due to the dif-ference in spectral distribution between direct radia-tion and the radiaradia-tion to be measured. Table 1 shows
Table 3
The ratio of photosynthetically active radiation (PAR) to integral radiationKI(Eq. (15)) and PAR efficiencyχI(mmol/W s) (Eq. (16)) for PAR ideal energy and PAR ideal quantum sensors and the ratio of PAR, measured with the PAR ideal energy sensor, to PAR measured with the PAR ideal quantum sensorIidPARE/IidPARQfor different kinds of radiation
Radiation PAR ideal energy sensor PAR ideal quantum sensor LI-COR LI-190SA Kipp & Zonen PAR LITE IidPARE/IidPARQ
KI χI KI χI KI χI KI χI
Clear sky
GlobalG 0.434 1.977 0.400 1.821 0.398 1.814 0.404 1.839 1.086
DirectS 0.411 1.895 0.382 1.762 0.381 1.758 0.385 1.774 1.075
DiffuseD 0.549 2.416 0.487 2.144 0.483 2.127 0.498 2.193 1.127
ReflectedR 0.099 0.477 0.096 0.464 0.096 0.462 0.102 0.491 1.027 Penetrated global
LAI=1.8 0.286 1.274 0.0257 1.144 0.0256 1.139 0.265 1.179 1.114
LAI=5.0 0.048 0.217 0.044 0.197 0.044 0.199 0.047 0.212 1.102
Rainforest 0.066 0.301 0.061 0.278 0.061 0.278 0.063 0.288 1.080 Overcast sky
GlobalG 0.434 1.975 0.398 1.814 0.397 1.807 0.403 1.837 1089
ReflectedR 0.100 0.481 0.097 0.468 0.096 0.465 0.103 0.496 1.028 Penetrated global
LAI=1.8 0.292 1.294 0.261 1.158 0.0260 1.154 0.270 1.198 1.117
LAI=5.0 0.050 0.224 0.045 0.202 0.045 0.204 0.049 0.218 1.105
Rainforest 0.068 0.315 0.062 0.291 0.062 0.290 0.065 0.301 1.083 Calibration lamp
LI-COR 0.098 0.487 0.098 0.487 0.098 0.487 0.098 0.487 1.000
Kipp & Zonen 0.070 0.348 0.070 0.352 0.070 0.352 0.070 0.352 0.990
Table 4
Conversion factor between integral irradiance in energy and quan-tum units UI (W smmol−1) (Eq. (14)) and PAR in energy and
quantum unitsUPARI (W smmol−1) (Eq. (14a)) for different kinds
of radiation
Radiation UI UPARI
Clear Overcast Clear Overcast GlobalG 0.1396 0.1389 0.2195 0.2196
DirectS 0.1350 – 0.2169 –
DiffuseD 0.1845 – 0.2273 –
ReflectedR 0.1264 0.1275 0.2072 0.2073 Penetrated global
LAI=1.8 0.1381 0.1400 0.2247 0.2254 LAI=5.0 0.1130 0.1141 0.2223 0.2229 Rainforest 0.1090 0.1102 0.2178 0.2184 Calibration lamp
LI-COR 0.0819 0.2017
Kipp and Zonen 0.0765 0.1997
is practically unnecessary in measurements of incom-ing solar radiation.
The situation is drastically different when the LI-COR LI-200SA Pyranometer Sensor is used in-stead of an ordinary pyranometer. The former instru-ment can be employed for measureinstru-ment of incoming global radiation only. In measurements of the radia-tion reflected by the canopy the values can be in error up to 45%, while the values of penetrated radiation can be more than 20% lower.
Table 2 characterises different systematic errors of PAR quantum sensors, caused by deviation of their spectral sensitivity from that of the ideal sensor. One can conclude that for the LI-190SA Quantum Sensor, the errors δ1 of ‘parasitic’ sensitivity at λ <400 nm
are small and do not exceed 0.4%. The errorsδ3due to
‘parasitic’ sensitivity atδ> 700 nm are larger, reaching
the maximum value of 3.4% in measurements of the radiation reflected by the vegetation. Both errors,δ1
andδ2, increase the output of the sensor. More
essen-tial are the errors caused by deviation of the relative spectral sensitivityε¯EPAR(λ)from the idealε¯EidPARQ(λ)
in the spectral interval 400≤λ≤700 nm. The
magni-tude of these errors depends on the kind of radiation to be measured and ranges from 1.4% in measure-ments of direct solar PAR to 4.9% in measuremeasure-ments of reflected PAR. Since errorsδ1andδ3compensate
to some extent for the errorδ2, the total error will be
less than 1%.
The situation is somewhat poorer in the case of the Kipp and Zonen PAR LITE quantum sensor. The cor-rection factor δ1 caused by ‘parasitic’ sensitivity at λ <400 nm varies between 0.6 and 2.7%, being small-est for PAR reflected from the vegetation and largsmall-est for clear sky diffuse PAR. The influence of ‘parasitic’ sensitivity at λ> 700 nm is greater; δ3 has a
mini-mum value of 2.0% for clear sky diffuse PAR and a maximum value of 11.8% for PAR reflected from the vegetation under an overcast sky. Theδ2is
consider-able (2.4–6.5%) also for downward global radiation inside the canopy. The total correction factorβPAR= δ1+δ2+δ3is smallest (1.007) for direct solar PAR
and largest (1.079) for global overcast sky PAR inside a dense canopy at LAI=5.0.
It should be noted that the described systematic errors of PAR quantum sensors relative to the ideal PAR quantum sensor are useful to know when analysing the functioning of the sensor and improving the sensor’s quality.
7. Concluding remarks
We have found only two papers (McCree, 1972a; Jacovides et al., 1997) where the conversion factor
UPARI (Eq. (14a)) is dealt with. Using the I(λ) data of Henderson and Hodgkiss (1963), McCree calcu-lated the conversion factor for two situations: for the clear sky global radiationUPARG =0.219 and for the clear sky diffuse radiationUPARD =0.236. The value
UPARG = 0.219 has been widely used later by other authors.
Using the spectroradiometer LI-1800 Jacovides et al. (1997) found UPARG for a polluted atmosphere at Athens to be in the interval 0.219–0.222 depending on atmospheric turbidity. For clear sky diffuse radia-tion,UPARD varied from 0.230 to 0.236. WhileUPARG
decreases with turbidity, UPARD does not reveal such a tendency. The authors recommend to takeUPARG =
0.221 andUPARD =0.234 as averaged values, which shows very good agreement with our results.
For UPARG , our calculations (Table 4) yielded the value 0.227 which is 3.7% higher than the result of McCree. For clear sky diffuse radiation, our value
Table 5
The relative difference (%) between the conversion factorsUPARI andUPARG
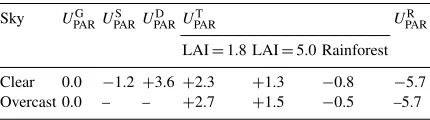
Sky UPARG UPARS UPARD UPART UPARR LAI=1.8 LAI=5.0 Rainforest Clear 0.0 −1.2 +3.6 +2.3 +1.3 −0.8 −5.7 Overcast 0.0 – – +2.7 +1.5 −0.5 –5.7
those of McCree is probably caused by the use of dif-ferent models of G(λ) as well by different input op-tical characteristics of the atmosphere. From Table 4 it follows thatUPARG is not a universal conversion fac-tor but depends on the kind of radiation. The use of the ‘universal’ conversion factor of McCree,UPARG =
0.219, for some other kinds of radiation could be a source of systematic errors. Table 5 gives the mag-nitude of errors for different kinds of radiation. The maximum error of−5.7% effects reflected radiation,
but the+3.6% error for clear sky diffuse radiation is
also appreciable. Unlike errors for the other kinds of radiation the latter is positive in sign, which is caused by the shape of the spectral distribution curveI(λ): the maximum of the spectral curve of clear sky diffuse ra-diation is shifted to shorter wave lengths (see Fig. 1), while for the other kinds of radiation, especially for reflected radiation, the maximum is shifted to longer wave lengths.
To estimate the PAR efficiencyχI(Eq. (16)) differ-ent methods have been used. The simplest way is to measure the PAR irradianceIPARQQ with a PAR quan-tum sensor, calibrated in quanquan-tum units, and the inte-gral irradianceIEwith a pyranometer and to find their ratio (Howell et al., 1983; Meek et al., 1984; Alados et al., 1995; Sulev and Ross, 1996). Another way is to calculateIPARQQ andIE, using the data of spectral
irra-dianceI(λ) for different kinds of radiation measured or
estimated theoretically on the basis of models. Olseth and Skartveit (1997) applied the sophisticated model SPECTRAL 2 (Bird and Riordan, 1986) for a clear sky and the cloud transmittance model for an over-cast sky and calculatedχS,χD,χG,χDCas the func-tions of the solar elevationhfor typical atmospheric conditions at 65◦N and at the equator. At h=45◦
they obtained χS=1.85, χD=2.50, χG=1.95 and
χDC=2.40. Comparison of these values and our re-sults (Table 3) shows that agreement is fairly good for
χS andχG, butχDis 24% higher than our value for a cloudy sky.
From measurements with the LI-COR quantum sen-sor, Alados et al. (1995) found that PAR efficiency for the direct solar radiationχS increases with the solar elevationh from 1.83 ath=24◦ to 1.92 at h=64◦.
This is in good accordance with the value 1.895 cal-culated by us. For an overcast sky, their measurements yieldedχG=2.1, which is somewhat higher than our
value 1.975. TheχG depends weakly onh, cloud sit-uation and other factors, and its value for a clear mid-summer day is 2.00 which is practically the same as the value 1.982 calculated by us.
We measured global PARGQPAR, using the LI-COR
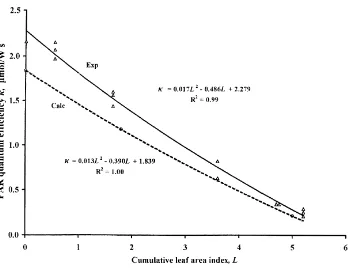
LI-190SA Quantum Sensor, and the integral global ra-diationGE, using the Reemann TR-3 pyranometer, in a willow coppice (Ross et al., 1998; Ross and Ross, 1998). Using these data, the PAR quantum efficiency
χG(L) was calculated as a function of depth within the canopyL(Fig. 8). Both the calculated values and the values ofχG(L) presented in Table 3 decrease rapidly withL, whereas the experimental values are increased by 10–15%. The reason of this discrepancy is not clear, but it may be caused by various experimental or the-oretical faults.
Compared with the PAR efficiencyχI the ratio of PAR to the integral radiationKI is more commonly used. Several data for the ratioKIhave been reported in literature. Approximate theoretical estimations of
KIas a function of canopy depth were made by Toom-ing (1967).
The ratioKIcan be estimated in different ways: 1. Calculation of KI when the spectral irradiance
IE(λ) is known (Avaste et al, 1962; McCree, 1976).
2. Simultaneous measurement ofIEE andIPARE using the pyranometer or actinometer with and without broadband filters, respectively (e.g. Tooming and Niilisk, 1967; Stigter and Musabilha, 1982; Black-burn and Proctor, 1983; Rao, 1984; Karalis, 1989; Jacovides et al., 1993; Papaioannou et al., 1996;). 3. Simultaneous measurement ofIPARE with the PAR sensor andIEEwith the pyranometer (e.g. Howell
et al., 1983; Meek et al., 1984; Weiss and Nor-man, 1985; Alados et al., 1995; Sulev and Ross, 1996).
Fig. 8. PAR quantum efficiencyχQ for clear sky global radiation vs cumulative leaf area indexLcalculated using typical radiation data (Calc) and measured data in a willow coppice (Exp) with trendlines.
are presented. The values are calculated using typical curves of the spectral irradianceI(λ). However, exper-imental data reveal thatKIis not constant and depends on a number of environmental factors, for instance, on solar elevation, water content in the atmosphere, atmospheric turbidity, type and amount of clouds, the ratio of diffuse PAR to global PAR, etc. The largest amounts of data are available for the global radiation
KG (Papaioannou et al., 1996), which show that KG
varies between 0.42 and 0.49. For the cloudy sky dif-fuse radiationKD, the range of variation is from 0.50 to 0.69, data for the direct solar radiationKSvary be-tween 0.20 and 0.50 and depend primarily on solar elevation.
Both theoretical calculations and experimental data reveal that inside the canopy, the ratioKG for pene-trated global radiation depends essentially on canopy depth. Physically, this is influenced by the shape of the spectral curve of leaf absorbtance. In the PAR spec-tral region green leaves absorb about 85% of radiation, while in the NIR region the respective share is only
about 15%. As a result the ratio PAR/NIR decreases rapidly with increasing LAI.
8. List of symbols
G global radiation (global integral irradi-ance) (W m−2)
G(λ) spectral global radiation (global spectral irradiance) (W m−2nm−1)
D diffuse radiation (diffuse integral
irradi-ance) of clear sky (W m−2)
D(λ) spectral diffuse radiation (diffuse spectral irradiance) of clear sky (W m−2nm−1)
DC diffuse radiation (diffuse integral irradi-ance) of overcast sky (W m−2)
DC(λ) spectral diffuse radiation (diffuse spectral
irradiance) of overcast sky (W m−2nm−1)
h solar elevation (◦)
I(λ) spectral irradiance (W m−2nm−1;mmol
m−2s−1nm−1)
IE(λ) spectral irradiance in energy units (W m−2nm−1)
IQ(λ) spectral irradiance in quantum units (mmol m−2s−1nm−1)
IEE integral energy irradiance in energy units (W m−2)
IEQ integral energy irradiance in quantum units (mmol m−2s−1)
IPAREE integral PAR energy irradiance in energy units (W m−2)
IPAREQ integral PAR energy irradiance in quantum units (mmol m−2s−1) IPARQE integral PAR quantum irradiance in
energy units (W m−2)
IPARQQ integral PAR quantum irradiance in
quantum units (mmol m−2s−1) IQE integral quantum irradiance in energy
units (W m−2)
IQQ integral quantum irradiance in quantum units (mmol m−2s−1) KI ratio of PAR to the integral radiation
nE integral electrical output of the energy
sensor (mV)
nE(λ) energy sensor’s electrical output in
measuringIE(λ) (mV)
nidE integral electrical output of the ideal energy sensor (mV)
nidQ integral electrical output of the ideal
quantum sensor (mV)
nQ integral electrical output of the quantum
sensor (mV)
nQ(λ) quantum sensor’s electrical output
in measuringIQ(λ) (mV)
PARE integral energy photosynthetically active radiation (W m−2;mmol m−2s−1)
PARQ integral quantum photosynthetically active radiation (W m−2;mmol m−2s−1)
R(λ) spectral reflectance
S direct solar radiation (direct integral irradiance) (W m−2)
S(λ) spectral direct solar radiation (direct spectral irradiance) (W m−2nm−1)
T(λ) spectral transmittance
UI conversion factor between integral
irradiance in energy and quantum units (W smmol−1)
UPARI conversion factor between PAR integral
irradiance in energy and quantum units (W smmol−1)
βEI spectral correction of the energy sensor
relative to the ideal energy sensor in measuring radiationIE
βPARI spectral correction of PAR sensor in measuring radiationI
βPYRI spectral correction for pyranometer calibrated using pyrheliometer in measuring radiationI
γ γ=NAhc=119.8 (W s nmmmol−1) εEE integral sensitivity of energy sensor in
energy units (mV m2W−1)
εEE(λ) spectral sensitivity of energy sensor in energy units (mV m2nm W−1) εEQ integral sensitivity of energy sensor
in quantum units (mV m2smmol−1) εEQ(λ) spectral sensitivity of energy sensor
in quantum units (mV m2s nmmmol−1) εidEE (λ) spectral sensitivity of ideal energy
sensor in energy units (mV m2nm W−1) εidEQ (λ) spectral sensitivity of ideal energy
sensor in quantum units (mV m2s nm
mmol−1)
εidQE (λ) spectral sensitivity of ideal quantum
sensor in energy units (mV m2nm W−1) εidQQ (λ) spectral sensitivity of ideal quantum
sensor in quantum units (mV m2s nm
mmol−1)
εPAREE integral sensitivity of PAR energy sensor in energy units (mV m2W−1)
εPAREQ integral sensitivity of PAR energy sensor
in quantum units (mV m2smmol−1) εPARQE integral sensitivity of PAR quantum sensor in energy units (mV m2W−1) εPARQQ integral sensitivity of PAR quantum
sensor in quantum units (mV m2s
mmol−1)
εQE integral sensitivity of quantum sensor in energy units (mV m2W−1)
εQQ integral sensitivity of quantum sensor in quantum units (mV m2smmol−1) εQQ(λ) spectral sensitivity of quantum sensor in
quantum units (mV m2s nmmmol−1) ¯
εEE(λ) relative spectral sensitivity of energy
sensor in respect of ideal energy sensor
¯
εQE(λ) relative spectral sensitivity of energy sensor in respect of ideal quantum sensor
¯
εEPAR(λ) relative spectral sensitivity of PAR sensor
in respect of ideal energy sensor
¯
εQPAR(λ) relative spectral sensitivity of PAR sensor in respect of ideal quantum sensor
¯
εEPARQ(λ) relative spectral sensitivity of PAR quantum sensor in respect of ideal energy sensor
¯
εQPARQ(λ) relative spectral sensitivity of PAR
quantum sensor in respect of ideal quantum sensor
¯
εEQ(λ) relative spectral sensitivity of quantum
sensor in respect of ideal energy sensor
¯
εQQ(λ) relative spectral sensitivity of quantum
sensor in respect of ideal quantum sensor
εEidQ(λ) relative spectral sensitivity of ideal quantum sensor in respect of ideal energy sensor
λ wave length (nm)
µE spectral sensitivity of the ideal
energy sensor (mV m2nm W−1) µQ spectral sensitivity of the ideal quantum
sensor (mV m2s nmmmol−1)
χI PAR quantum efficiency for radiation
I(mmol W−1s−1)
Acknowledgements
The research was supported by the ESF Grant No. 2661. The authors thank Mr. Matti Mõttus and Mr. Enn-Märt Maasik for assistance and Mrs. Viivi Randmets and Mrs. Ester Jaigma for preparing the manuscript. The spectral sensitivity of PAR sensors and LI-COR LI-200SA Pyranometer Sensor and the spectral irradiance of calibration lamps were kindly provided to us by LI-COR and Kipp and Zonen firms. The regional editor of the journal Dr. J. B. Stewart and the anonymous reviewers are highly acknowledged
for their comments and suggestions in improving the manuscript.
References
Alados, I., Foyo-Moreno, I., Alados-Arboledas, L., 1995. Photosynthetically active radiation: measurements and modelling. Agric. For. Meteorol. 78, 121–131.
Avaste, O., Moldau, H., Shifrin, K.S., 1962. Spectral distribution of direct solar and diffuse radiation. In: Investig. Atm. Phys. Inst. Phys. Astron. Acad. Sci. E.S.S.R. Tartu, 3, pp. 23–71 (in Russian).
Bird, R.E., Hulstrom, R.L., Kliman, A.W., Eldering, H.G., 1982. Solar spectral measurements in the terrestrial environment. Appl. Opt. 21, 1430–1436.
Bird, R.E., Hulstrom, R.L., Lewis, J.L., 1983. Terrestrial solar spectra data sets. Solar Energy 30, 563–573.
Bird, R.E., 1984. A simple solar spectral model for direct-normal and diffuse horizontal irradiance. Solar Energy 32, 461–471. Bird, R.E., Riordan, C., 1986. Simple solar spectral model for
direct and diffuse irradiance on horizontal and tilted planes at the Earth’s surface for cloudless atmospheres. J. Climate Appl. Meteorol. 25, 87–97.
Bishnoi, P., Sedgley, P.R.H., 1985. Spectral analysis of transmitted radiation in summer crops in a mediterranean climate. Int. J. Ecol. Environ. Sci. 11, 55–67.
Blackburn, W.J., Proctor, J.T.A., 1983. Estimating photosynthe-tically active radiation from measured solar irradiance. Solar Energy 31, 233–234.
Britton, C.M., Dodd, J.D., 1976. Relationships of photosynthe-tically active radiation and shortwave irradiance. Agric. Meteorol. 17, 1–7.
Czarnowski, M., 1994a. Spectral composition of solar irradiation incident upon plant ecosystems. Zeszyty Problemove Postepów Nauk Rolniczych 405, 21–31.
Czarnowski, M., 1994b. Spectral properties of tree leaves. Zeszyty Problemove Postepów Nauk Rolniczych 405, 43–54. Czarnowski, M., Cebula, St., 1996. Effect of leaf area index
on spectral transmittance of solar radiation in greenhouse cultivation of sweet pepper plants. Folia Hortic. 8/1, 53–72. Deering, D.W., Leone, A., 1986. A sphere-scanning radiometer
for rapid directional measurements of sky and ground radiance. Remote Sens. Environ. 19, 1–24.
Endler, J.A., 1993. The color of light in forests and its implications. Ecol. Monographs 63, 1–27.
Gaastra, P., 1959. Photosynthesis of crop plants as influenced by light, carbon dioxide, temperature, and stomatal diffusion resistance. Mededelingen van de Landbouwhogeschool te Wageningen, Netherland, 59, pp. 1–68.
Gueymard, C., 1989. An atmospheric transmittance model for the calculation of the clear sky beam, diffuse and global photosynthetically active radiation. Agric. For. Meteorol. 45, 215–229.
Henderson, S.T., Hodgkiss, D., 1963. Spectral energy distribution of daylight. Brit. J. Appl. Phys. 14, 125–131.
Howell, T.A., Meek, D.W., Hatfield, J.L., 1983. Relationship of photosynthetically active radiation to shortwave in the San Joaquin Valley. Agric. Meteorol. 28, 157–175.
Jacovides, C.P., Kallos, G.B., Steven, M.D., 1993. Spectral band resolution of solar radiation in Athens, Greece. Int. J. Climatol. 13, 689–697.
Jacovides, C.P., Timbios, F., Asimakopoulus, D.N., Steven, M.D., 1997. Urban aerosol and clear skies spectra of global and diffuse photosynthetically active radiation. Agric. For. Meteorol. 87, 91–104.
Jacquemoud, S., Baret, F., 1990. PROSPECT: a model of leaf optical properties spectra. Remote Sens. Environ. 34, 75–91. Jacquemoud, S., 1993. Inversion of the PROSPECT +SPAIL
canopy reflectance model from AVIRIS equivalent spectra: theoretical study. Remote Sens. Environ. 44, 281–292. Karalis, J.D., 1989. Characteristics of direct photosynthetically
active radiation. Agric. For. Meteorol. 48, 225–234.
Kylling, A., 1993. Radiation transport in cloudy and aerosol loaded atmospheres 1. Radiative fluxes at the Earth surface under cloudy conditions. In: Rep. Series in Aerosol Sci. Finnish Assoc. for Aerosol Research No. 21, pp. 28–35.
Lee, D.W., Graham, R., 1986. Leaf optical properties of rainforest sun and extreme shade plants. Am. J. Bot. 73, 1100–1108. Lee, D.W., 1987. Spectral distribution of radiation in two
neotropical forests. Biotropica 19, 161–166.
Lee, D.W., Downum, K.R., 1991. Spectral distribution of biologically active solar radiation at Miami, Florida, USA. Int. J. Biometeorol. 35, 48–54.
Lemeur, R., Rosenberg, N.J., 1979. Simulating the quality and quantity of short-wave radiation within and above canopies. In: Comparison of Forest Water and Energy Exchange Models. Int. Soc. for Ecol. Modelling, Copenhagen, 1979, pp. 77–100. LI-COR, 1986. LI-COR Radiation Sensors. Instruction manual.
Publ. No. 8609-56, Lincoln, Nebraska, USA.
LI-COR, 1991. LI-COR Radiation Measurement Instruments. Lincoln, Nebraska, USA.
Lorenzen, B., Jensen, A., 1991. Spectral properties of a barley canopy in relation to spectral properties of single leaves and the soil. Remote Sens. Environ. 37, 23–34.
McCree, K.J., 1966. A solarimeter for measuring photosynthetically active radiation. Agric. Meteorol. 3, 353–366.
McCree, K.J., 1972a. Test of current definitions on photosynthetically active radiation against leaf photosynthesis data. Agric. Meteorol. 10, 443–453.
McCree, K.J., 1972b. The action spectrum, absorptance and quantum yield of photosynthesis in crop plants. Agric. Meteorol. 9, 191–216.
McCree, K.J., 1973. The measurement of photosynthetically active radiation. Solar Energy 15, 83–87.
McCree, K.J., 1976. A comparison of experimental and theoretical spectra for photosynthetically active radiation at various atmospheric turbidities. Agric. Meteorol. 16, 405–412. Meek, D.W., Hatfield, J.L., Howell, T.A., Idso, S.B., Reginato, R.J.,
1984. A generalized relationship between photosynthetically active radiation and solar radiation. Agron. J. 76, 939–945.
Moldau, H., Ross, J., Tooming, H., Undla, I., 1963. Geographic distributions of photosynthetically active radiation (PAR) over the European territory of the U.S.S.R. In: Photosynthesis and Problems of Plant Productivity. USSR Acad. Sci., Moscow, pp. 149–158 (in Russian).
Nichiporovich, A.A., 1960. Conference on measurement of visible radiation in plant physiology, Soviet Plant Physiol., 7, pp. 744–747 (in Russian).
Niilisk, H., 1962. Simplified spectrophotometer for measurements of spectral fluxes of diffuse radiation. In: Investig. Atm. Phys. Inst. Phys. Astron. Acad. Sci. E.S.S.R., Tartu, 3, pp. 150–159 (in Russian).
Niilisk, H., 1965. Spectrophotometer for measuring spectral radiation fluxes in plant cover. In: Proc. Estonian Acad. Sci., Ser. Phys. Math. Technol., 14, pp. 528–553 (in Russian). Norman, J.M., Tanner, C.B., Thurtell, G.W., 1969. Photosynthetic
light sensor for measurements in plant canopies. Agron. J. 61, 840–843.
Olseth, J.A., Skartveit, A., 1997. Spatial distribution of photosynthetically active radiation over complex topography. Agric. For. Meteorol. 86, 205–214.
PAR LITE, 1999. Sensor for photosynthetic photon flux. SCI-TEC Instruments/Kipp and Zonen. Newsletter.
Papaioannou, G., Nikolidakis, G., Asimakopoulus, D.N., Redalis, D., 1996. Photosynthetically active radiation in Athens. Agric. For. Meteorol. 81, 287–298.
Pearcy, R.W., 1989. Radiation and light measurements. In: Pearcy, R.W., Ehleringer, J.E., Mooney, H.A., Rundel, P.W. (Eds.), Plant Physiological Ecology: Field Methods and Instrumentation. Chapman & Hall, London, pp. 97–116.
Rao, C.R., 1984. Photosynthetically active components of global solar radiation: measurements and model computations. Arch. Met. Geophys. Bioclim., Ser. B. 34, 353–364.
Rodskjer, N., Kornher, A., 1971. Über die Bestimmung der Strahlungsenergie im Wellenlängebereich von 0.3–0.7 m in Pflanzenbeständen. Agric. Meteorol. 8, 139–150.
Romero, J., Wehrli, C., Frohlich, C., 1996. Maintenance of the world radiometric reference. In: Int. Pyrheliometric Comparison IPC VIII 25 September–13 October 1995, Results Symp. Swiss Meteorol. Inst. Davos and Zürich, Working Rep. No. 188, pp. 49–51.
Ross, J., 1957. About radiation measurement with Yanishevsky pyranometers. Proc. Acad. Sci. Estonian SSR. Ser. Technol. Phys. Math. Sci. 6, 3–18.
Ross, J., 1981. Radiation Regime and Architecture of Plant Stands. Dr. W. Junk Publishers, The Hague-Boston, London. Ross, M.S., Flanagan, L.B., La Roi, B.H., 1986. Seasonal and
successional changes in light quality and quantity in the understorey of boreal forest ecosystems. Can. J. Bot. 64, 2792– 2799.
Ross, J., Ross, V., 1998. Statistical description of the architecture of a fast growing willow coppice. Agric. For. Meteorol. 91, 23–37.
Ross, J., Sulev, M., Saarelaid, P., 1998. Statistical treatment of PAR variability and its application to willow coppice. Agric. For. Meteorol. 91, 1–21.
features: laboratory and field measurements. U.S. Army Crops Engineers. Engineer Topographic Laboratories Fort Belvoir, Virginia, 22060–5546.
Scott, D., Menalda, P.H., Brougham, R.W., 1968. Spectral analysis of radiation transmitted and reflected by different vegetations NZ. J. Bot. 6, 424–449.
Shibayama, M., Akiyama, T., 1989. Seasonal visible, near-infrared and mid-infrared spectra of rice canopies in relation to LAI and above-ground dry phytomass. Remote Sens. Environ. 27, 119–127.
Skidmore, A.K., Schmidt, K.S., 1998. Mapping rangeland vegetation using hyperspectral vegetation spectra. In: 1st EARSeL Workshop on Imaging Spectroscopy. EARSEL, Paris, pp. 285–297.
Slomka, J., Slomka, K., 1986. Participation of photosynthetically active radiation in global radiation. Publ. Inst. Geophys. Polish Acad. Sci. D25, 197.
Spitters, C.J.T., Tousaint, H.A.J.M., Goudriaan, J., 1986. Separating the diffuse and direct component of global radiation and its implications for modelling canopy photosynthesis Part 1. Components of incoming radiation. Agric. For. Meteorol. 38, 217–229.
Stanhill, G., Fuchs, M., 1977. The relative flux density of photosynthetically active radiation. J. Appl. Ecol. 14, 317–322. Stigter, C.J., Musabilha, V.M.M., 1982. The conservation ratio of photosynthetically active to total radiation in the tropics. J. Appl. Ecol. 19, 853–858.
Sulev, M., Ross, J., 1996. Conversion factor between global solar radiation and photosynthetic active radiation. In: Perttu, K., Koppel, A. (Eds.), Short Rotation Willow Coppice for Renewable Energy and Improved Environment. In: Proc. Joint Swedish–Estonian Seminar on Energy Forestry and Vegetation Filters, Tartu, 24–26 September 1995. Swedish Univ. Agric. Sci. Uppsala, Report 57, pp. 115–121.
Tooming, H., 1967. An approximate method for determining the attenuation and reflectation of PAR and near infrared radiation in a maize stand from the measurements of total radiation. In: Nichiporovich, A.A (Ed.), Photosynthesis of Productive Systems. Isr. Progr. for Sci. Transl. Jerusalem, pp. 100–113. Tooming, H.G., Gulyayev, B.I., 1967. Methods of measurement
of photosynthetically active radiation. Nauka, Moscow (in Russian).
Tooming, H., Niilisk, H., 1967. Transition coefficients from integrated radiation to photosynthetic active radiation (PAR) under field conditions. Phytoactinometrical Investigations of Plant Canopy. Valgus, Tallinn, pp. 140–149 (in Russian). Turner, B., Dibley, G., Dury, S., 1998. Hyperspectral characteristics
of Australian native eucalypt forests. In: 1st EARSeL Workshop on Imaging Spectroscopy. EARSEL, Paris, pp. 317–328. Weiss, A., Norman, J.M., 1985. Partitioning solar radiation into
direct and diffuse. Agric. For. Meteorol. 34, 205–213. Yefimova, N.A., 1965. Distribution of photosynthetically active