Canadian agri-environmental indicators related to land quality:
integrating census and biophysical data to estimate soil cover,
wind erosion and soil salinity
E. Huffman
a,∗, R.G. Eilers
b, G. Padbury
c, G. Wall
d, K.B. MacDonald
eaAgriculture and Agri-Food Canada, Ottawa, Ont., Canada K1A 0C6 bAgriculture and Agri-Food Canada, Winnipeg, Man., Canada R3T 2N2 cAgriculture and Agri-Food Canada, Saskatoon, Sask., Canada S7N 5A8 dAgri-Food Laboratories, 503 Imperial Rd. N., Guelph, Ont., Canada N1H 6T9
eConsultant, Box 354, Teeswater, Ont., Canada N0G 2S0
Abstract
A Canadian initiative to define and estimate indicators of the relationship between agricultural activities and environmental quality has been under way since 1993. This paper focuses on those indicators related to land quality and highlights the use of GIS to reconfigure land use and climatic data to a soil landscape spatial model in order to apply models of soil degradation. The 1981 and 1991 Census of agriculture data from a cadastral base and climatic indices from iso-contour maps are related to the soil landscapes of Canada to identify trends in the amount of soil cover, the risk of soil erosion by wind and the risk of soil salinization. Results indicate that soil cover has improved by about 11% through the use of conservation tillage and crop residue management and reduced summerfallowing, and that the risk of wind erosion in the prairies has decreased by 7% in the 10 years. The risk of soil salinization has remained constant on 93% of cropland, decreased on 7% and increased on
<1%. It appears that the improvements in soil quality protection have occurred despite some shifts to more intensive cropping systems. Crown Copyright © 2000 Published by Elsevier Science B.V. All rights reserved.
Keywords:Indicators; Land quality; Census of agriculture; Soil cover; Wind erosion; Soil salinity
1. Introduction
Over the past two decades, increasing awareness of the fragility of ecosystems and concern for the state of the environment has focused attention on the effect of agricultural activities on soil and water quality. In many countries, research studies and extension
∗Corresponding author. Present address: Agriculture and
Agri-Food Canada, Room 4097, K.W. Neatby Building, 960 Carling Avenue Ottawa, Ont., Canada K1A 0C6. Tel.:+1-613-759-1846; fax:+1-613-759-1924.
E-mail address:[email protected] (E. Huffman).
programs have been instituted by governments and universities to encourage farmers to adopt conserva-tion practices such as forage rotaconserva-tions and cover crops, reduced tillage, maintenance of crop residues and re-duced fallowing. As a result, considerable adjustment of land use and production activities has occurred.
More recently, as the concept of sustainable production becomes more accepted, decision-makers are striving to develop environmentally friendly poli-cies and programs. The need for quantitative infor-mation on the extent, degree and regional variability of the environmental impact of agricultural produc-tion practices, and on the adopproduc-tion of conservaproduc-tion
practices, has become immediate. The implications of this in terms of data, especially in the complex, interrelated and broad spatial context of ecosystems, is massive. In the absence of complete information about these relationships, the concept of a small number of indicators serving as proxies for a wider variety of parameters has been proposed. In addition, the use of indicators as expressions of information rather than as hard data serves as a means of deliver-ing information to decision-makers and the public in an understandable manner.
In 1993, in response to recommendations by the Auditor General of Canada, the Canadian Agri-Food Research Council, the Federal-Provincial Agricul-ture Committee on Environmental Sustainability and the scientific community, Agriculture and Agri-Food Canada (AAFC) initiated the Agri-Environmental In-dicators (AEI) project. The expressed goal of AEI was to develop an information base that decision-makers could rely on for environmental conditions and trends in Canadian agriculture. A range of indicators are be-ing developed to assess the degree to which key envi-ronmental issues are being addressed. The objectives are to help identify areas and resources at risk of degra-dation, to help design and target remediation strategies and to facilitate communication. The project is guided by an advisory committee consisting of representatives of producer groups, non-governmental organizations, universities and federal and provincial governments.
For the agricultural AEI project, a framework recog-nizing the cycle of cause and effect amongst farm management, resources and social pressures and mod-eled primarily on Australian and OECD ideas, was adopted (McRae et al., 1995). Within this framework, selection criteria were established to ensure that each indicator was: (1) relevant to policy issues; (2) scientifically acceptable and defensible; (3) understan-dable to decision-makers; (4) reflective of time and/ or spatial change; and (5) feasible to obtain or develop. A review of international indicator initiatives and Canadian policy issues, stakeholder consultations and an assessment of data availability and scientific expertise resulted in an initial list of 49 potential agri-cultural indicators. Through an iterative consultation process these were integrated and condensed to six core indicators with various components (Table 1).
Indicators and their components are either under development (tillage erosion, soil compaction, carbon
Table 1
Canadian agri-environmental indicators and associated components
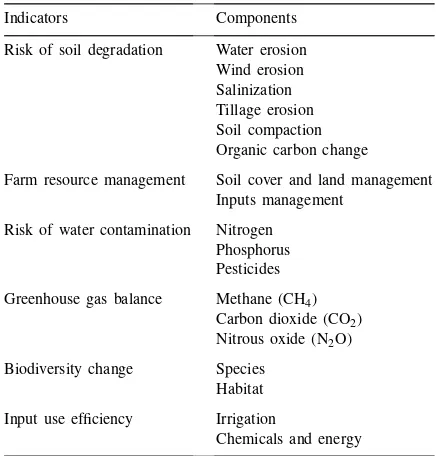
Indicators Components
Risk of soil degradation Water erosion Wind erosion Salinization Tillage erosion Soil compaction Organic carbon change Farm resource management Soil cover and land management
Inputs management Risk of water contamination Nitrogen
Phosphorus Pesticides Greenhouse gas balance Methane (CH4)
Carbon dioxide (CO2)
change, pesticide contamination), are being assessed in pilot areas (phosphorus contamination, biodiversity change, input use efficiency) or are being applied in all agricultural areas of the country. The remainder of this paper focuses on the soil cover, wind erosion and salinity indicators.
2. Materials and methods
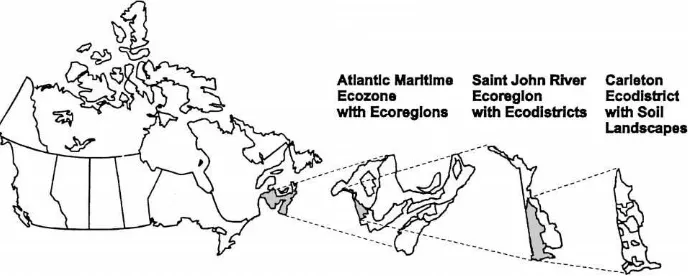
Fig. 1. Example of the ecostratification hierarchy in Canada.
Group, 1995) of the country, and coordination of these two initiatives has resulted in a nested hierarchy of biophysically defined land units for Canada’s entire land mass. The smallest unit in the hierarchy is the soil landscape unit (SLU), consisting (in agricultural areas) of an area of approximately 10,000–50,000 ha and encompassing 20–70 farms on average. These landscape units are relatively uniform with respect to parent material, soil development, landform and cli-mate and are nested within ecodistricts, which are in turn nested within ecoregions and ecozones (Fig. 1). Each level at successively smaller scales is described by more generalized information.
This ecostratification was selected as an appropriate framework for the AEI project as it allows reporting at a variety of scales, depending on data availabil-ity and validavailabil-ity. Also, in the absence of complete data, the biophysical basis of the hierarchy provides a reliable structure for modeling and ‘scaling up’ of site information to a spatial coverage. Although the SLC/ecostratification framework provided a good na-tional coverage of soil-related parameters suitable for the indicators project, it was also necessary to access a comparable database of land management, crop distribution and climatic conditions.
The national ‘Census of Agriculture’ (Statistics Canada, 1901–1991), was adopted as the basis for production information. The Census is conducted as a self-administered questionnaire on every farm every 5 years by Statistics Canada (1901–1991), and provides a wealth of information pertaining to agricultural production. The information can be subdivided into four sections: (1) farm structure; (2) crops and land
use; (3) livestock and (4) economics. The structure component relates to farm size and ownership char-acteristics, the crops and land use section details the distribution and area of crops, pasture and woodland, the livestock portion relates to the type of animals and size of herd and the economic section covers capital investment levels and the monetary value of inputs and sales. Starting in 1991, questions pertain-ing to land management practices such as the use of conventional, conservation and no-till, summerfallow management and the use of conservation structures such as windbreaks and grassed waterways were also included.
This national database has tremendous potential for analytical studies over large areas, but its use is some-what restricted by confidentiality provisions which prohibit the release of data that could be used to iden-tify individual farms. As a result, the database is avail-able only on the basis of enumeration areas (EAs) or larger census subdivisions or crop reporting districts. The EAs are roughly the size of SLUs and encompass approximately 50 farms each, but are defined on the basis of municipal boundaries and roads and thus have no relationship to natural landscape variation.
agricul-tural SLU in the country (Huffman and Unrau, 1995). This database of Census variables reconfigured to the SLC base is of significant importance to the project, as most of the indicators rely on it as a source of in-formation about agricultural activities.
Climatic data in raw form is available as ‘station records’ from as many as 1800 weather stations across the country. For the AEI project, 1961–1990 monthly normals of selected parameters such as precipitation, temperature, growing-degree days, potential evapo-transpiration (PET), dew point, solar radiation, sun hours and vapor pressure were ‘polygonized’ using Thiessen polygon or continuous surface methods and then reconfigured to ecodistricts (Bootsma, 1997). For the indicators project, the ecodistrict values were applied to each constituent SLU.
2.1. Soil cover indicator
One of the primary factors influencing changes in agricultural soil quality is the amount of cover pro-vided as a result of production activities (Coote et al., 1981). Greater amounts of soil cover reduce erosion, increase soil organic carbon levels and provide habi-tat and nutritional benefits to a variety of organisms. Thus, measuring or estimating changes in soil cover over time can serve as an ‘indication’ of movement toward or away from environmental sustainability.
An assessment of changes in soil cover must con-sider two factors: the area of crops which provide dif-ferent types and amounts of vegetative and residue cover and the tillage practices that are used to man-age the residue. For example, hay and other perennial sod crops provide almost complete soil cover over the year, whereas production of annual crops leaves soil bare for considerable periods of time. At the same time, however, conservation tillage or no-till maintains considerably more soil cover than conventional tillage using the moldboard plough. The essence of the soil cover indicator is to answer the question:
What has been the cumulative effect of changes in crop area and residue management on soil cover over the past 15 years? Is the amount of soil cover increasing or decreasing, and at what rate? In order to provide a first ‘qualitative’ response to that question, agricultural Census data of crop areas was compiled at the provincial and national levels for every 10 years between 1901 and 1991. The 1991
Census also reports for the first time on the adop-tion of various soil conservaadop-tion practices, including the area under conventional, conservation and no-till (Dumanski et al., 1994). With the exception of soil conservation efforts adopted during the years of ‘dust bowl’ conditions in the 1930s and the general use of strip-cropping in the driest (Brown soil zone; mainly Kastanozems) areas of the prairies, tillage practices specifically oriented to maintenance of soil cover have not been widely used in Canada prior to the mid-1980s. For the purpose of assessing the combined effect of crop and tillage changes on soil cover, it was assumed that all tillage in 1981 and prior was ‘conventional’.
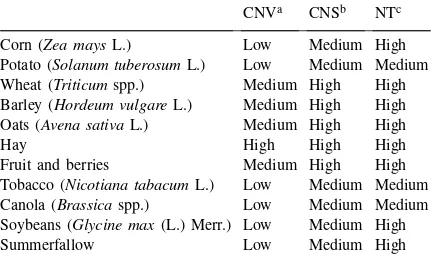
For this level of application, a subjective rating of the amount of soil cover provided by each of the country’s major crops under three tillage scenarios was prepared from field data collected for soil erosion studies (Shelton et al., 1991) and extended through ex-pert opinion (Table 2). No interpretations concerning acceptable limits were attempted.
From an analytical point of view, the combined effect of changes in crop areas and tillage practices can be cumulative or counteractive. For example, the adoption of conservation tillage on corn (which in-creases cover) may be accompanied by an areal shift from corn to soybeans that is sufficient to result in an overall decrease in cover. At the opposite extreme, if a reduction in the area of summerfallow is accom-panied by the adoption of chemical weed control it would show as a dramatic improvement in overall
Table 2
Amount of soil cover provided by various crops and tillage prac-tices in Canada
CNVa CNSb NTc Corn (Zea maysL.) Low Medium High Potato (Solanum tuberosumL.) Low Medium Medium Wheat (Triticumspp.) Medium High High Barley (Hordeum vulgareL.) Medium High High Oats (Avena sativaL.) Medium High High
Hay High High High
Fruit and berries Medium High High Tobacco (Nicotiana tabacumL.) Low Medium Medium Canola (Brassicaspp.) Low Medium Medium Soybeans (Glycine max(L.) Merr.) Low Medium High
Summerfallow Low Medium High
soil cover. Although, this portion of the indicator study has not quantified the amount of soil cover more precisely than ‘low, medium and high’, it does take into consideration changes in both crop area and the adoption of conservation practices and the result provides an overview of the cumulative effect.
2.2. Wind erosion indicator
Soil erosion by wind in Canada is considered to be a significant problem only in the prairie provinces of Manitoba, Saskatchewan and Alberta. Inherent wind erosion risk (i.e. a dimensionless index assuming bare unprotected soil) for this area was calculated using an equation developed from the work of Chepil (1945, 1956) and Chepil and Woodruff (1963) and defined as
E=KC(V2−γ W2)1.5 (1) whereEis the maximum instantaneous soil movement by wind (dimensionless),Kthe surface roughness and aggregation factor (dimensionless), C the soil resis-tance to movement by wind (dimensionless), V the drag velocity of the wind (cm s−1),γthe soil moisture shear resistance (dimensionless) andWis the surface soil moisture content (m3water m−3soil).
For Alberta and Manitoba, data was taken from the extended legends accompanying wind erosion risk
Table 3
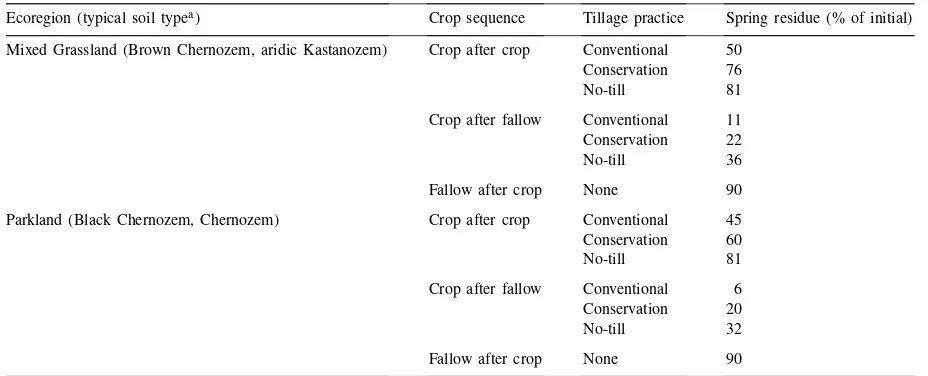
Examples of estimated spring residue levels by ecoregion, crop sequence and tillage practice
Ecoregion (typical soil typea) Crop sequence Tillage practice Spring residue (% of initial) Mixed Grassland (Brown Chernozem, aridic Kastanozem) Crop after crop Conventional 50
Conservation 76
No-till 81
Crop after fallow Conventional 11 Conservation 22
No-till 36
Fallow after crop None 90 Parkland (Black Chernozem, Chernozem) Crop after crop Conventional 45 Conservation 60
No-till 81
Crop after fallow Conventional 6 Conservation 20
No-till 32
Fallow after crop None 90 aCanadian and WRB (FAO) systems (Soil Classification Working Group, 1998).
maps prepared in the 1980s (Coote and Pettapiece, 1987; Coote et al., 1989), while in Saskatchewan erosion risks were calculated following the same procedure.
The residue reduction estimates were used to gen-erate a wind erosion reduction factor for each crop type and tillage practice and an area-weighted value was calculated for each SLU. For 1981, all tillage was assumed to be ‘conventional’, as at that time residue maintenance tillage practices were not widely prac-ticed and there is no data in the Census files. The estimated erosion rate for each polygon was then cal-culated using the equation
NEROS=EROS(1−RED) (2)
where NEROS is the estimated erosion rate, EROS the inherent (bare soil) erosion rate and RED is the residue reduction factor.
2.3. Soil salinity indicator
Soil salinization, or the accumulation of natural salts at or near the soil surface to the extent that it affects vegetative growth, is a land quality issue that affects agricultural sustainability in semi-arid environments. Currently, about 38% of the agricul-tural land in the Canadian prairies is affected to a
Table 4
Description of the factors considered in calculating the risk of salinization for soil–landscape polygons
Factor Description
Present extent (Px) The extent of present salinity is based on published soil survey data, which includes soil analysis results and estimates of the extent of area affected. Ece>8 dS/m confirms a saline condition, and the extent of area affected, from<0.1 to 100%, were assigned risk ratings from 1 to 10 on the basis of expert opinion. Topography (Tp) The risk of spread of salinity is inversely related to slope steepness, as changes in water table will affect
larger areas on level topography. On this basis, soil–landscape polygons described as level (slopes of 1–3%), undulating (4–9%) and hummocky (>10%) were assigned risk ratings of 5, 3, and 1, respectively.
Soil drainage (Dr) Relationships amongst surface water, surface runoff, depth to water table, piezometric surface, soil drainage, infiltration, hydraulic conductivity, soil moisture storage and water quality are encompassed by the soil drainage class given in conventional soil survey reports. The soil drainage class provided by the SLC database was rated as follows for the SRI: well drained=1, imperfectly drained=8, poorly drained=10, very poorly drained=5 and surface water=3.
Aridity (Ar) Salinity develops where evapotranspiration exceeds precipitation (i.e. PE−P>0). For the SRI, published maps showing iso-contour lines based on 30-year average aridity values for the growing season were superimposed on SLC maps and a value was determined for each polygon. Values of PE−P (i.e.<199, 200–249, 250–299, etc.) were assigned risk ratings from 1 to 10 by experts.
Surface cover (Sc) Cropping practices which enhance surface evaporation and facilitate deep percolation of precipitation tend to raise the water table. The practice of summerfallowing (leaving a field bare over the growing season in order to store water) can be considered to represent the highest risk of increasing soil salinity, while permanent cover (forage, trees, etc.) represents the lowest. A matrix developed by pedologists and conservation officers provides an Sc rating for each SLC polygon based on the distribution of summerfallow and permanent cover (Table 5). moderate or severe degree by salt accumulation (Eil-ers et al., 1995). Changes in the extent or severity of soil salinity is the subject of one component of AAFC Agri-Environmental Indicator ‘risk of soil degradation’. The goal of this initiative was to de-velop a salinity risk index (SRI) as a standardized, systematic approach to assessing the risk of change in soil salinity as a result of agricultural activities (Eilers and Eilers, 1996).
Development of this indicator is based on the as-sumption that landscapes with little or no salinity are unlikely to suddenly develop salinity, whereas land-scapes which have saline problems are the ones most likely to show change. The procedure for developing and applying an SRI consisted of five steps: (1) iden-tify the major components controlling salinity; (2) assign a relative risk rating to each component; (3) combine risk ratings; (4) group the calculated SRIs into classes; and (5) apply the SRI to the Canadian prairie region.
Table 5
Matrix depicting the salinization ‘risk factor’ of different combi-nations of land cover types
Permanent cover (% of polygon)a
Summerfallow (% of cropland) 0–10 10–20 20–30 30–40 40–50
75–100 1 2 3 4 5
50–75 2 3 5 7 8
25–50 3 5 7 8 9
0–25 4 6 8 10 10
aForest, hay and pasture.
into consideration in developing the SRI were the present status of the extent and severity of saline conditions (Px), topography (Tp) and soil drainage (Dr). The dynamic factors of aridity (Ar) and surface cover (Sc) were incorporated to give: SRI=(Px× Tp×Dr×Ar×Sc). A brief outline of each factor is presented in Table 4. The risk of salinization due to the distribution of summerfallow and permanent cover within a polygon is presented in Table 5.
3. Results and discussion
3.1. Soil cover
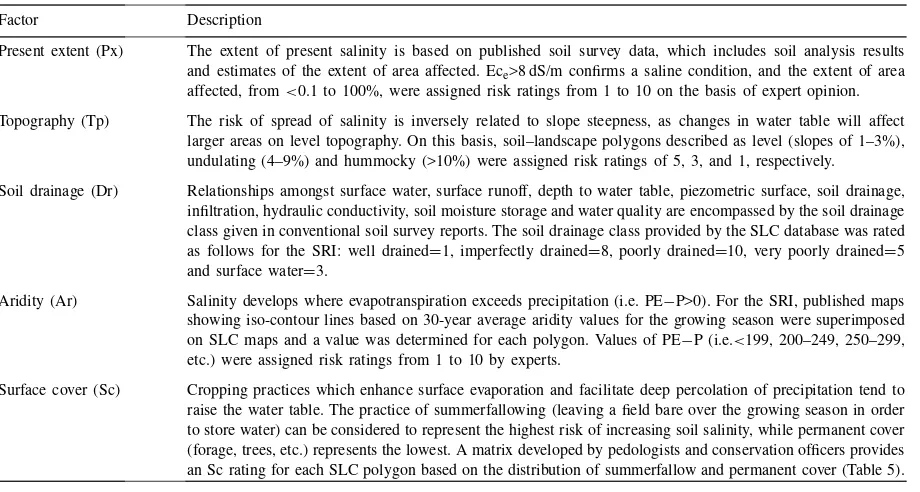
Compilation of the area under each cover category at a national level (Fig. 2) shows: (1) a fairly sharp increase in the amount of farmland under low cover between 1921 and 1971, followed by a decline to 1991;
Fig. 2. Area of cropland under high, medium and low amounts of soil cover in Canada, 1901–1991.
(2) an increase in medium cover between 1901 and 1941 and a fairly level trend since then; and (3) a very minor increase in high cover between 1901 and 1981, followed by a dramatic increase between 1981 and 1991. The major proportion of farmland falls in the ‘medium cover’ category in all years, but 1991 shows the highest percentage under high cover (31%) since 1901 (36%), when hay, pasture and spring cereals were the dominant crops. The percentage of farmland under low cover is higher in 1991 (23%) than in 1901 (5%), but is lower than at any point since 1921. In the period 1981–1991, the proportion of farmland under medium and high cover increased from 66 to 77%.
Although it is clear that the expansion of crop pro-duction in Canada in this century has exposed a great deal of soil to environmental degradation processes (Sparrow, 1984), it is difficult to make a definitive judgment of whether that trend is continuing or not. Farmland expansion has leveled off and summerfal-low levels have declined, while conservation tillage is expanding greatly, but the proportion of farmland cultivated and the proportion in rowcrops is still on the rise. The analysis is hindered by the use of ‘qualitative’ measures, but it is apparent that there is a variety of forces and reactions at work and there is a need to explore these issues in more detail. It is critical to identify parts of the country that should be monitored, and where increased efforts to address soil degradation through conservation and crop choices should be made.
3.2. Wind erosion
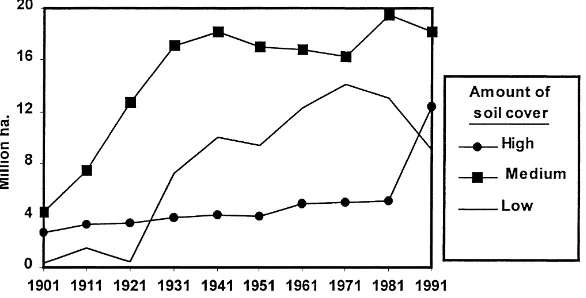
For the 1981–1991 trend analysis, the total amount of erosion in tonnes was calculated for each polygon by multiplying the estimated soil erosion rate by the area of cultivated land in the polygon. The SLC poly-gon results were ‘rolled up’ by dominant soil texture types to provide ecoregion summaries (Table 6).
Table 6
Reduction in the risk of wind erosion in the Canadian Prairies, 1981–1991
Ecoregion (typical soil typea) Soil texture Reduction in risk, 1981–1991 (%) Mixed Grassland (Brown Chernozem, Aridic Kastanozem) Sand 7.4
Loam 5.1
Clay 6.9
Mean 5.3
Moist Mixed Grassland (Dark Brown Chernozem, Haplic Kastanozem) Sand 23.3
Loam 4.6
Clay 9.6
Mean 7.0
Parkland (Black Chernozem, Chernozem) Sand 12.4
Loam 5.8
Clay 6.1
Mean 6.8
Boreal Transition (Dark Gray Chernozem, Greyzem) Sand 8.2
Loam 11.2
Clay 12.1
Mean 11.3
aCanadian and WRB (FAO) systems (Soil Classification Working Group, 1998).
In general, the risk of wind erosion in the prairies is greatest in the arid south and diminishes to the north where wind speeds tend to be lower, temperatures cooler and precipitation higher. In the more north-ern areas, less summerfallow and greater amounts of residue also contribute to lower erosion risk.
Between 1981 and 1991, wind erosion risk in the prairies declined by nearly 7% overall. One-third of this decline can be attributed to changes in cropping systems, particularly reduced summerfallow, and the remainder is due to increased adoption of conservation tillage. The relative importance of changes in crop-ping versus tillage varies across the region, however, with conservation tillage being most important in the more arid south and reduced summerfallow and in-creased forages more significant in the north. Analy-sis at the detailed level of SLUs shows that cropping system changes to incorporate more oilseeds and spe-cialty crops on clay soils in the south (Brown and Dark Brown soil zones) have marginally increased erosion risk in some areas.
3.3. Soil salinity
Saskatchewan, Manitoba), SRI values were grouped into three risk classes:<2.9=low, 3.0–8.9=moderate and >9=high. Since the concept of risk does not result in a definitive indication of a change in salinity, this analysis indicates only whether management prac-tices are subjecting any susceptible land to increasing risk of salinity. For example, a moderate rating may be the result of severe salinity being managed well or mild salinity being managed poorly. The risk class was calculated for each SLC polygon for the years 1981 and 1991, and results were compared to identify changes in the risk of salinity.
According to information in the soils database, the total extent of land in the prairie region currently af-fected by significant salinity (Ece>8 dS/m and >1.0% of the landscape affected) is 1.4 million ha (2.5% of farmland). Incorporation of land use information in the SRI showed that in 1991, 62% of farmland was at low risk of increased salinity, 28% was at moderate risk and 10% was at high risk. The implications are that under 1991 land use practices, a considerable area that is not currently negatively affected by salinity is at risk of becoming so.
Comparison of the risk under 1981 land use prac-tices with that of 1991 shows that the situation improved somewhat over the 10 years, with approx-imately 93% of farmland showing no change in risk, about 7% showing a lowered risk and<1% showing an increase in risk. Although the data presents two ‘snapshots’ in time and so does not conclusively show a trend, the results can be attributed to a considerable reduction in summerfallow area (i.e. more continuous cropping) and an increase in conservation tillage.
4. Conclusions
The concept of using key ‘indicators’ to identify trends in the relationship between agricultural pro-duction and environmental sustainability has been adopted in a number of countries in an attempt to quantify a very complex relationship. In Canada, a number of existing databases have been integrated spatially and incorporated into regional models to identify trends in soil cover, the risk of wind erosion and the risk of soil salinization. Results presented in this report indicate that soil protection has improved during the period 1981–1991 through the adoption of
conservation tillage and crop residue management and through shifts in cropping patterns, notably reduced summerfallowing.
It is difficult to develop a single ‘indicator’ that as-sesses all aspects of the complex agricultural produc-tion/environmental sustainability relationship, but data presented in this report indicate an improvement in soil protection in Canada of approximately 10% over the 10-year period prior to 1991. The proportion of farm-land with medium or high soil cover increased from 66 to 77%, the risk of soil erosion by wind in the prairies decreased by about 7% and the risk of soil salinization decreased on about 7% of prairie cropland. Improve-ments in soil protection in some cropping practices were apparently greater than the average indicates, as shifts to less protective crops also occurred.
Analysis of results at the regional ‘soil–landscape’ level are expected to show considerable spatial varia-tion within the country and will allow a much better assessment of areas and cropping systems with partic-ularly low levels of soil protection. On the basis of this analysis, it appears that development and application of improved conservation practices for systems involv-ing vegetables, canola, soybeans and tobacco would improve the overall level of land quality protection.
5. Further work
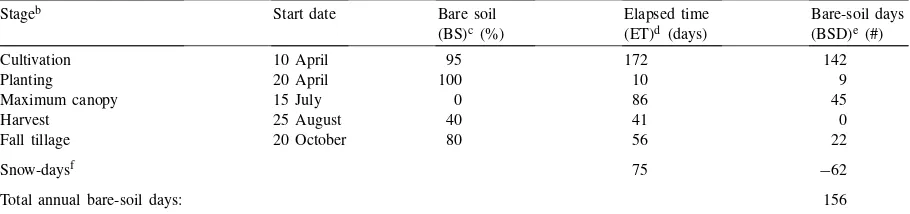
Currently, work is in progress to develop ‘bare soil days’ (BSD) indices for each crop and ecoregion in Canada in order to quantify and provide more pre-cision than the high–medium–low cover designation. Under the BSD concept, an index is developed which shows the cumulative number of days that would likely be bare soil under each crop and ‘typical’ manage-ment scheme (Table 7). This index is modeled on the ‘C’ factor calculations of the universal soil loss equation (USLE) (Wischmeier and Smith, 1978). Us-ing experimental results collected for the estimation of erosion risk supplemented with local soil conserva-tion expertise, 213 of these tables have been compiled to date.
Table 7
Example of a ‘bare-soil days’ tablea
Stageb Start date Bare soil
(BS)c(%)
Elapsed time (ET)d (days)
Bare-soil days (BSD)e (#)
Cultivation 10 April 95 172 142
Planting 20 April 100 10 9
Maximum canopy 15 July 0 86 45
Harvest 25 August 40 41 0
Fall tillage 20 October 80 56 22
Snow-daysf 75 −62
Total annual bare-soil days: 156
aProvince: Ontario; ecoregion: Lake Erie lowland; crop: grain (barley and oats); tillage practice: conventional. bA full year includes cycling from ‘fall tillage’ back to ‘cultivation’.
cAt completion. dSince previous stage.
eCalculated as: (BSD=ET×BS of the previous stage). Planting to maximum canopy and fall tillage to cultivation incorporate linear functions to account for canopy development and residue decomposition, respectively.
fDays with snow cover (Bootsma, 1997).
The risk of wind erosion, as with all soil quality in-dicators, will be recalculated using 1996 Census data to provide a 15-year trend analysis. It is expected that the changes observed in the 1981–1991 trend analy-sis will be continued and in fact strengthened in the 1991–1996 period. The analysis will provide evidence of the need for research and extension with respect to erosion risk in some particular locations and for some cropping systems.
Current activities with respect to the salinity risk index (SRI) are in preparing the 1996 Census of Agri-culture data to provide a third point in the time series analysis of salinity risk. Expectations are that land use and residue management changes that have occurred between 1991 and 1996 will corroborate the gen-eral decrease in the risk of soil salinization observed between 1981 and 1991. Following the broad-scale assessment encompassed by the Agri-Environmental Indicators project, more detailed analysis of the high-risk areas will be carried out. This is partic-ularly important, in that several detailed ‘salinity benchmarks’ studies have shown an increase in salin-ity over the past several years.
Further refinement of the SRI for use at a local level will require the incorporation of additional factors in order to improve sensitivity and validity. Ratings for soil texture (water storage capacity, drainability and hydraulic conductivity), depth to base rock or ac-quifers, mineralogical composition (source and type
of salts), source of parent material (chemistry, con-centration, mix of salts), geological component (type of salinity, responsiveness of hydrologic system), groundwater hydrology (recharge, discharge), land-scape hydrology (surface water, runoff, water quality) and weather (precipitation cycles) must be developed. In addition, information on conservation practices implemented to control and manage salinity (residue management, drainage, irrigation) must be incorpo-rated in a manner that allows discounting of salinity risk. Finally, in order to use this indicator for irrigated agriculture, we must account for the dramatic changes in the quality and quantity of water supply, surface form and land use under such a regime.
Finally, since the different indicators are being de-veloped concurrently, the bare-soil days values will not be available for inclusion in the 1996 regional anal-ysis. However, a great deal of data analysis and ex-pert opinion were invested in their development and could be used to improve estimates of the risk of soil degradation.
References
Bootsma, A., 1997. Canadian Ecodistrict Climate Normals, 1961– 1990. Eastern Cereal and Oilseed Research Centre (ECORC), Agriculture and Agri-Food Canada. http://agres:1080/CANSIS/ NSDB/ECOSTRAT/DISTRICT/climate.html.
Chepil, W.S., 1945. Dynamics of wind erosion. II. Initiation of soil movement. Soil Sci. 60, 397–411.
Chepil, W.S., 1956. Influence of moisture on erodibility of soil by wind. Soil Sci. Soc. Am. Proc. 20, 288–292.
Chepil, W.S., Woodruff, N.P., 1963. The physics of wind erosion and its control. Adv. Agron. 15, 210–302.
Coote, D.R., Pettapiece, W.W., 1987. Wind Erosion Risk — Alberta. Canada–Alberta Soil Inventory. Land Resource Research Centre, Research Branch, Agriculture Canada, Ottawa, Contribution number 87–08, 21 pp+map.
Coote, D.R., Dumanski, J., Ramsay, J.F., 1981. An assessment of the degradation of agricultural lands in Canada. Agriculture Canada, Ottawa, 86 pp.
Coote, D.R., Eilers, R., Langman, M., 1989. Wind Erosion Risk — Manitoba. Canada–Manitoba Soil Inventory. Land Resource Research Centre, Research Branch, Agriculture Canada, Ottawa, Contribution number 87–10, 17 pp+map.
Dumanski, J., Gregorich, L.J., Kirkwood, V., Cann, M.A., Culley, J.L.B., Coote, D.R., 1994. The Status of Land Management Practices on Agricultural Land in Canada. Agriculture and Agri-Food Canada, Ottawa. CLBRR Technical Bulletin 1994–3E, 46 pp.
Ecological Stratification Working Group, 1995. A National Ecological Framework for Canada. Research Branch, Agri-culture and Agri-Food Canada and State of the Env-ironment Directorate, EnvEnv-ironment Canada, Ottawa, 125 pp+map.
Eilers, R.G., Eilers, W.D., 1996. Soil Degradation Risk Indicator: Soil Salinity Risk Component. Agri-Environmental Indicator Project, Report No. 16, Agriculture and Agri-Food Canada, Ottawa, 24 pp.
Eilers, R.G., Eilers, W.D., Pettapiece, W.W., Lelyk, G., 1995. Sali-nization of soil. In: Acton, D.F., Gregorich, L.J. (Eds.), The Health of Our Soils — Toward Sustainable Agriculture in Canada. Centre for Land and Biological Resources Research, Agriculture and Agri-Food Canada, Ottawa.
Huffman, T., Unrau, E., 1995. Socioeconomic farm data and the soil landscapes of Canada. In: Lafond, G.P., Plas, H.M., Smith, E.G. (Eds.), PARI Factbook: Bringing Conservation Technology to the Farm. Agriculture and Agri-Food Canada, Lethbridge, Alberta, pp. 149–151.
McRae, T., Hillary, N., MacGregor, R.J., Smith, C.A.S., 1995. Design and Development of Environmental Indicators with Reference to Canadian Agriculture. Agri-Environmental Indicator Project, Report No. 9, Agriculture and Agri-Food Canada, Ottawa, 32 pp.
Shelton, I.J., Wall, G.J., Coote, D.R., 1991. Water Erosion Risk. Ontario–South. Canada Soil Inventory, Land Resource Research Centre, Agriculture Canada Publication 5277/B, Ottawa, 10 pp+map.
Shields, J.A., Tarnocai, C., Valentine, K.W.G., MacDonald, K.B., 1991. Soil Landscapes of Canada — Procedures Manual and User’s Handbook. LRRC Contribution No. 88–29, Agriculture Canada, Ottawa.
Soil Classification Working Group, 1998. The Canadian System of Soil Classification. Agriculture and Agri-Food Canada, Publication 1646 (Revised), NRC Research Press, Ottawa. Sparrow, Hon. H.O., 1984. Soil at Risk-Canada’s Eroding Future.
A Report on Soil Conservation by the Standing Committee on Agriculture, Fisheries and Forestry, to the Senate of Canada (Hon. H.O. Sparrow, Chairman) Ottawa, 129 pp.
Statistics Canada, 1901–1991. Census of Agriculture. Minister of Supply and Services, Ottawa.