www.elsevier.comrlocaterapplanim
Personalities in female domesticated pigs:
behavioural and physiological indications
Marko A.W. Ruis
a,b,), Joop H.A. te Brake
a,
Johan A. van de Burgwal
a, Ingrid C. de Jong
a,b,
Harry J. Blokhuis
a, Jaap M. Koolhaas
b aDepartment of BehaÕiour, Stress Physiology and Management, Institute for Animal Science and Health
(ID-Lelystad , P.O. Box 65, 8200 AB Lelystad, Netherlands)
b
Department of Animal Physiology, UniÕersity of Groningen, P.O. Box 14, 9750 AA Haren, Netherlands
Accepted 29 June 1999
Abstract
The inconclusive evidence so far on the existence of distinct personality types in domesticated pigs, led us to perform the present experiment. A total of 128 gilts from 31 sows were systematically studied from birth to slaughter in two identical trials. Intra-test consistency in individual behavioural andror physiological reactions was studied in three different tests. We
Ž
were not able to show consistencies in reactions of gilts over time to a backtest at 2–4 days and 4
. Ž .
weeks of age and to a novel environment test at 10 and 24 weeks of age . Individual aggression,
Ž
however, as measured in a group-feeding competition test in stable groups at 10 and 24 weeks of
.
age , proved to be highly consistent. Explanations for these discrepancies in intra-test consisten-cies are critically discussed. Inter-test consistenconsisten-cies were determined by relating the individual reactions of gilts to the backtest to various characteristics and responses to tests at a later age. The highest correlations were found when resistance in the first backtest was involved. No evidence was found for the existence of specific isolated categories of animals with respect to this
Ž
resistance. For further analysis, extreme responding gilts in the first backtest roughly the top and
. Ž .
bottom 25% of the distribution were classified as low resistant LR;-3 escape attempts; ns31
Ž .
or high resistant HR;)4 escape attempts; ns45 . By comparisons of mean responses of LR and HR gilts within groups, we have established a relationship between the backtest and several other variables. Behaviourally, the HR gilts showed more aggression in the group-feeding competition tests. Also, in the competition for the most productive teats at the anterior, a predominant position of HR piglets at this site was observed during the suckling period. The latter piglets also gained more weight during this period than LR ones. Compared to HR pigs, in the
)Corresponding author. Tel.:q31-320-238191; fax:q31-320-238208; E-mail: [email protected]
0168-1591r00r$ - see front matterq2000 Elsevier Science B.V. All rights reserved.
Ž .
first novel environment test LR pigs hesitated longer to leave their home pens and to contact a human, but no difference in their locomotory behaviour was observed. Contrasts between LR and HR pigs in the second novel environment test were reduced or absent. Physiologically, when compared to HR gilts, LR ones had a higher reactivity of the
hypothalamic–pituitary–adrenocorti-Ž .
cal HPA system. This was shown by higher cortisol responses to the first novel environment test, to routine weighing at 25 weeks of age, and to administration of a high dose of ACTH. It is discussed that these findings for LR and HR gilts, may provide support for the existence of behavioural and physiological responses in pigs, resembling those of proactive and reactive rodents.q2000 Elsevier Science B.V. All rights reserved.
Keywords: Pig personality; Backtest; Coping; Intra- and inter-test consistency; Aggression
1. Introduction
Various animal studies, predominantly those in rodents, have stated the existence of Ž
basically two distinct ‘‘personality types’’ within populations Bohus et al., 1987; Benus
. Ž .
et al., 1991 . The two types of animals are classified as either having a proactive active
Ž . Ž
or a reactive passive ‘‘coping style’’ for a discussion of new terms, see Koolhaas et .
al., 1997; Koolhaas et al., in press . Each type has a closely associated set of behavioural and physiological characteristics. In a given challenging situation, proactive animals show more aggression, a higher general activity and a predominant sympathetic reaction Žfightrflight . On the other hand, the reactive type responds more with immobility and. avoidance, and a predominant parasympatheticrhypothalamic activation Žconservationrwithdrawal . These individual responses are highly consistent, both in.
Ž .
identical situations Benus et al., 1991 and in different unrelated, i.e., in social and
Ž .
non-social, situations Von Holst et al., 1983; Benus et al., 1991 . Individual responses of animals may be the result of ontogenetic and learning processes, but they are at least
Ž .
partially determined by genetic factors Benus et al., 1991 .
Studies in domesticated pigs have demonstrated that large individual variation in behaviour and physiology exists, but attempts to categorize these animals in distinct personality types, as done for rodents, were less successful and showed divergent results.
Ž .
Domestication may have had an important effect on the distribution of individual characteristics, by selective breeding of pigs that were more adapted to farm conditions. In many studies no correlations were found between responses to a series of different
Ž
situations, consisting of both social and non-social challenges Lawrence et al., 1991; . Jensen, 1994; Jensen et al., 1995a,b; Forkman et al., 1995; Spoolder et al., 1996 .
Ž .
Hessing et al. 1993 , however, showed correlations between responses to manual restraint in a backtest and responses to social encounters. In addition, Mendl et al. Ž1992 observed correlations between social success in sows and various physiological.
Ž .
measurements. More recently, Thodberg et al. 1999 have reported the existence of stable reaction patterns across situations, characterised by novelty, including social as well as non-social contexts. Some studies provide support for consistency in the
Ž
reactions of pigs to similar situations Lawrence et al., 1991; Spoolder et al., 1996;
. Ž
Erhard and Mendl, 1997 , while others found only few indications for this Jensen et al.,
. Ž .
Ž .
whereas Hessing et al. 1993; 1994 reported a high consistency in behavioural
Ž .
resistance in this restraint test over time. Hessing et al. 1993; 1994 also argued that according to the distribution in reaction patterns in the backtest, pigs could be classified in two types, reflecting either proactive or reactive responders. These findings of subpopulations of pigs according to the backtest, with indications for proactive and
Ž .
reactive types of animals, could not be supported by Forkman et al. 1995 . Finally, Ž .
Erhard et al. 1999b argue that tonic immobility exists in pigs and that this phenomenon may predict the behaviour of pigs in different unrelated situations.
With respect to behavioural and physiological reactions of growing pigs to manage-ment-associated stress factors, individual animals may respond differently. This may indicate differences in appraisal of situations or points to a more fundamental difference in coping with the challenge. As described above, the data on this subject are conflicting and inconclusive. To advance knowledge on this subject, the present experiment aimed at portraying some important aspects of individual variation in young gilts. Since this study is part of a larger study to investigate reactions of young gilts to various challenges, only female pigs were studied. Intra-test consistencies were tested by subjecting gilts twice to three different tests. Repeatability of reactions of gilts to novel
Ž .
stimuli was tested by opening of the door of the home pen to enter a novel corridor , and by a sudden human approach. Consistency in aggressive features of gilts was tested in a repeated group-feeding competition test, in which aggressive encounters were triggered by providing only small amounts of food after food deprivation. Finally, we
Ž .
tried to replicate results of Hessing et al. 1993 , concerning classification of pigs into proactive and reactive responders according to the backtest. Besides a repetition of the test over time, we tested whether relationships exist between behavioural resistance in
Ž .
the backtest and other variables at a later age inter-test consistency . However, our Ž .
approach differed from that of Hessing et al. 1993 , since we carried out a first backtest
Ž .
at a very young age 2–4 days after birth , with rather naive piglets.
2. Materials and methods
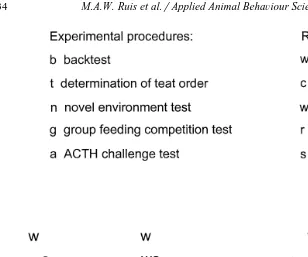
All procedures involving animal handling and testing were approved by the Institu-tional Care and Use Committee of the Institute for Animal Science and Health ŽID-Lelystad in Lelystad, The Netherlands. Fig. 1 shows the timing of experimental and. routine procedures.
2.1. Experimental housing and animals
Ž
The experiment was conducted at Institute for Animal Science and Health ID-Lelys-.
tad experimental farm ‘‘Bantham’’ in Maartensdijk, The Netherlands. A total of 128
Ž Ž ..
gilts Great Yorkshire= Great Yorkshire=Dutch Landrace was used in two identical
Ž .
trials batches . Gilts were selected from 14 and 17 litters for batch one and two,
Ž .
Fig. 1. Timing of experimental and routine procedures.
were clipped, and iron was injected. Piglets were weaned at 4 weeks of age by removing the sow. At 10 weeks of age, in each trial gilts were selected and randomly assigned to 8 groups consisting of 8 gilts each. On average, the number of litters making up a group was 7–8, and each gilt was housed with a maximum of one litter-mate. They were
Ž .
relocated in fattening pens 3.20=2.25 m with partly slatted concrete floors in another
Ž .
room, where they were housed until 25 weeks of age age of slaughter . This room was ventilated and temperature controlled, with temperatures kept between 19 and 218C.
Ž .
Artificial lights were on from 0600 until 1800 h. Food commercial pelleted dry diets
Ž .
and water from nipple drinkers were available ad libitum. Besides within one day after birth, pigs were routinely weighed at 4, 10 and 25 weeks of age.
2.2. Backtest
Ž
Each piglet was subjected to this test twice, i.e., at the start 2–4 days of age, before
. Ž .
eye-teeth and tail clipping and at the end 4 weeks of age of the suckling period. The test was performed with individual piglets in a corridor close to the home pen. A piglet was gently removed from its pen with the right arm and put on its back on a foam rubber mat. The piglet was manually restrained in this supine position for 1 min by
Ž
placing the hand of the left arm loosely over the thorax of the animal adapted from .
attempt was characterized by one continuous series of wriggles. The duration of escape
Ž .
behaviour during the test in percentage of time was also determined, together with registration of the number of vocalizations.
2.3. Group-feeding competition test
Animals were not allowed to eat from 12 h before until the start of this test, carried out twice in the fattening pen, i.e., at 10 and 24 weeks of age. The test, adapted from
Ž .
Lawrence et al. 1991 , lasted 1 h and was performed in 6 sessions of 10 min each. At the start of each session, aggressive interactions were triggered by providing a small amount of food in the front middle of the pen. It was not possible for all 8 pigs to gain access to the food at the same time. Behaviour was recorded on video and scored
w Ž
afterwards by using the software programme The Observer 3.0 Noldus Information
. Ž
Technology, Wageningen, The Netherlands . Aggressive acts included biting bites
. Ž
directed to all parts of the body , knocking rapid thrusting the head or snout upwards or
. Ž
sidewards to any part of the body and non-damaging threats aggressive interactions, .
not involving physical contact . For each animal in a group, aggression was determined
Ž . Ž . Ž .
and expressed in an index X Lee et al., 1982 : Xs0.5= DyRqNq1 , where D is the number of other animals to which more aggressive acts were directed than received from, R is the number of other animals from which more aggressive acts were received than given to, and Nsgroup size. The higher the index, the higher the aggression score.
2.4. NoÕel enÕironment test
This test was performed twice, i.e., at the ages of 10 and 24 weeks. The first test was performed in the farrowing and the second one in the fattening room. By opening the
Ž .
door, pigs were allowed to leave their home pens to enter a corridor 7=1 m , divided in 5 equal sections and serving as an unfamiliar enclosure. The opening of the door was wide enough to allow several pigs to leave the pen simultaneously. The pigs were allowed to move freely for 10 min. At the end of this period, one experimenter suddenly
Ž .
entered the corridor sudden human approach and remained in a stationary posture at one end of the corridor for 1 min. Behaviour was recorded on videotape and studied afterwards with The Observerw 3.0 software programme. Parameters that were
deter-Ž . Ž .
mined were 1 latency time for each pig to leave the home pen; 2 locomotion in the Ž .
corridor, by scoring the number of sections crossed; and 3 latency time to initiate
Ž .
contact with the experimenter sniffing, chewing or biting overalls or boots . The cortisol response to the overall test was determined by sampling saliva 5 min prior to and 5 min after the test.
2.5. Teat order
The teat order of piglets was determined a few days before weaning. For each sow, Ž . functional teats were determined and teat pairs were numbered from anterior 1 to
Ž .
number on the back for recognition. From the observations during 5 suckling periods, the most frequently occupied teat for each animal was determined. Only this ‘‘primary
Ž .
teat’’ Fraser and Jones, 1975 was used for analysis.
2.6. Routine weighing
At 25 weeks of age, routine weighing was accompanied by collecting saliva for assaying cortisol. Weighing consisted of moving individual gilts from their home pen into a mobile weighing box placed in the corridor close to the home pen. Saliva was collected 5 min prior to and 5 min after weighing.
2.7. ACTH challenge test
This test of pituitary adrenal function was performed at 24 weeks of age in the home Ž
pen of the animals. A large dose of adrenocorticotrophic hormone ACTH1-24,
Syn-w .
acthen , Ciba-Geigy, Basle, Switserland; 200 IU per pig dissolved in 5 ml saline was injected intramuscularly to test the capacity of the adrenal cortex under maximal stimulation. At the timepoints 5 min before and 5, 15, 30, 45, 60, 75, 90 and 120 min after ACTH administration, saliva was sampled for cortisol determinations.
2.8. SaliÕa collection and cortisol analysis
Ž .
Both procedures were described by Ruis et al. 1997 . In short, saliva samples were collected by allowing animals to chew on two cotton buds simultaneously until the buds were thoroughly moistened. The buds were placed in special centrifuge tubes and kept on ice until centrifuged for 5 min at 400=g to remove the saliva. Saliva was then
stored at y208C until analysis. Cortisol concentrations were measured by using a Ž . Ž
commercial radioimmunoassay RIA kit Coat-A-Count Cortisol TKCO, Diagnostic .
Products, Apeldoorn, The Netherlands . The detection limit of the assay was 0.13 ng cortisol per ml, and the intra-assay and inter-assay variances were, respectively, 5.5 and 8.3%.
2.9. Statistical analysis
Ž .
Spearman rank correlation coefficients Rs were employed to test whether individual responses to the backtest, the novel environment test and the group-feeding competition
Ž .
test were consistent between repeated exposures intra-test consistency; ns128 . Initially, this correlation analysis was also performed to describe the relationship
Ž
between backtest behaviour and variables from other test situations inter-test consis-.
tency . Subsequently, as described under Section 3, according to backtest behaviour low
Ž . Ž .
resistant LR; ns31 and high resistant HR; ns45 gilts were compared for most variables.
Scores of aggression in the group-feeding competition tests were obtained per group
Ž .
calculated first. Then, within-group differences between means were analyzed with Wilcoxon’s signed rank test.
For associations between backtest behaviour and teat order, Chi-square analysis was used to study whether the frequencies of LR and HR pigs, suckling at the first two teat
Ž .
pairs anterior; pairs 1 and 2 of the sow, differ from frequencies expected on a random Ž
basis. Similarly, frequencies of HR and LR piglets at the last two teat pairs posterior; .
pairs 6 and 7 were studied and compared.
Analysis of variance was performed to analyze data with respect to cortisol responses
Ž .
to routine weighing, body weights within time points , and characteristics of responses to the ACTH challenge test. Fixed effects were main effects for the factors backtest resistance and trial. Litter and group effects were introduced as random effects.
Ž Components of variance were estimated by restricted maximum likelihood REML;
. Ž
Engel, 1990 . Tests for main effects were based on the Wald test Buist and Engel, .
1994 . Pairwise comparisons were based on a two-sample Student’s t-test. Where variances of groups were unequal, an approximate t-test was used, employing an Ž approximation of the distribution of the variance of the difference between the means in
. Ž .
the denominator of the test statistic , see e.g., Scheffe 1959 .
´
For analyzing cortisol observations after ACTH administration, a separate curve was fitted to the data of each individual gilt. A family of curves based on the incomplete
Ž .
gamma function sometimes referred to as Wood’s curve in the context of lactation data
B Ž .
was employed: YtsDqA)t )expyC)t qe . Here, for the individual under study,t
Y is the measured cortisol concentration at time t after ACTH administration and e ist t
an associated error term. This is a unimodal curve, which starts at the baseline concentration D, increases to a maximum at tstmaxsBrC, and then decreases again to level D. B determines the rate of increase before the peak position tma x is reached, C determines the rate of decrease after tma x, and A determines the hight of the peak
B Ž .
YmaxsDqA)tmax)expyC)tmax at tstmax. For each individual, its constants A,
B, C and D are estimated by the method of least squares. From these individual
estimates, for each animal, the area S under the curve and the slopes s and s5 75 at ts5 and ts75 min respectively, were estimated. Each of the summary statistics tma x, Ymax,
Ž .
S, s and s5 75 was analysed separately as a new response variable. Additionally, for the sake of completeness, the simple but less efficient Student’s t-test was applied to observations at each individual time-point.
All calculations were performed with the statistical programming language Genstat 5
Ž . Ž .
committee 1993 . Effects were considered significant if P-0.05 nssnot significant .
Ž .
Unless stated otherwise, data are presented as mean "SEM . Data of both trials were comparable and no significant trial effects were observed. Consequently, data of both trials were combined for further analyses.
3. Results
3.1. Intra-test consistency
There was no agreement between responses in the first and the second backtest. Rank
Ž . Ž . Ž . Ž .
escape attempts, duration of escape behaviour and number of vocalizations. Moreover, no consistency was found for responses to the first and the second novel environment test: for latency to leave the home pen, locomotion in the corridor, latency to human
Ž . Ž . Ž . contact, and cortisol response, correlations were y0.06 ns , 0.21 ns , 0.01 ns and
Ž .
y0.07 ns , respectively. In contrast, aggression measured in both group-feeding
Ž .
competition tests, was found to be highly consistent Rss0.61; Ps0.003 .
3.2. Inter-test consistency: backtest resistanceÕs. other Õariables
Since backtest behaviour was not found to be consistent upon repeated testing, relationships between escape behaviour in the backtest and responses to other tests or challenges were first studied separately for each backtest. The piglet’s reactions to the first backtest were higher correlated to various other variables than reactions in the
Ž second backtest did. For instance, mean correlations with aggression were 0.33 Ps
. Ž .
0.02 and 0.10 ns , for resistance in the first and the second backtest, respectively. These findings led us to consider data with respect to behaviour in the first backtest, carried out at a very young age with rather naive piglets, for further analysis.
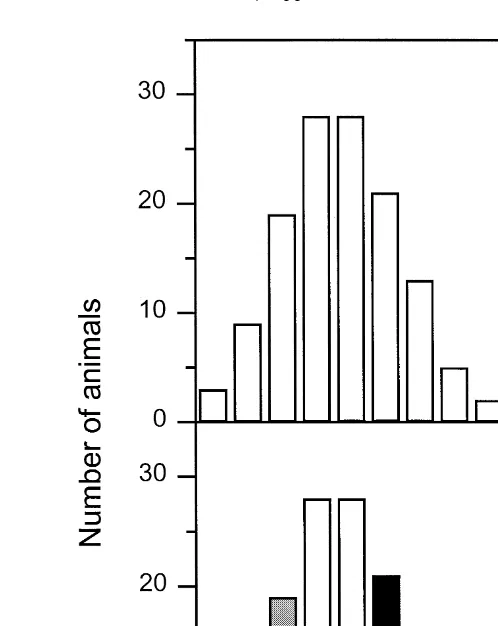
3.2.1. Backtest behaÕiour
Ž .
Fig. 2A shows the histogram for resistance number of escape attempts of individual gilts in the first backtest. The figure suggests an unimodal distribution, with no indication for a limited number of isolated classes. However, this distribution may reflect an underlying continuum in individual variation and does not exclude that animals towards the ends of the scale have a prevalence for one or another strategy. To
Ž
test this, we selected gilts with extreme numbers of escape attempts roughly the top and .
bottom 25% of the distribution . By this selection, we also reduced the influence of Ž
‘‘measurement error’’ in number of escape attempts lower or higher values just by .
chance . On the basis of the histogram, we removed gilts in the middle two highest bars from the analysis, which seems to be a reasonable compromise with respect to the number of animals left for analysis. The two groups thus selected were entered as a two
Ž .
level factor in a statistical model see statistical analysis . Piglets were classified as low Ž .
resistant LR when less than three escape attempts were made, and as high resistant ŽHR when more than four escape attempts were observed Fig. 2B . A total of 31 gilts. Ž . Žoriginating from 20 litters was classified as LR and 45 gilts originating from 23. Ž
.
litters as HR. Table 1 shows a summary of the distribution of LR and HR gilts in the 16
Ž .
groups of 8 pigs in the fattening pens . When resistance was expressed as percentage of
Ž .
escape behaviour per min, a high and significant P-0.001 contrast was also seen: 9.6 Ž"1.1 and 41.5. Ž"2.6 %, for LR and HR gilts, respectively. Numbers of vocalizations.
Ž . Ž .
were also found to differ significantly P-0.01 : LR gilts vocalized 12 "3 and HR Ž .
animals 32"2 times.
3.2.2. Associations with aggression in the group-feeding competition tests
The LR gilts in each pen in the first group-feeding competition test, showed
Ž .
significantly P-0.05 lower aggression towards other pigs than the HR animals in
Ž . Ž .
Ž . Ž .
Fig. 2. A The histogram of escape behaviour number of escape attempts of gilts in a 60-s backtest
Ž . Ž .
performed at 2–4 days of age ns128 ; B The same distribution as above, but after classification of extreme
Ž . Ž
responding gilts as either low resistant LR; less than 3 escape attempts; ns31 or high resistant HR; more
.
than 4 escape attempts; ns45 .
Ž .
The contrast in aggression between LR and HR gilts was also significant P-0.01 in
Ž . Ž .
the second group-feeding competition test: indexes of 3.5 "0.44 vs. 5.7 "0.36 , respectively.
Table 1
Distribution of LR and HR gilts in the fattening pens
Trial 1 Trial 2
Pen 1 2 3 4 5 6 7 8 9 10 11 12 13 14 15 16
aLR 2 2 2 3 2 2 2 1 2 2 2 2 1 2 2 2
3.2.3. Associations with reactions to the noÕel enÕironment tests
The relationships between backtest resistance and responses to the repeated novel environment test are shown in Table 2. When compared to HR gilts, LR animals showed
Ž .
a significantly P-0.05 longer latency time to leave their home pen in the first novel
Ž .
environment test and a tendency Ps0.05 for a longer latency time in the second one. Ž
For latencies to contact a human and for cortisol responses, significantly P-0.05 and .
P-0.01, respectively higher values were seen for LR gilts in the first novel environ-ment test. No differences for these parameters were found in the second test. Locomo-tions in the corridor did not differ between LR and HR gilts in either test.
3.2.4. Associations with teat order
Ž .
The two anterior teat pairs were significantly P-0.05 more frequently occupied by HR gilts than expected on a random basis. The frequency data at the anterior teats for
Ž .
LR gilts were not found to differ from expected random values. The ratio LR:HR at the anterior teats was 1:3. At the two posterior teat pairs, frequency data for LR and HR did not differ from those expected on a random basis, and the ratio LR:HR gilts was 1:1.
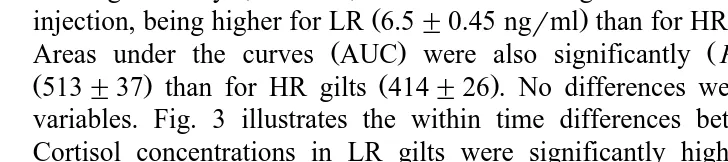
3.2.5. Associations with cortisol responses to routine weighing
Ž .
The cortisol response increase to weighing at 25 weeks of age was significantly ŽP-0.05 higher in LR gilts 1.07. Ž "0.11 ngrml than in HR animals 0.51. Ž "0.14
.
ngrml . Baseline cortisol concentrations did not differ between LR and HR gilts.
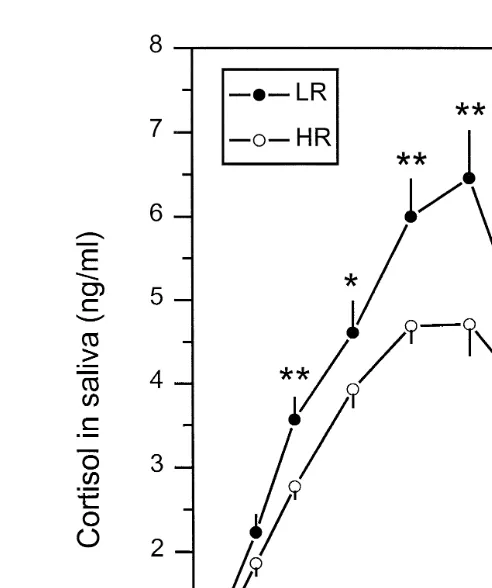
3.2.6. Associations with cortisol responses to ACTH
When analyzing the characteristics of individual cortisol plots, backtest resistance
Ž .
was significantly P-0.01 related to the height of the cortisol peak after ACTH
Ž . Ž .
injection, being higher for LR 6.5"0.45 ngrml than for HR gilts 5.1"0.35 ngrml .
Ž . Ž .
Areas under the curves AUC were also significantly P-0.05 higher for LR Ž513"37 than for HR gilts 414. Ž "26 . No differences were found for other curve. variables. Fig. 3 illustrates the within time differences between LR and HR gilts.
Ž .
Cortisol concentrations in LR gilts were significantly higher at 15 P-0.01 , 30 ŽP-0.05 , 45 P. Ž -0.01 and 60 P. Ž -0.01 min after ACTH injection..
Table 2
Ž . Ž .
Characteristics of responses mean"SEM to the repeated novel environment test for low resistant LR and
Ž .
high resistant HR gilts
Novel environment test 1 Novel environment test 2
LR HR LR HR
UU U
Ž . Ž . Ž . Ž . Ž .
Latency time to leave home pen s 213 22.5 131 18.1 159 35.3 97 10.6
Ž . Ž . Ž . Ž .
Locomotion in corridor 64 13.2 77 4.5 54 8.0 55 4.9
Žaof sections entered.
UU
Ž . Ž . Ž . Ž . Ž .
Latency time to contact human s 52 3.5 37 3.4 38 6.1 29 3.0
UUU
Ž . Ž . Ž . Ž . Ž .
Ž . Ž .
Fig. 3. Mean "SEM salivary cortisol concentrations ngrml of 45 HR and 31 LR gilts before and after
Ž .
administration of ACTH1-24 200 IU per pig; i.m. injection . Differences between LR and HR gilts within timepoints:UUP-0.01,UP-0.05.
3.2.7. Associations with body weight
At 4 weeks of age, but not at birth, the difference between body weights of LR Ž7.21"0.29 kg and HR gilts 8.27. Ž "0.23 kg was significant P. Ž -0.05 . At 10 weeks.
Ž .
of age, a tendency Ps0.09 for a higher body weight of HR gilts was observed: 33.2 Ž"0.9 vs. 31.3. Ž"0.8 kg. No differences between LR and HR gilts were observed at. the other ages. Differences in body weight between batches were significant at 4 ŽP-0.01 , 10 P. Ž -0.01 and 25 P. Ž -0.05 weeks of age..
4. Discussion
4.1. Intra-test consistencies
test. We propose a few explanations for these discrepancies. For example, they may be
Ž .
attributed to differences in stability of underlying emotions motivations of behavioural and physiological reactions to a certain test. Individual aggression, as the underlying emotion of behaviour in the group-feeding competition test, was highly consistent between two occasions. This high consistency may be due to the similarity in the purpose of performing that behaviour, i.e., the biological motivation to feed, associated
Ž . Ž .
with aggression to fulfil that need see also Section 4.2 . Erhard and Mendl 1997 showed that aggression, displayed towards intruders, is a relatively stable personality trait of individual pigs, being independent of age. Reactions in the novel environment test were not consistent on two occasions, and it was seen that responses to the second test were much reduced. This may indicate that animals may be affected by the first test, resulting in an altered motivation of responses over time to a comparable test situation. An altered underlying motivation of responses over time to comparable test situations
Ž . Ž .
was also observed by Erhard and Mendl 1999a and Erhard et al. 1998 for behaviour in a tonic immobility test. They showed that susceptibility to tonic immobility changed across different test days. Our results may reflect that when tested for the first time, latency times to leave the home pen may be a measure of fear or timidity to leave the
Ž .
familiar environment Archer, 1973; see also Erhard and Mendl, 1999a . However, when the test is repeated, the threatening impact of leaving the home pen may be much
Ž .
reduced and reactions may be a reflection of reduced fear or another balance of Ž .
emotion s . An increased willingness of pigs to move from their home pens voluntarily Ž .
upon repeated opening of the door was also found by Geverink et al. 1998 . A similar reasoning for a reduced fearfulness upon reexposure, may be followed for the shortened latency period to contact an experimenter in the human approach test. The perception of the novel environment test may also be changed by aging, i.e., with an increase in age,
Ž .
animals become more experienced and unescapable difficulties may arise in
standard-Ž .
ization of a test situation methodological problems when repeated. An example of the Ž
latter is the size of an animal, possibly differing much between two occasions especially .
in adolescent animals , may influence the perception of a test situation, such as a novel corridor and a human being. This may be substantiated by results of Jensen et al. Ž1995b who found that some behavioural patterns of pigs correlated well between three.
Ž . Ž
subsequent novel environment open field tests. In their study with piglets at the age of .
7 weeks , tests were only two days apart, whereas this was 14 weeks in our study. The previous arguments may also explain why the reactions of piglets differed so much
Ž .
between two backtests. Specific adverse experiences that may affect the perception of the threat, such as the backtest are those which were applied shortly after the first backtest: tail and eye-teeth clipping, and injection of iron. The non-repeatability of
Ž .
reactions to the backtest agrees with results of Forkman et al. 1995 , but contrasts
Ž .
findings of Hessing et al. 1993; 1994 . To some extent these differences may be attributed to the time span between subsequent tests, being shorter in the studies of
Ž .
Hessing et al. 1993; 1994 .
Ž .
that animals are part of often non-homogenous groups. The design of our study is thus a reflection of everyday life. Nevertheless, it may be possible that differences between Ždynamics of groups may affect correlations, thereby limiting the interpretation of the. data. This may especially be considered for individual responses in the novel environ-ment test, in which group-specific processes may determine the magnitude of individual responses, and animals were part of different groups on two occasions. Individual scores
Ž .
of aggression indices in the group-feeding competition test, on the other hand, were Ž .
rated 1–8 within each group, and individuals were part of the same groups on both occasions.
4.2. Inter-test consistencies
We provide some support for the validity of the backtest to gather information about differences between animals at a very early stage. The quality of a backtest at a very young age may be attributed to testing of rather naive animals, unaffected by previous experiences. The population distribution of escape behaviour in the first backtest was
Ž .
found to be continuous unimodality; Fig. 2 . In our study, we have selected the extreme responders in the first backtest, the LR and HR gilts, to study relationships between resistance in the backtest and responses in other challenge tests. With the statistical procedure to test differences between LR and HR gilts, problems arising from relation-ships between animals in the same group are circumvented. The pooled within-group contrasts between low and high responders for the backtest do not affect the validity of conclusions about the presence and nature of relationships. Although it may be argued that the differences between mean responses of LR and HR gilts do not necessarily reflect differences within a homogenous population of individuals, our design reflects routine procedures in modern pig husbandry.
The extremes, according to resistance in the first backtest, may adopt responses that resemble those observed in studies of rodent coping styles. Behaviourally, within each group, gilts classed as HR showed a higher mean score of aggression than those classed as LR. Behavioural studies in rodents have indicated that the more aggressive animals
Ž
cope more actively with environmental challenges Benus et al., 1991; Koolhaas et al., .
1997 . Measures of aggression in these rodent studies were based upon measures of attack latencies in resident-intruder paradigms, mimicking aggression in a setting that conforms to what happens in the field. The common function of aggression, however, is clearly related to the establishment and defense of property, like territory and food. In our study, we have investigated two situations, in which aggression occurred to establish defense of food, i.e., in the group-feeding competition tests and in competition for teats during the suckling period. We have observed a relationship between higher resistance in the first backtest and a higher number of attacks towards others in the group-feeding
Ž .
competition tests. This agrees with results of Hessing et al. 1993 , who also showed that the piglets they classified as resistant ones in the backtest, were mostly the aggressive animals. The piglets they classified as aggressive ones in social confrontation tests shortly after birth, were also the ones that mainly showed aggressive behaviour after mixing at 10 and again at 15 weeks of age. Contrasting results were found by Mendl et
Ž . Ž .
behaviour in the tonic immobility test, a test much resembling the backtest. With regard to competition for teats, we have observed the teat order. LR gilts less frequently
Ž .
occupied the anterior teats. Although controversial Fraser and Jones, 1975 , it is often suggested that the glands of the anterior teats produce more milk, and that piglets actively compete for these teats. Once a teat is preferred the occupying piglet usually
Ž .
defends it against the others. Hoy et al. 1995 showed that piglets in anterior position had the highest daily weight gain during the suckling period. Our results are in line with this, since a difference in body weight developed from birth to 4 weeks of age. Regarding their mean scores within groups, pigs classed as HR gained more weight than the LR classed ones. It seems that the HR animals took advantage of their predominant suckling position at the anterior teats. The difference in body weight was less prevalent present at 10 weeks of age, and was disappeared at the age of slaughter.
Ž
Furthermore, when tested for the first time in the novel environment test with respect .
to mean scores within each group , those gilts classed as LR hesitated for a longer time to leave the home pen and were more inhibited to approach a human being, than those animals classed as HR. This may reflect a more reactive feature of the former animals. Studies of reactive rodents showed that their behaviour is more directed by
environmen-Ž .
tal stimuli extrinsic behavioural control , whereas the behaviour of proactive rodents is
Ž .
more routine-like and intrinsically determined Benus et al., 1991 . This means that upon a change in the environment, reactive animals more gradually and intensively respond to changes, whereas the reactions of proactive animals are less inhibited. To substantiate
Ž .
this, Hessing et al. 1994 showed that their so-called reactive pigs, were more inhibited to approach a novel object, but that they spent more time in exploring it, than proactive animals did. A more intense exploration of the corridor by more reactive animals may
Ž .
explain why in our study the mean score of the number of sections entered in the corridor did not differ between LR and HR classed gilts, although LR pigs took longer to enter the corridor. The more reactive feature of LR pigs was less evident in the second test, suggesting that for this parameter backtest resistance only reflects the
Ž .
behaviour evoked upon a first challenge i.e., fear-evoked: see Section 4.1 . In line with Ž .
these findings, Erhard and Mendl 1999a showed that tonic immobility revealed Ž . something about the behaviour of pigs that were put in a potentially fearful novel environment for the first time, but not upon reexposure. In our study, regarding mean scores within their groups, those gilts classed as LR also took more time to initiate contact with the experimenter upon a sudden approach, but again this was only seen in the first test.
Physiologically, when compared within groups to animals classed as HR, gilts
Ž .
characterized as LR had higher mean scores of reactivity of the hypothalamic –pitui-Ž .
tary–adrenocortical HPA system. This higher responsiveness of the pituitary adreno-cortical system of LR gilts may resemble reaction patterns of the same axis observed in
Ž
rodents having reactive coping strategies Koolhaas and van Oortmerssen, 1988; Kool-.
haas et al., 1997 . The LR gilts in our study displayed higher salivary cortisol responses to the first novel environment test, to routine weighing and to administration of a high dose of ACTH. We did not observe differences in baseline cortisol concentrations
Ž . between LR and HR gilts, which contrasts findings of Hessing et al. 1994 who
Ž .
Moreover, they found in the latter animals that the cortisol response to novelty was generally lower than in more resistant pigs, being opposite to our results. However, as they also argued in their discussion, samples were taken just before and 90 min after testing, so that it may be questioned whether the actual cortisol responses were measured in both groups, since both timepoints were so far apart. Also, they did not find a
Ž .
difference between backtest extremes in plasma total cortisol concentrations after intra-muscular administration of a high dose of ACTH. Again, this may be explained by
Ž .
the previous reasoning that time intervals between few samplings were too long and did not allow to discriminate between animals. This is supported by our data, showing that after 60 min following injection of a high dose of ACTH, differences between
Ž .
backtest extremes in their cortisol concentrations disappeared Fig. 3 . Another factor responsible for these diverging results between the mentioned studies may be attributed to the fraction of cortisol measured, i.e., the predominantly unbound fraction in saliva or
Ž .
the total i.e., unbound and bound fraction in plasma. The salivary cortisol concentra-tion reflects the biologically active plasma unbound cortisol level and is unaffected by
Ž .
elevations in cortisol binding globulins CBG , which confuse the interpretation of
Ž .
plasma cortisol levels Vining et al., 1983 .
5. Conclusions
Although selective breeding took place among domesticated pigs, we still observe large individual differences in behaviour and physiology. Our results indicate that individual aggression is a stable personality feature of gilts over time, shown in the group-feeding competition test. In contrast, we failed to show consistency in reactions to a backtest and a novel environment test. We found no indications for the existence of different categories of pigs. However, we argue that for gilts with extreme high or low resistance in a firstly performed backtest, at a very young age, relationships may exist between responses in this test and several other variables at later age. To conclude, our findings may provide support for the existence of behavioural and physiological responses in pigs, resembling those of proactive and reactive rodents.
Acknowledgements
We thank the personnel of the experimental farm ‘‘Bantham’’ for taking care of the animals and for their practical assistance. Furthermore, we would like to thank Bas Engel and Willem Buist for their help with the statistical analysis.
References
Archer, J., 1973. Tests for emotionality in rats and mice: a review. Anim. Behav. 21, 205–235.
Bohus, B., Benus, R.F., Fokkema, D.S., Koolhaas, J.M., Nyakas, C., van Oortmerssen, G.A., Prins, A.J.A., de Ruiter, A.J.H., Scheurink, A.J.W., Steffens, A.B., 1987. Neuroendocrine states and behavioral and
Ž .
physiological stress responses. In: De Kloet, E.R., Wiegant, V.M., de Wied, D. Eds. , Progress in Brain Research, Vol. 72. Elsevier, Amsterdam, pp. 57–70.
Ž .
Buist, W., Engel, B., 1994. Procedure VWALD. In: Goedhart, P.W., Thissen, J.T.N.M. Eds. , Genstat 5 w x
GLW-DLO procedure library manual release 3 1 , Report LWA-94-17. DLO-Agricultural Mathematics Group, Wageningen.
Engel, B., 1990. The analysis of unbalanced linear models with variance components. Statistica Neerlandica 44, 195–219.
Erhard, H.W., Mendl, M., 1997. Measuring aggressiveness in growing pigs in a resident-intruder situation. Appl. Anim. Behav. Sci. 54, 123–136.
Erhard, H.W., Mendl, M., 1999a. Tonic immobility and emergence time in pigs — More evidence for behavioural strategies. Appl. Anim. Behav. Sci. 61, 227–237.
Erhard, H.W., Mendl, M., Christiansen, S.B., 1999b. Individual differences in tonic immobility may reflect behavioural strategies. Appl. Anim. Behav. Sci. 64, 31–46.
Erhard, H.W., Mendl, M., van Schotthorst, L., 1998. Qualitative and quantitative effects of handling on tonic immobility in pigs. Proceedings 32nd Congress of the International Society for Applied Ethology, Clermont-Ferrand, France, abstr., pp. 110.
Forkman, B., Furuhaug, I.L., Jensen, P., 1995. Personality, coping patterns, and aggression in piglets. Appl. Anim. Behav. Sci. 45, 31–42.
Fraser, D., Jones, R.M., 1975. The ‘teat order’ of suckling pigs: I. Relation to birth weight and subsequent growth. J. Agric. Sci. 84, 387–391.
Ž .
Genstat 5 committee 1993 . Reference Manual, Release 3. Clarendon Press, Oxford.
Geverink, N.A., Kappers, A., van de Burgwal, J.A., Lambooij, E., Blokhuis, H.J., Wiegant, V.M., 1998. Effects of regular moving and handling on the behavioral and physiological consequences of pigs to preslaughter treatment and consequences for subsequent meat quality. J. Anim. Sci. 76, 2080–2085. Hessing, M.J.C., Hagelsø, A.M., van Beek, J.A.M., Wiepkema, P.R., Schouten, W.P.G., Krukow, R., 1993.
Individual behavioural characteristics in pigs. Appl. Anim. Behav. Sci. 37, 285–295.
Hessing, M.J.C., Hagelsø, A.M., Schouten, W.P.G., Wiepkema, P.R., van Beek, J.A.M., 1994. Individual behavioral and physiological strategies in pigs. Physiol. Behav. 55, 39–46.
Hoy, S., Lutter, C., Puppe, B., Wahner, M., 1995. Correlations between vitality of newborn piglets, teat order,¨ mortality, and live weight development up to weaning. Berl. Munch. Tierarztl. Wschr. 108, 224–228.¨ ¨ Jensen, P., 1994. Fighting between unacqainted pigs — effects of age and of individual reaction pattern. Appl.
Anim. Behav. Sci. 41, 37–52.
Jensen, P., Rushen, J., Forkman, B., 1995a. Behavioural strategies or just individual variation in behaviour? A lack of evidence for active and passive piglets. Appl. Anim. Behav. Sci. 43, 135–139.
Jensen, P., Forkman, B., Thodberg, K., Koster, E., 1995b. Individual variation and consistency in piglet¨ behaviour. Appl. Anim. Behav. Sci. 45, 43–52.
Koolhaas, J.M., van Oortmerssen, G.A., 1988. Individual differences in disease susceptibility as a possible factor in the population dynamics of rats and mice. Neth. J. Zool. 38, 111–122.
Koolhaas, J.M., De Boer, S.F., Bohus, B., 1997. Motivational systems or motivational states: Behavioural and physiological evidence. Appl. Anim. Behav. Sci. 53, 131–143.
Koolhaas, J.M., Korte, S.M., De Boer, S.F., Van der Vegt, B.J., Van Reenen, C.G., Hopster, H., De Jong, I.C., Ruis, M.A.W, Blokhuis, H.J., Coping styles in animals: current status in behavior and stress-physiology. Neurosci. Biobehav. Rev., in press.
Lawrence, A.B., Terlouw, E.M.C., Illius, A.W., 1991. Individual differences in behavioural responses of pigs exposed to non-social and social challenges. Appl. Anim. Behav. Sci. 30, 73–86.
Lee, Y.P., Graig, J.V., Dayton, A.D., 1982. The social rank index as a measure of social status and its association with egg production in White Leghorn pullets. Appl. Anim. Ethol. 6, 377–390.
Mendl, M., Erhard, H.W., Christiansen, S.B., 1998. No evidence for strong links between personality traits in pigs. Proceedings 32nd Congress of the International Society for Applied Ethology, Clermont-Ferrand, France, abstr., pp. 65.
Ruis, M.A.W., Te Brake, J.H.A., Engel, B., Ekkel, E.D., Buist, W.G., Blokhuis, H.J., Koolhaas, J.M., 1997. The circadian rhythm of salivary cortisol in growing pigs: effects of age, gender and stress. Physiol. Behav. 62, 623–630.
Scheffe, H., 1959. The analysis of variance. John Wiley, New York, pp. 247.´
Spoolder, H.A.M., Burbidge, J.A., Lawrence, A.B., Simmins, P.H., Edwards, S.A., 1996. Individual be-havioural differences in pigs: intra- and inter-test consistency. Appl. Anim. Behav. Sci. 49, 185–198. Thodberg, K., Jensen, K.H., Herskin, M.S., 1999. A general reaction pattern across situations in prepubertal
gilts. Appl. Anim. Behav. Sci. 63, 103–119.
Vining, R.F., McGinley, R.A., Maksvytis, J.J., Ho, K.Y., 1983. Salivary cortisol: a better measure of adrenal cortical function than serum cortisol. Ann. Clin. Biochem. 20, 329–335.
Von Holst, D., Fuchs, E., Stohr, W., 1983. Physiological changes in male Tupaia belangeri under different¨
Ž .