METHODS FOR MULTITEMPORAL ANALYSIS OF SATELLITE DATA
AIMED AT ENVIRONMENTAL RISK MONITORING
M.Caprioli a,, A. Scognamiglio a
a
POLITECNICO DI BARI, Dipartimento di Vie e Trasporti, 70125 Bari, Italy -
[email protected]a
POLITECNICO DI BARI, Dipartimento di Vie e Trasporti, 70125 Bari, Italy –
[email protected]Commission VII, WG VII/5
KEY WORDS: DEM/DTM, LIDAR, Satellite, Stereoscopic, Photogrammetry, Remote Sensing
ABSTRACT:
In the last years the topic of Environmental monitoring has raised a particular importance, also according to minor short-term stability and predictability of climatic events. Facing this situation, often in terms of emergency, involves high and unpredictable costs for public Agencies.
Prevention of damages caused by natural disasters does not regard only weather forecasts, but requires constant attention and practice of monitoring and control of human activity on territory. Practically, the problem is not knowing if and when an event will affect a determined area, but recognizing the possible damages if this event happened, by adopting the adequate measures to reduce them to a minimum, and requiring the necessary tools for a timely intervention. On the other hand, the surveying technologies should be the most possible accurate and updatable in order to guarantee high standards, involving the analysis of a great amount of data. The management of such data requires the integration and calculation systems with specialized software and fast and reliable connection and communication networks.
To solve such requirements, current satellite technology, with recurrent data acquisition for the timely generation of cartographic products updated and coherent to the territorial investigation, offers the possibility to fill the temporal gap between the need of urgent information and official reference information.
Among evolved image processing techniques, Change detection analysis is useful to facilitate individuation of environmental temporal variations, contributing to reduce the users intervention by means of the processes automation and improving in a progressive way the qualitative and quantitative accuracy of results.
The research investigate automatic methods on land cover transformations by means of "Change detection" techniques executable on satellite data that are heterogeneous for spatial and spectral resolution with homogenization and registration in an unique digital information environment.
In the present work we tested some areas of study particularly interesting for the knowledge of the morphology changes of land cover, in particular the area of Fasano in Apulia Region (Italy) and protected area of the Park of Alta Murgia, both of them with frequent episodes of land transformation.
We tested the usability of heterogeneous and freely available images to realize a DEM extraction process to achieve fast and low cost system of analysis.
We used archival stereo-pairs Ikonos and LIDAR survey comparing with Aerial photogrammetric DEM extraction.
1. INTRODUCTION
In recent years research in the field of geometric correction of satellite data has reported remarkable methodological advances, implementing registration and ortho-rectifying algorithms which are now consolidated methods for the international scientific community.
Generally, such procedures are carried out to correct or to eliminate image errors due to the bad functioning of sensors and to the atmospheric diffusion effects. Quality of data also depends on the intensity of spectral distribution of energy received by the sensor, with significant variations in its passage through the atmosphere.
The automation and repeatability of the procedure on constantly updated data will permit the development of a monitoring system for land cover transformations with environmental risk, not only to support preliminarily decisions in strategic planning contexts, but also as a tool to verify
strategies and accomplishments, allowing modification of actions when the expected effects are not achieved.
To detect and classify a landslide, it is necessary to view the size and contrast of its features and the morphological expression of the topography within and around the landslide. Determining parameters are the type of movement that has occurred, the degree of present activity of the landslide, and the depth to which movement has occurred. The most common remote sensing tools used for the detection and classification of landslides are satellite imagery and aerial photography.
Monitoring landslide movement involves the comparison of landslide conditions over time, including the aerial extent of a landslide, its speed of movement, and the change in its surface topography (i.e. DEM comparison) .
The fundamental merits of the high resolution remote sensing are the ability to perform surveys at regular intervals in the operation, the characteristics of the image and the revisit times. These features are very useful in environmental monitoring International Archives of the Photogrammetry, Remote Sensing and Spatial Information Sciences, Volume XXXIX-B7, 2012
especially in case of emergency or also in medium scale cartographic production, particularly in the zones of difficult access and in developing countries.
The satellite Ikonos and Geoeye is able to acquire images in stereopair with two different perspectives, during the same orbital transit and with a revisit time of 3 days for every point on the terrestrial surface and it can effect two-way scannings and acquire up to 7 crawled adjoining strips (each of around 11-13 kms) in a single step.
2. STEREO IMAGES
IKONOS® Pro 1-meter and 4-meter products are perfect for projects requiring high-resolution imagery and positional accuracy when ground control may be costly, difficult, or impossible to acquire.
Providing a strong base for three-dimensional feature recognition, extraction and exploitation, the product provides two images with stereo geometry to support a wide range of stereo imagery applications such as DEM creation and three-dimensional feature extraction. Stereo products in epipolar or map projections provide RPC camera model data.
The present study reports on the metric comparison between the DEMs respectively realized with the Stereo aerial pair and with the satellite Ikonos stereo pair, and another test with photogrammetric DEM and a Lidar survey. In a short time we will compare also GeoEye-1 stereo pair.
The satellite metadata are:
IKONOS METADATA Sensor Type: Satellite Sensor Name: IKONOS-2
Processing Level: Standard Geometrically Corrected Image Type: PAN/MSI
Pan Resolution mt.1.0 MSI Resolution mt 3.28
Interpolation Method: Cubic Convolution Multispectral Algorithm: Projective
Map Projection: Universal Transverse Mercator Datum: WGS84
File Format: GeoTIFF
Bits per Pixel per Band: 11 bits per pixel Multispectral Files: RGB File
Spectral range
Processing Level: Standard Geometrically Corrected Image Type: PAN/MSI
Pan Resolution mt.0.50 MSI Resolution mt 1.64
Interpolation Method: Cubic Convolution
Map Projection: Universal Transverse Mercator Datum: WGS84
File Format: GeoTIFF
Bits per Pixel per Band: 11 bits per pixel Multispectral Files: RGB File
Spectral range
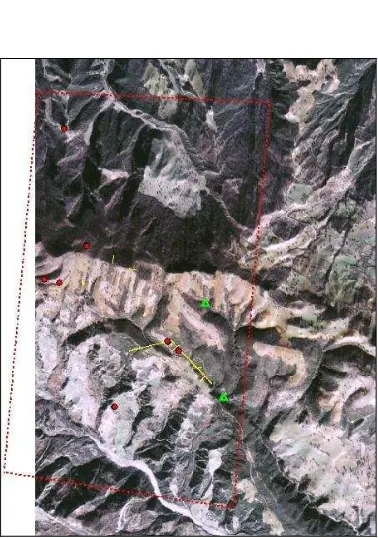
Figure 1. Test area Ikonos + Aerial
Figure 1 shows the test area, chosen in the Basilicata region for its characteristics of rockfall area, which was part of the comparison indicated.
The Ikonos stereo pairs were used for the extraction of DEM by automatic correlation, with different software (LPS, Socet Set, Micromap) by geometric parameters of the satellite with the relevant RPC.
The stereo pairs were obtained using a Wild 15/4 UAGA-F aerial camera with C=153.22 mm wide frame of about 1: 16000 suitable for cartography at a scale of 1: 5000.
The cartography and its DEM autocorrelation were obtained using standard procedures of Photogrammetric survey.
Figure 2. DEM and ortophoto drapping (test 1)
Figure 3. Some Ground Control Point (test 1)
The second test was performed on the area of Fasano in Apulia region with DEM extraction by Aerial photogrammetry with 8 mt. grid provided by regional Gis and a Lidar DEM with 1 mt. grid produced by SIT s.r.l. company in Noci (BA).
Figure 4. DEM and ortophoto drapping (test 2)
Figure 5. DEM with some profiles (test 2)
3. COMPARISON
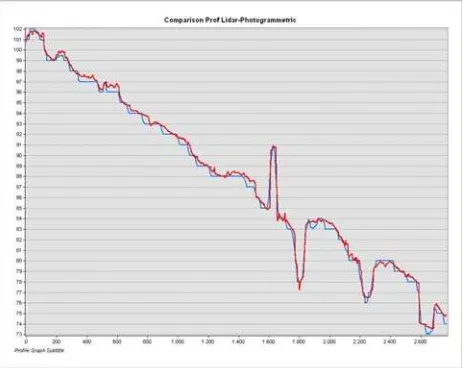
The comparison between the two products obtained in test 1 was carried out by examining some elevation profiles and a number of test points throughout the area.
Figure 6. Comparison between profiles (test 1)
Figure 7. Comparison between profiles (test 1) International Archives of the Photogrammetry, Remote Sensing and Spatial Information Sciences, Volume XXXIX-B7, 2012
Figure 8. Comparison between control points (test 1)
Figure 9. Error in positioning of GCP (test 1)
Figure 10. Control points in the second step on test 1
In these first elaborations without the use of the GCP (Figure 8) but only with the satellite RPC, we see a systematic error in the positioning layout. (Table 1)
In the second step we repeated operations using GCP by GPS survey, obtaining the results described in the following Table 2 and in Figure 10.
Table 1 Control points without GCP.
X Y Z
Ikon 1 599150,935 4463237,198 725,024
Ikon 2 599297,519 4463199,118 704,934
Ikon 3 599571,338 4463566,454 799,892
Ikon 4 599349,550 4464724,453 564,610
Ikon 5 600371,615 4462620,327 683,075
Ikon 6 600479,332 4462530,172 675,404
Ikon 7 599846,754 4461978,045 465,860
Aer_1 599147,551 4463239,714 725,971
Aer _2 599294,043 4463202,581 706,190
Aer _3 599567,640 4463570,711 800,754
Aer _4 599344,798 4464728,404 565,313
Aer _5 600367,604 4462624,089 683,997
Aer _6 600475,440 4462533,914 675,667
Aer _7 599843,005 4461980,968 467,047
diff_X diff_Y diff_Z
Ikon‐Aer_1 3,384 ‐2,516 ‐0,947
Ikon‐Aer _2 3,476 ‐3,463 ‐1,256
Ikon‐Aer_3 3,698 ‐4,257 ‐0,862
Ikon‐Aer _4 4,752 ‐3,951 ‐0,703
Ikon‐Aer _5 4,011 ‐3,762 ‐0,922
Ikon‐Aer _6 3,892 ‐3,742 ‐0,263
Ikon‐Aer _7 3,749 ‐2,923 ‐1,187
Table 2 Differences in Control points with GCP.
X Y Z
diff_X diff_Y diff_Z
Ikon‐Aer_1 ‐0,516 0,984 ‐0,047
Ikon‐Aer _2 ‐0,424 0,037 ‐0,356
Ikon‐Aer_3 ‐0,202 ‐0,757 0,038
Ikon‐Aer _4 0,852 ‐0,451 0,197
Ikon‐Aer _5 0,111 ‐0,262 ‐0,022
Ikon‐Aer _6 ‐0,008 ‐0,242 0,637
Ikon‐Aer _7 ‐0,151 0,577 ‐0,287
Figure 11. 3Dview of DEM
In the second test in the Fasano area we verified that there is a substantial congruence of the Dem extracted with aerial photogrammetric method and the LIDAR one.
Figure 12. Comparison between profiles (test 2)
Figure 13. Comparison between profiles (test 2)
Figure 14. Comparison between profiles (test 2)
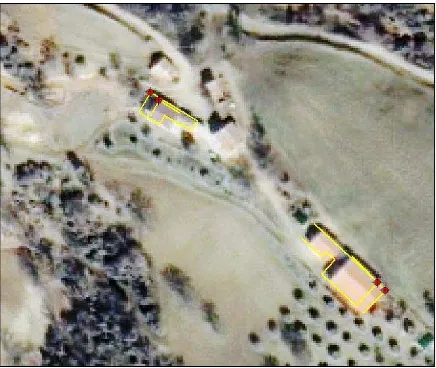
Figure 15. Zoom on new building (test 2)
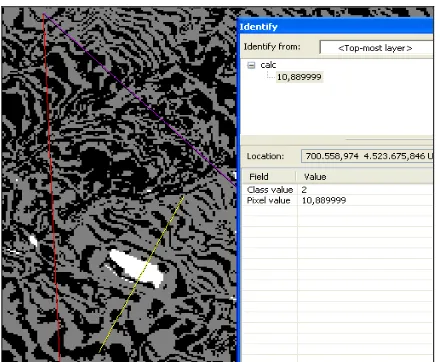
The map of the height difference clearly shows the areas for amendment of the land as highlighted in white in Figures 16 and in Figures 17.
Figure 16. Differences between two DEMs (test 2) International Archives of the Photogrammetry, Remote Sensing and Spatial Information Sciences, Volume XXXIX-B7, 2012
Jacobsen, K. (2003): DEM Generation from Satellite Data, EARSeL conference Ghent 2003
Hanley, H.B., Yamakawa. T., Fraser, C.S. (2002): Sensor Orientation for High Resolution Imagery, Pecora 15 / Land Satellite Information IV / ISPRS Com. I, Denver 2002, on CD
M. Crespi P. Capaldo F. Fratarcangeli A. Nascetti F. Pieralice. "Dsm generation from very high optical and radar sensors: problems and potentialities along the road from the 3d geometric modeling to the surface model". In proceedings IGARSS, Honolulu, Hawaii, USA, Luglio 2010
M. Crespi P. Capaldo F. Fratarcangeli A. Nascetti F. Pieralice. "Matching strategies for DSMs exstraction in urban area from high resolution satellite imagery". In proceedings EARSel Workshop, Ghent, Belgio, Settembre 2010
Figure 17. Differences between two DEMs (test 2)
It is interesting to note in the profile of figure 14 the difference of height both in the profile and in the map of the height differences, between the DEM of different time, after the construction of new building for a Mall.
M. Crosetto, F. Pérez Aragues, Radargrammetry and SAR interferometry for DEM generation: validation and data fusion, Proceedings of CEOS SAR Workshop, ESA-CNES, Toulouse, France, 1999.
F.W. Leberl, Radargrammetric image processing, Artech House, Norwood, USA, 1990.
Z. Li, Q. Zhu, C. Gold, Digital terrain modeling: principles and methodology, CRC Press, Florida, USA, 2005.
4. CONCLUSION
In conclusion, the present testing has verified the procedure for the extraction of DEM from only satellite stereo images by using both the parameters supplied with the stereo pair (RPC) and the ground control points.
S. Méric, F. Fayard, E. Pottier, Chapter 20 - "Radargrammetric SAR image processing" In: Pei-Gee Peter Ho (Eds.), Geoscience and Remote Sensing, Intech, 2009.
The second set of tests, in addiction, shows very good results in extraction of DEM both in Aerial photogrammetric method and in Lidar method.
The availability of GeoEye-1 stereo pair allows new tests which are still in progress and the results encourage further tests that compare images taken at different times for the detection of changes especially in the modification of the DEM in order to know immediately the consequences of natural disasters or in search of environmental abuse.
H. Raggam, R. Perko, K. Gutjahr, Investigation of the Stereo-Radargrammetric Mapping Potential of TerraSAR-X, Proceeding of the 29th EARSeL Symposium, Chania, Greece, pp. 371 – 380, 2009.
T. Toutin, L. Gray, State-of-the-art of elevation extraction from satellite SAR data, ISPRS Journal of Photo-grammtery & Remote Sensing 55, ELSEVIER, pp. 13-33, 2000.
6. ACKNOWLEDGEMENTS
The authors thank the SIT s.r.l. Noci (BA) for collaboration in the test run, the company Planetek of Bari and the Dipartimento di Geologia e Geofisica University of Bari.
5. BIBLIOGRAPHY
Baudoin,A., Goudy, P., Rouze, M. (2001): The Pleiades Program, Joint ISPRS Workshop “High Resolution Mapping from Space 2001”, Hannover 2001, on CD
Dial, G., Grodecki, J. (2002): IKONOS Accuracy without Ground Control, Pecora 15 / Land Satellite Information IV / ISPRS Com. I, Denver 2002, on CD
Grodecki, J. (2001): IKONOS Stereo Feature Extraction – RPC Approach, ASPRS annual conference St. Louis, 2001, on CD
Jacobsen, K. (2002): Mapping with IKONOS Images, EARSeL, Prag 2002“Geoinformation for European-wide Integration” Millpress ISBN 90-77017-71-2, pp 149 – 156