AN AUTOMATED ROAD ROUGHNESS DETECTION FROM MOBILE LASER
SCANNING DATA
Pankaj Kumar∗, Eduard Angelats
Geomatics Division
Centre Tecnol`ogic de Telecomunicacions de Catalunya (CTTC) - CERCA Castelldefels, Barcelona, Spain - (pankaj.kumar, eduard.angelats)@cttc.es
KEY WORDS:Mobile Laser Scanning, Roughness, Intensity, Threshold, Filtering
ABSTRACT:
Rough roads influence the safety of the road users as accident rate increases with increasing unevenness of the road surface. Road roughness regions are required to be efficiently detected and located in order to ensure their maintenance. Mobile Laser Scanning (MLS) systems provide a rapid and cost-effective alternative by providing accurate and dense point cloud data along route corridor. In this paper, an automated algorithm is presented for detecting road roughness from MLS data. The presented algorithm is based on interpolating smooth intensity raster surface from LiDAR point cloud data using point thinning process. The interpolated surface is further processed using morphological and multi-level Otsu thresholding operations to identify candidate road roughness regions. The candidate regions are finally filtered based on spatial density and standard deviation of elevation criteria to detect the roughness along the road surface. The test results of road roughness detection algorithm on two road sections are presented. The developed approach can be used to provide comprehensive information to road authorities in order to schedule maintenance and ensure maximum safety conditions for road users.
1. INTRODUCTION
Road roughness is generally considered to be the deviation of the road surface from a designed surface grade that influences safety conditions for road users (De Farias and De Souza, 2009). Road roughness conditions can be categorized into surface de-fects, joints, cracks and distortion which may develop as a result of road use, fatigue, thermal changes, moisture damage, construc-tion or utility repair processes. Rough roads are often associated with some of the typical types of road accidents such as loss of control, running off the road and hitting fixed or moving objects (Bester, 2003). Several studies have indicated that the accident rate increases with increasing unevenness of the road surface (Ihs, 2004; Davies et al., 2005). They may also affect rolling resis-tance, ride quality, vehicle operating costs and fuel consumption (Sayers and Karamihas, 1998). These roughness conditions are required to be precisely recorded, located, measured and classi-fied in order to schedule maintenance, repair and effective man-agement of road networks (Kumar et al., 2016). Road safety con-siderations must result in a road environment that should be self-explaining and forgiving, in the sense that users are not faced with unexpected situations and their mistakes can be, if not avoided, corrected (ERSO, 2006).
The detection of these road roughness conditions until now has been based on either manual road inspections or digital annota-tion of images acquired along route corridor. The informaannota-tion collected through these surveys is sometimes incomplete and in-sufficient for qualitative evaluation of road roughness (Kumar et al., 2014). It can also be time consuming and expensive to con-duct these inspections on a large scale. Mobile Laser Scanning (MLS) systems provide a robust alternative by facilitating the ac-quisition of accurate and dense point cloud data along route cor-ridor in a rapid and cost-effective way (Kumar, 2012). The use of LiDAR technology for mapping route corridor enables
acqui-∗Corresponding author
sition of spatially referenced 3D data which contain elevation, intensity and pulse width attributes. These data attributes can be used for reliable detection of any roughness conditions present along the road surface. Moreover, the accuracy and point density of LiDAR data influences the process of precise road roughness detection. The accuracy refers to an error in vertical and horizon-tal positions of the targeted object while the point density is the number of points per square meter. The use of dense and uniform LiDAR point cloud data along the road surface enables a reliable detection of surface distortion, joints, cracks and other roughness conditions.
offset values were then used to find grade and cross-slope param-eters of a road segment. Similarly, Kumar et al. (2015b) devel-oped an approach in which Random Sample Consensus (RANSAC) model was used to fit a surface grid to MLS points and then stan-dard deviation of elevation residual values were used to estimate the roughness along the road surface. Apart from these, Inertial Measurement Units (IMUs) mounted on mobile mapping vehi-cles have also been used for measuring road roughness (Barsi et al., 2006; Kertesz et al., 2007; Wen, 2008). Some works have been reported based on estimating roughness over soil and other terrain surfaces from LiDAR data (Zhang and Russell, 2004; Hol-laus and Hofle, 2010). Stavens and Thrun (2006) applied a self-supervised machine learning approach to estimate terrain rough-ness from laser range data for off-road autonomous driving while Diaz et al. (2010) characterised surface roughness in agricultural soil by interpolating surface grid model from MLS data.
A priori knowledge of the road surface area facilitates a more ef-ficient estimation of roughness along its surface. An automated algorithm for extracting road edges from MLS data was presented in Kumar et al. (2013). The extracted road edge information is ap-plied to identify the LiDAR points that belong to the road surface. The identified points are then processed to detect the roughness present along the road surface. In this paper, an automated algo-rithm for detecting road roughness from MLS data is presented. The developed approach is based on the assumption that LiDAR elevation and intensity attributes can be used to detect roughness regions along the road surface. LiDAR points are interpolated to generate smooth intensity raster surface using point thinning pro-cess. This is followed by the implementation of morphological, thresholding and cluster filtering approaches to detect the road roughness. In Section 2, a detailed description of automated road roughness detection algorithm is provided. Section 3 presents the tests of algorithm on two road sections. In Section 4, the exper-imental results are discussed while the conclusions are drawn in Section 5.
2. METHODOLOGY
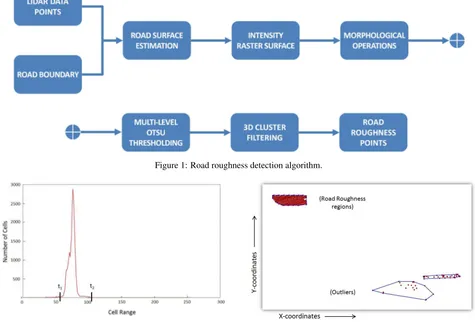
The input to road edge extraction algorithm consists ofnLiDAR point cloud datasets (30m width; 10m length; 5m height) and also n10m navigation data sections (Kumar et al., 2013). The dimen-sions of the input data sections were based on empirical tests as they impact on the efficiency of the process in terms of computa-tional cost. The selection of a 30m width ensured the inclusion of the road surface in the data; a 5m elevation removed the impact of vertical objects along the route corridor; while a 10m length was selected on the basis of the computational cost analysis (Ku-mar et al., 2015a). The automated road edge extraction algorithm as presented in Kumar et al. (2013), outputs the road boundary which is then used to identify the LiDAR points belonging to the road surface. The road roughness detection algorithm is applied to the estimated road surface LiDAR points. A workflow of the road roughness detection algorithm is shown in Figure 1. In the following sections, various processing steps involved in the algo-rithm are described in detail.
2.1 ROAD SURFACE ESTIMATION
The inputs to road roughness detection algorithm are LiDAR dataset and estimated road boundary. In its first step, a road boundary is overlaid on the LiDAR data such that the points outside the road boundary are removed, while inner points are retained to estimate the road surface.
The estimated road surface points are rotated around the elevation axis and towards the easting axis based on an average heading angle of the mobile van (Kumar et al., 2015b). This rotation is carried out to assist the process of implementing interpolation and threshold approaches to the LiDAR points.
2.2 INTENSITY RASTER SURFACE
In the second step, the LiDAR points are interpolated into inten-sity raster surface as it ensures a more computationally efficient approach to road roughness detection. However, the LiDAR data can suffer from unusual intensity values which can lead to the generation of noisy raster surface. In order to generate smooth raster surface, the effect of this noise is minimised with a point thinning process (Crawford, 2009). Point thinning is used to gen-erate multi resolution terrain pyramids by reducing the number of data points required to represent a terrain model in each pyramid level. The point thinning operation is applied based on a window size filter method in which the data points are partitioned into equally sized window areas. In the first level terrain pyramid, the window size is twice the selected cell size of the raster surface, while the window size in the subsequent levels is increased by a power of two. In each window of the pyramid level, a data point nearest to the mean value is selected as representative of the ter-rain model in each pyramid level. Thus, multi resolution terter-rain pyramids are generated from the LiDAR intensity attribute where the original full resolution corresponds to the highest resolution terrain model, the first level corresponds to the second-highest resolution terrain model and the last level corresponds to the low-est resolution terrain model for each attribute.
Intensity raster surface is generated from the first level terrain pyramid using natural neighbourhood interpolation. The first level terrain pyramid is found to be useful for generating the smooth raster surface than other levels, as it minimises the noise effect without affecting much of the object details and accuracy. The cell size,cparameter required to generate the raster surface is selected based on an average spacing of LiDAR points. In the natural neighbourhood interpolation method, the thinned LiDAR points are partitioned into Voronoi polygons which are created with each polygon constituting a single point and every location within the polygon is closer to its constituted single point than to any other point. A raster surface with its selected cell size is laid over the Voronoi polygons. The value of each raster cell is then interpolated based on the proportion of overlapping areas between the raster cell and Voronoi polygons.
The intensity raster values are normalised with respect to their global minimum and maximum values, and then converted to an 8-bit data type. This allows for a two-way transformation be-tween the 8-bit values and their original LiDAR values for the road sections.
2.3 MORPHOLOGICAL OPERATIONS
Figure 1: Road roughness detection algorithm.
Figure 2: Multi-level Otsu threshold values determined for inten-sity surface.
2.4 MULTI-LEVEL OTSU THRESHOLDING
In fourth step of the algorithm, multi-level Otsu thresholding is applied to the intensity raster surface which provides an estima-tion of candidate roughness regions. The Otsu thresholding per-forms non-parametric and unsupervised thresholding based on gray-level histogram of the input image (Otsu, 1979). It divides the image into two classes, C1 and C2 and then determines a global optimal threshold value, t by maximising the between-class variance,σ2
b(t)as (Balarini and Nesmachnow, 2016),
σ2
b(t) =q1(t)q2(t)[µ1(t)−µ2(t)]2, (1)
whereq1(t),q2(t)are class probability functions andµ1(t),µ2(t) are mean values for classesC1andC2respectively.
Multi-level Otsu thresholding is applied to intensity surface by dividing it into three classes which led to the estimation of two optimal threshold values,t1andt2as shown in Figure 2. The in-tensity values of the laser returns received from the roughness re-gions are usually lower than from the normal road surface (Guan et al., 2015a). Based on this assumption, the intensity values be-low the be-lower threshold,t1are identified as candidate roughness regions and are retained. The intensity values in betweent1and t2belong to the road surface while those abovet2are found to be road marking regions, which are removed. The candidate rough-ness regions are clustered using connectivity analysis and each cluster is fitted with convex hull. The 3D LiDAR points which are contained within each cluster are then extracted, as shown in Figure 3.
Figure 3: 3D LiDAR points contained within convex hulls be-longing to candidate road roughness regions.
2.5 3D CLUSTER FILTERING
The clustered LiDAR points may be the outliers belonging to nor-mal road surface or nearby vehicles. In fifth step of the algorithm, these clusters are filtered based on their dispersion and elevation criteria. The spatial density of outliers is usually lower than of points belonging to roughness regions (Yu et al., 2014). The sity of each cluster is estimated and then the clusters whose den-sity is below the pre-defined threshold,tdare removed. In this
way, the outlier points belonging to normal road surface are fil-tered out. In order to remove the outliers belonging to nearby ve-hicles, the standard deviation of elevation values of each cluster is estimated and then the clusters with values higher than pre-defined threshold, tsd are removed. The values of these
pre-defined thresholds,tdandtsd are determined empirically. The
filtering of these clusters provides the estimation of 3D LiDAR points belonging to road roughness regions. The estimated Li-DAR points are then finally rotated back to their original position based on an average heading of the mobile mapping van. The next section presents the tests of developed road roughness detection algorithm on road sections.
3. EXPERIMENTATION
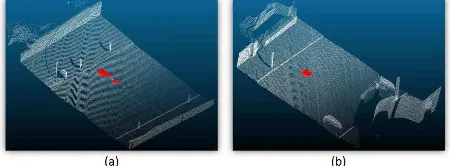
Figure 4: Digital image of (a) first and (b) second section of urban road with roughness regions indicated in red boxes.
sections consisted of roughness along their surfaces which oc-curred due to utility repairing. The processed data was collected using the experimental Platform (XP-1) MLS system which has been designed and developed at the Maynooth University, Ireland (Kumar et al., 2010, 2011).
The road roughness detection algorithm was applied to the se-lected road sections. The cell size,c= 0.06m was selected to in-terpolate the intensity surface from LiDAR points based on their average point spacing. The closing morphological operation was applied to the intensity raster surface using a rectangular struc-turing element of3×3size. This shape was selected due to the
general rectangular pattern of roughness regions present along the road surface in the tested sections. The use of multi-level Otsu thresholding approach provided the optimal threshold val-ues oft1 = 57,50andt2 = 50,101within 8-bit range for the two road sections. The threshold values oftdandtsdwere
se-lected empirically as25and0.2mrespectively for both the road sections. The extracted 3D road roughness regions in the first and second road sections are shown in Figure 5. In the next section,
Figure 5: 3D road roughness regions represented in red in the (a) first and (b) second section of urban road.
the experimental results are discussed.
4. RESULTS & DISCUSSION
The road roughness detection results were visually validated, which corresponded to linear and square shaped roughness patches as indicated in Figure 4. The algorithm was able to identify the roughness regions in both the road sections. In the first road sec-tion, the roughness was linearly spread along the cross-sectional profile. The algorithm was not able to detect the roughness along right side of the first section due to a lower point density of the LiDAR data along that side. This was due to the use of single laser scanner in the XP-1 MLS system which was driving along left side of the road section during the data acquisition process. It led to the acquisition of LiDAR data with a lower point den-sity along the right side of the road section compared with its left side. In the tested road sections, the average of the LiDAR point density samples collected over the left and right sides of the sections was880.66/m2 and142.18/m2 respectively. The
use of dense and uniform point cloud data along both sides of the road section will provide a complete estimation of roughness along the road surface. In the second road section, the roughness was in the form of square patch along its left side which the algo-rithm detected correctly. In this section, the identified candidate roughness regions consisted of some LiDAR points belonging to near-by vehicles along the right side. These points were filtered out based on standard deviation of elevation criteria. The use of interpolated raster surface led to more efficient detection of road roughness, which would not be possible with the direct use of 3D LiDAR point cloud with low and non-uniform point density.
The value of LiDAR intensity attribute primarily depends upon incidence angle of the laser pulse, the distance from the laser scanner and the illuminated surface. The normalisation of in-tensity attribute with respect to these factors will provide the re-flectance values from the targeted objects. The use of such nor-malised intensity values will again improve the process of road roughness detection. The point thinning process was effective in interpolating smooth intensity surfaces while the use of closing morphological operation provided to smooth dim roughness re-gions. The three-level Otsu thresholding approach was useful in dividing the image into dim, gray and bright classes which ap-proximately corresponded to roughness, road surface and road marking regions in the intensity raster surface. In the next sec-tion, the presented work is concluded.
5. CONCLUSION
In this paper, an automated approach for detecting road roughness is presented. The developed approach is based on utilising the LiDAR intensity and elevation attributes to detect roughness re-gions along the road surface. The LiDAR values are smoothly in-terpolated from the first level terrain pyramid using natural neigh-bourhood method and then closing morphological operation is applied to further smooth the dim roughness regions in the in-tensity raster surface. The use of multi-level Otsu thresholding provides to identify candidate road roughness regions which are then filtered based on spatial density and standard deviation of elevation criteria. The algorithm was successfully tested on two urban road sections. The developed tool can be used to provide rapid, cost-effective and comprehensive information to road au-thorities in order to schedule maintenance and repairing of road surfaces.
In future work, the algorithm will be tested on MLS data with dense point cloud along both sides of the road section and nor-malised values of intensity attribute. The use of such dataset will provide an improved estimation of road roughness. The al-gorithm will be further extended to detect the cracks, joints and other defects present along the road surface. More robust thresh-old approach will be developed in order to accurately estimate the candidate road roughness regions. The developed approach will also be tested on longer and distinct road sections in order to validate its efficiency and robustness.
ACKNOWLEDGEMENTS
References
Adhikari, R. S., Moselhi, O. and Bagchi, A., 2014. Image based retrieval of concrete crack properties for bridge inspection. Au-tomation in Construction39, pp. 180–194.
Bai, X., Zhou, F. and Xue, B., 2012. Image enhancement us-ing multi scale image features extracted by top-hat transform. Optics & Laser Technology44, pp. 328–336.
Balarini, J. P. and Nesmachnow, S., 2016. A C++ implementation of Otsu’s image segmentation method. Image Processing On Line6, pp. 155–164.
Barsi, A., Lovas, T. and Kertesz, I., 2006. The potential of low-end IMUS for mobile mapping systems. The International Archives of the Photogrammetry, Remote Sensing and Spatial Information Sciences, 4-6 July, Paris, France36(1), pp. 423– 426.
Bester, C. J., 2003. The effect of road roughness on safety. Transportation Research Board (TRB) Annual Meeting, 12-16th January, Washington, USp. 23.
Crawford, C., 2009. Minimising noise from Li-DAR for contouring and slope analysis. Avaiable: http://blogs.esri.com/esri/arcgis/2009/09/02.
Davies, R. B., Cenek, P. D. and Henderson, R. J., 2005. The effect of skid resistance and texture on crash risk.International Conference on Surface Friction - Roads and Runways, 1-4th May, Christchurch, Newzealand.p. 17.
De Farias, M. M. and De Souza, R. O., 2009. Correlations and analyses of longitudinal roughness indices. Road Materials and Pavement Design10(2), pp. 399–415.
Diaz, J. C. F., Judge, J., Slatton, K. C., Shrestha, R., Carter, W. E. and Bloomquist, D., 2010. Characterization of full surface roughness in agricultural soils using groundbased li-dar.International Geoscience and Remote Sensing Symposium (IGARSS), 25-30 July, Honolulu, USpp. 4442–4445.
Diaz-Vilarino, L., Gonzalez-Jorge, H., Bueno, M., Arias, P. and Puente, I., 2016. Automatic classification of urban pavements using mobile LiDAR data and roughness descriptors. Con-struction and Building Materials102, pp. 208–215.
ERSO, 2006. Roads.Available: http://ec.europa.eu.
Gavil´an, M., Balcones, D., Marcos, O., Llorca, D. F., Sotelo, M. A., Parra, I., Oca˜na, M., Aliseda, P., Yarza, P. and Am´ırola, A., 2011. Adaptive road crack detection system by pavement classification.Sensors11(10), pp. 9628–57.
Guan, H., Li, J., Yu, Y., Chapman, M. and Wang, C., 2015a. Au-tomated road information extraction from mobile laser scan-ning data. IEEE Transactions on Intelligent Transportation Systems16(1), pp. 194–205.
Guan, H., Li, J., Yu, Y., Chapman, M., Wang, H. and Wang, C., 2015b. Iterative tensor voting for pavement crack extraction using mobile laser scanning data.IEEE Transactions on Geo-science and Remote Sensing53(3), pp. 1527–1537.
Hollaus, M. and Hofle, B., 2010. Terrain roughness parame-ters from full-waveform airborne lidar data.The International Archives of the Photogrammetry, Remote Sensing and Spatial Information Sciences, 5-7 July, Vienna, AustriaXXXVIII(7B), pp. 287–292.
Ihs, A., 2004. The influence of road surface condition on traf-fic safety and ride comfort. 6th International Conference on Managing Pavements, 19-24th October, Brisbane, Australia.
Kertesz, I., Lovas, T. and Barsi, A., 2007. Meausrement of road roughness by low cost photogrammetric system. The International Archives of the Photogrammetry, Remote Sens-ing and Spatial Information Sciences, 29-31 May, Padua, Italy XXXVI(5/C55), pp. 4.
Kumar, P., 2012. Road features extraction using terrestrial mobile laser scanning system.Ph.D. Dissertation, National University of Ireland Maynoothp. 300.
Kumar, P., Lewis, P. and McElhinney, C. P., 2015a. Parametric analysis for automated extraction of road edges from mobile laser scanning data.ISPRS Annals of the Photogrammetry, Re-mote Sensing and Spatial Information Sciences, 28-30 Octo-ber, KualaLumpur, MalaysiaII-2/W2, pp. 215–221.
Kumar, P., Lewis, P., McElhinney, C. P. and Abdul-Rahman, A., 2015b. An algorithm for automated estimation of road rough-ness from mobile laser scanning data. The Photogrammetric Record30(149), pp. 30–45.
Kumar, P., Lewis, P., McElhinney, C. P., Boguslawski, P. and Mc-Carthy, T., 2016. Snake energy analysis and result validation for a mobile laser scanning data based automated road edge ex-traction algorithm.IEEE Journal of Selected Topics in Applied Earth Observations and Remote SensingPP(99), pp. 1–11.
Kumar, P., McCarthy, T. and McElhinney, C. P., 2010. Automated road extraction from terrestrial based mobile laser scanning system using the GVF snake model. European LiDAR Map-ping Forum, 30 November - 1 December, Hague, The Nether-landsp. 10.
Kumar, P., McElhinney, C. P. and McCarthy, T., 2011. Utiliz-ing terrestrial mobile laser scannUtiliz-ing data attributes for road edge extraction using the GVF snake model.7th International Symposium on Mobile Mapping Technology, Krakow, Poland pp. 1–6.
Kumar, P., McElhinney, C. P., Lewis, P. and McCarthy, T., 2013. An automated algorithm for extracting road edges from terres-trial mobile LiDAR data. ISPRS Journal of Photogrammetry and Remote Sensing85, pp. 44–55.
Kumar, P., McElhinney, C. P., Lewis, P. and McCarthy, T., 2014. Automated road markings extraction from mobile laser scan-ning data.International Journal of Applied Earth Observation and Geoinformation32, pp. 125–137.
Oliveira, H., Caeiro, J. J. and Correia, P. L., 2010. Improved road crack detection based on one-class Parzen density estimation and entropy reduction.IEEE 17th International Conference on Image Processing, 26-29th September, Hong Kong.pp. 2201– 2204.
Otsu, N., 1979. A threshold selection method from gray-level histograms. IEEE Transactions on Systems, Mans and Cyber-netics9(1), pp. 62–66.
Sayers, M. and Karamihas, S. M., 1998. The little book of profiling. Available: http://www.umtri.umich.edu/content/LittleBook98R.pdf p. 102.
Stavens, D. and Thrun, S., 2006. A self-supervised terrain rough-ness estimator for off-road autonomous driving. 22nd Con-ference on Uncertainty in Artificial Intelligence, 13-16 July, Virginia, USpp. 469–476.
Wen, W., 2008. Road roughness detection by analysing IMU data.M.Sc. Dissertation, Royal Institute of Technology, Stock-holm, Swedenp. 101.
Yen, K. S., Akin, K., Lofton, A., Ravani, B. and Lasky, T. A., 2010. Using mobile laser scanning to produce digital terrain models of pavement surfaces. Available: http://ahmct.ucdavis.edu/pdf/UCD-ARR-10-11-30-01.pdfp. 77.
Yu, Y., Li, J., Guan, H. and Wang, C., 2014. 3D crack skeleton extraction from mobile LiDAR point clouds.IEEE Geoscience and Remote Sensing Symposium, 13-18th July, Quebec City, Canada.pp. 914–917.
Zhang, A. M. and Russell, R. A., 2004. Surface roughness measurement for outdoor mobile robotic applications. Aus-tralasian Conference on Robotics and Automation, 6-8th De-cember, Canberra, Australiap. 6.
Zhang, K. and Frey, C., 2005. Road grade estimation for on-road vehicle emissions modeling using lidar data. Air & Waste Management Association Annual Meeting, 20-23rd June, Minnneapolis, USp. 22.