COMPARISON OF TWO FUSION BASED BUILDING CHANGE DETECTION
METHODS USING SATELLITE STEREO IMAGERY AND DSMS
J. Tian, P. Reinartz
German Aerospace Center (DLR), Remote Sensing Technology Institute, 82234 Wessling, Germany - (Jiaojiao.Tian, Peter.Reinartz)@dlr.de
Commission VII WGVII/6
KEY WORDS: Fusion, Change detection, Building monitoring, DSM
ABSTRACT:
Digital Surface Models (DSMs) can assist building change detection in a variety of approaches. Limited to the quality of DSMs from satellite stereo imagery, it is hard to reach precise change detection results using only DSMs. Therefore, DSMs should be used in combination with the spectral information from original stereo imagery. For that purpose, two fusion based methods, one using feature level fusion and the other using decision level fusion are proposed in our previous research. In this paper, these two methods are further evaluated and compared based on two different data sets. One test site features a typical urban environment which is captured by two pairs of very high resolution stereo imagery (IKONOS and WorldView-2). The other test site is located in an industrial area, the corresponding stereo imagery of the two dates are both from Cartosat-1. Quantitative and qualitative experiment results obtained from each dataset are analyzed in detail. Over all, the proposed feature fusion model give better results for the industrial area, while the decision fusion method works much better for the urban environment based on very high resolution imagery.
1. INTRODUCTION
Fast-paced urban and rural developments, as well as more frequent natural disasters (e.g., earthquakes, hurricanes, and tsunamis) have increased the demand for efficient urban monitoring and disaster assessment. Even though 2D data obtained from satellite images from different dates can already provide plenty of useful information, it is usually insufficient when dealing with changes in the vertical direction, especially building changes. Therefore, height information provided by Digital Surface Models (DSMs) is indispensable when analyzing these changes.
DSMs can assist 3D change detection in a variety of approaches. Limited to the quality of the DSMs generated from stereo imagery, it is hard to reach precise change detection results using only the DSMs. Therefore, DSMs should be used in combination with the spectral information from the original stereo images. As the DSMs are generated using stereo images, spectral information of the same time and area is always available. After orthorectification of these images using the generated DSM, the ortho-image and DSM are well co-registered and can be used together. Thus, the main challenge here is how to fuse the information from DSMs and ortho-images.
Many methods have been proposed to fuse two or more kinds of data. The main difference of these methods is how and when the DSM content is fused with the original images. Three kinds of data fusion techniques are summarized in Hall and Llinas (1997) and Pohl and van Genderen (1998), and show pixel/data level fusion, feature level fusion and decision level fusion approaches. For our purpose, the selected fusion method should be able to resolve the quality restriction of DSMs by using the additional information available in the corresponding spectral
images. Depending on the quality of the DSMs, the availability of multispectral channels and the requirements of the change detection task, proper 3D change detection methods have to be developed.
In our previous research (Tian et al., 2013a; Tian et al., 2013b), two fusion methods have been proposed, one is feature-fusion based, and the other is decision-fusion based. In this paper, after shortly introducing these two methods, they are tested and compared in two test sites. Both of the obtained change maps and change masks are evaluated by comparing to the manually extracted reference data.
2. METHODS
2.1 Method I: Feature fusion-based (Tian et al., 2013b)
The input data of this method consists of two pairs of stereo imagery obtained from two dates. Each stereo pair can generate one DSM. The DSM is generated based on Semi-Global Matching (SGM) method. The DSMs generation and 3D co-registration methods are described in detail in that paper.
DSMs generated from stereo images exhibit relatively low quality in boundary areas. Therefore, instead of directly fusing pixel based features from both image sources, this method extracts regions from the panchromatic images. As shown in Figue1, the workflow of proposed method consists of two stages. Firstly, segmentation of orthorectified Cartosat-1 images is performed to obtain initial regions. Then regions from two dates (Date1 and Date2) are combined to get an initial segmentation map. To correct the over-segmentation resulting from the region combination, a region merging strategy is proposed to reach a reasonable segmentation level. And then,
International Archives of the Photogrammetry, Remote Sensing and Spatial Information Sciences,
change features from DSMs and from images can be combined based on a weighted Change Vector Analysis (CVA).
Stereo Imagery Co-DSM1 Co-DSM2 Co- Image(date2) Co-Image
Figure 1. Flow chart of Method I (Tian et al., 2013b).
2.2 Method II: Decision fusion-based (Tian et al., 2013a)
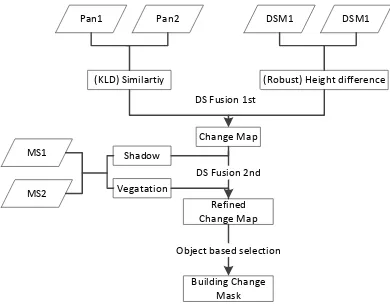
When the detection of building changes is of interest, both of the height changes from DSMs and gray value changes from original images can contain uncertain information. In our work (Tian et al., 2013a), the Dempster-Shafer (DS) fusion theory is adopted to combine change indicators that extracted from these two data source. The required input data is the same as Method I. Differing to Method I, this approach has also used the multispectral (MS) channels from original images to extract vegetation and shadow maps.
Figure 2 describes the workflow of this method. In that fusion model, two fusion steps are designed. In the first fusion step, the height changes and Kullback-Leibler divergence similarity measure between the original images are used as building change indicator. In the second fusion step, vegetation and shadow classifications are used as no-building change indicators for refining the change detection results. In the end, an object based building extraction method based on shape features is performed.
Pan1 Pan2 DSM1 DSM1
(KLD) Similartiy (Robust) Height difference
Change Map
Figure 2. Flow chart of Method II (Tian et al., 2013a).
2.3 Evaluation method
In order to evaluate the effectiveness of the proposed methods, the results obtained from two methods will be compared with reference data. The assessment of the change detection results is carried out at both pixel and object level.
1) Pixel-based evaluation
For the pixel-level evaluation, the results are displayed in terms of Receiver Operating Characteristics (ROC) curve analysis (Hand and Till, 2001). We use the area under the ROC curve to evaluate the quality of each change index and the generated result. The ROC curve shows the relationship of true positive against false positive. The area under the ROC curve is used to measure the ability of single or combined features and the difference map to detect the real building changes (Hand and Till, 2001).
In the pixel-based change mask evaluation, in order to compute the agreement of the change detection mask with the reference change mask, the following measures are involved.
a) True Positive (TP): the number of changed pixels correctly detected as changed.
b) True Negative (TN): the number of unchanged pixels correctly detected as unchanged.
c) False Positive (FP): the number of unchanged pixels incorrectly detected as changed.
d) False Negative (FN): the number of changed pixels incorrectly detected as unchanged.
e) Overall Accuracy:��=��+��� × 100%
f) Kappa Index of Agreement (Congalton, 1991): ���=��1−��(�)−�� (�) (�)
Where ��(�) is the relative observed agreement between the extracted results and reference data, it is calculated in the same way as OA; while
��(�) =(��+��)∗(��+��) + (��+��)∗(��+��)
� ∗ �
represents the hypothetical probability of the agreement between the extracted results and reference data;
N is the total number of pixels.
2) Object-based evaluation
Concerning building change detection accuracy, correctly detected building numbers are in some cases more important. As a higher level of the analysis, the changed buildings are treated as single objects without consideration of their size. Only the effectiveness of the detection of distinct changed areas (buildings) in the change map is considered in the assessment. Therefore, four parameters are measured to evaluate the object-based change detection result:
a) True detected number (TDN): The number of changed objects that are correctly detected as changed
b) True detected rate (TD): The number of true detected objects as a percentage TD = TDN / NR × 100
c) False detected number (FDN): The number of unchanged objects that are incorrectly detected as changed
d) False detected rate (FD): The number of falsely detected objects as a percentage FD = FDN / ND × 100
where NR and ND are the total number of changed objects of the reference data and within the change map, respectively.
International Archives of the Photogrammetry, Remote Sensing and Spatial Information Sciences,
(a) (b) (c)
(d) (e)
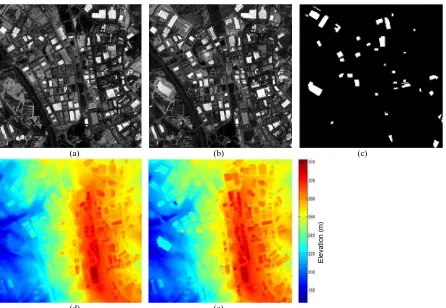
Figure 3. Dataset for Munich test area, including orthorectified panchromatic image from date 1 (a) and date 2 (b), change reference map (c), DSM from date 1 (d) and date 2 (e).
(a) (b) (c)
(d) (e)
Figure 4. Dataset for Istanbul test area, including orthorectified panchromatic image from date 1 (a) and date 2 (b), DSM from date 1 (c) and date 2 (d).
Rebuilt area Positive Negative
E
lev
at
ion (
m
)
E
lev
at
ion (
m
)
International Archives of the Photogrammetry, Remote Sensing and Spatial Information Sciences,
3. EXPERIMENT
3.1 Datasets
Two datasets are used in this study. The first dataset is obtained from the center of Munich (Germany). It has an area of 1.69 km2 and contains the city center of Munich. This dataset features a typical urban environment. The first pair of the stereo imagery was captured by IKONOS on July 15, 2005 (shown in Figure 3a), while the other pair features WorldView-2 data and were acquired on July 12, 2010 (shown in Figure 3b). Since the datasets have different resolutions the WorldView-2 images are down-sampled to 1 m resolution, to be equal to the IKONOS data. After that, all images have the size of (1300 × 1300 pixels). The change reference data and the generated DSMs are displayed in Figure 3c, 3d and 3e respectively.
The second dataset is located in an industrial area, with large buildings, in the eastern part of Istanbul. Two Cartosat-1 images were acquired with a time difference of three years, the first was acquired on August 14, 2008 and the second was acquired on May 08, 2011. In this industrial area, concerning change detection, the focus lies on newly constructed buildings. Figure 4 shows the original panchromatic images (Figure 4a and 4b), the change reference data (Figure 4c) and the generated DSMs (Figure 4d and 4e). It has an image size (500 × 500 pixels) and totally covers an area of 6.25 km2, and is characterized as an industrial area with low-rise buildings and partly high density.
3.2 Results
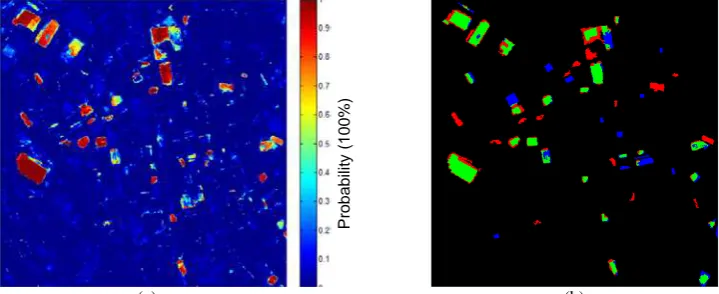
The building change detection results from the two datasets are depicted in Figure 5 - 8. Figure 5 shows the building map and change mask obtained for the Munich test area based on Method I. Pixel values in the change map represent the probability of building change. Figure 6 shows the results from Method II. As can be seen, the change map from Method II (Figure. 6a) shows much clearer results than from Method I (Figure 5a).
In order to present the accuracy of the detected mask, the detected change mask is overlaid with the change reference map. It is represented in four colors, which are explained in Table 1. The true detected pixels are shown with green color; False alarms (no-change pixels, falsely detected as change) are displayed with red color; the blue pixels represent the missed alarms (changed pixels falsely detected as no-change).
Reference data
Change Mask
Change No-Change
Change True detected False alarm
No-Change Missed alarm
Table 1. The four colors in the overlaid change mask.
In Figure 5a, one big region of false alarm in the center of the test area is obvious. Since it exhibits a relatively large size and regular shape, the false alarm is also shown in the final change mask (Figure 5b). But these five large changed buildings are correctly detected, as displayed in Figure 5b with green color.
Figure 6a show the DS fusion result including all the change indices and no-change indices, the values in the images represent the probability of each pixel to belong to the building change. The changed buildings are mostly highlighted in red color. Figure 6b shows the final change masks. It exhibits fewer false alarms in comparison to Figure 5b.
Figure 7 and 8 depict the change detection result from the Istanbul test site. The advantage of the region based method is more obvious than in the urban area. The obtained results from Method I shown in Figure 7a are less noisy and the detected buildings exhibit much sharper boundaries. Figure 7b shows the change map, which is automatically stretched to a change probability map. Figure 8a is the obtained fusion result based on the two building-change indicators. Due to the lack of multispectral channels, the second fusion step of Method II cannot be applied. After thresholding and refining it with shape features, the change mask is displayed in Figure 8b. Although there remain more false alarms than with Method I, most of the changed buildings are still correctly highlighted with green colors.
3.3 Evaluation and discussion
3.3.1 Change maps evaluation
The goal of this experiment was to evaluate and compare the effectiveness of the proposed frameworks on different sorts of stereo imagery. The change detection results from the two methods are compared to the reference data in the evaluation procedure.
Table 2 comprises the quality comparison of the change maps generated from the two methods for the two datasets. The area under the ROC curve (AUC) has been adopted to compare the change maps displayed in Figure 5a, 6a, 7a and 8a. A higher AUC value indicates a better quality of change map, meaning that it is more capable of providing a reliable change mask. The result from the Istanbul test area is much easier to understand. By visual comparison, the change map from Method I, shown in Figure 7a, has better highlighted the real changes compared to the result from Method II (shown in Figure 8a), and the boundaries are much sharper. Thus Method I obtains larger AUC than Method II. In the Munich test area, Figure 6a from Method II displays a much clearer change map than Figure 5a. But the AUC from Method I is still better than from Method II. This can be explained by reconstruction: in the selected test area, several change buildings are rebuilt, thus the height changes of these buildings are limited, which will influence the DS fusion procedure. Although the change map from Method I obtain a higher AUC, both of the real changes and false alarms have been highlighted (shown in Figure 5a). It is difficult to select a proper threshold value to generate an accurate change mask.
Method AUC
Munich Istanbul
I 0.9270 0.9667
II 0.9025 0.9432
Table 2. Area under ROC curve comparison
International Archives of the Photogrammetry, Remote Sensing and Spatial Information Sciences,
(a) (b)
Figure 5. Change map (a) and change mask (b) generated in the Munich test area with Method I.
(a) (b)
Figure 6. Change map (a) and change mask (b) generated in the Munich test area with Method II.
(a) (b)
Figure 7. Change map (a) and change mask (b) generated in the Istanbul test area with Method I.
(a) (b)
Figure 8. Change map (a) and change mask (b) generated in the Istanbul test area with Method II.
P
robabi
lit
y
(
10
0%
)
P
robabi
lit
y
(
10
0%
)
P
robabi
lit
y
(
10
0%
)
P
robabi
lit
y
(
10
0%
)
International Archives of the Photogrammetry, Remote Sensing and Spatial Information Sciences,
3.3.2 Change masks evaluation
Table 3 and Table 4 illustrate the change mask evaluation results. According to the pixel-based change mask evaluation result, in the Munich test area Method II obtains a better change mask. The KIA obtained from Method II is also much higher than for Method I. The object-based evaluation results listed in Table 4 again show the weakness of Method I in the Munich test area, especially regarding the false detected rate..
The Istanbul test site is located in an industrial area. Therefore it is much easier to achieve a proper segmentation level than in the urban area. Thus, Method I achieves better OA and KIA than Method II; and few false alarm objects remain in the obtained change mask. According to the object evaluation result (Table 4), Method I has also correctly detected more changed buildings and the false alarms drop significantly in comparison to Method II.
Method Munich Istanbul
OA KIA OA KIA
I 0.9917 0.5044 0.9823 0.7578 II 0.9957 0.6899 0.9720 0.6365
Table 3. Pixel-based change masks evaluation
Method True Detected (object) False Detected (object) Number Rete[%] Number Rate [%] I (Munich) 7 70.00 10 62.50 II (Munich) 8 80.00 3 30.00 I (Istanbul) 29 74.36 5 16.67 II (Istanbul) 28 71.79 14 35.90
Table 4. Region-based change masks evaluation.
4. CONCLUSION
In this paper, two DSM-assisted change detection approaches are summarized and compared. Two representative test sites are chosen for the comparison. One test site features a typical urban environment. Two pairs of stereo imagery from two dates are captured with different sensor, one is from IKONOS and the other is from WorldView-2. The other test site is located in an industrial area. The corresponding stereo imagery of two dates have been both acquired by Cartosat-1. Both methods are implied to these two datasets. The obtained change maps and change masks are compared visually and numerally.
It has been shown that DSMs generated from satellite stereo imagery are suitable for automatic and semi-automatic building change detection. These two methods are advanced for different situations. It has been proven that these two methods have their advantages in different situations. Over all, the region-based feature fusion method can normally obtain a clearer change mask with high accuracy if proper segmentation can be provided. But the decision fusion method is more robust and advanced in more variable areas, like dense urban regions captured by very high resolution imagery.
ACKNOWLEDGEMENT
We would like to thank EUSI and Euromap for providing WorldView-2, IKONOS and Cartosat-1 data for scientific purposes.
REFERENCES
References from Journals:
Congalton, R. G., 1991. A review of assessing the accuracy of classifications of remotely sensed data. Remote sensing of Environment, 37(1), pp. 35-46.
Hall, D., and Llinas, J., 1997. An introduction to multisensor data fusion. Proceedings of the IEEE, 85(1), pp. 6-23.
Hand, D.J., and Till, R.J. 2001. A simple generalization of the area under the ROC curve to multiple class classification problems. Machine Learning, 45(2), pp. 171–186.
Pohl, C., and van Genderen, J. L., 1998. Multisensor image fusion in remote sensing: concepts, methods and applications. International Journal of Remote Sensing, 19(5), pp. 823-854.
Tian, J., Cui, S., and Reinartz, P., 2013a. Building Change Detection Based on Satellite Stereo Imagery and Digital Surface Models. IEEE Transactions on Geoscience and Remote Sensing, in press, pp. 1-12.
Tian, J., Reinartz, P., d’Angelo P., and Ehlers, M., 2013b. Region-based automatic building and forest change detection on Cartosat-1 stereo imagery. ISPRS Journal of Photogrammetry and Remote Sensing, 79, pp. 226-239.
International Archives of the Photogrammetry, Remote Sensing and Spatial Information Sciences,