COMPARISON OF ENERGY BALANCE ON GANGOTRI AND CHHOTA SHIGRI
GLACIERS
Gunjan Rastogi a, *
*
and Ajai a a
Space Applications Centre, ISRO, Ahmedabad, India [email protected]
KEY WORDS: Energy balance; net radiation, sensible heat flux; latent heat flux, Gangotri Glacier; Chhota Shigri Glacier
ABSTRACT:
Surface energy balance of a glacier governs the physical processes taking place at the surface-atmosphere interface and connects ice ablation/accumulation to climate variability. To understand the response of Himalayan glaciers to climatic variability, a study was taken to formulate energy balance equation on two of the Indian Himalayan glaciers, one each from Indus and Ganga basins, which have different climatic and physiographic conditions. Study was carried out over Gangotri glacier (Ganga basin) and Chhota Shigri(CS) glacier from Chandra sub-basin (Indus basin). Gangotri glacier is one of the largest glaciers in the central Himalaya located in Uttarkashi District, Uttarakhand, India. Chhota Shigri glacier of Chandra sub-basin lies in Lahaul and Spiti valley of Himachal Pradesh. Energy balance components have been computed using inputs derived from satellite data, AWS (Automatic Weather Station) data and field measurements. Different components of energy balance computed are net radiation (includes net shortwave and net longwave radiation), sensible heat flux and latent heat flux. In this study comparison has been made for each of the above energy balance components as well as total energy for the above glaciers for the months of November and December, 2011. It is observed that net radiation in Gangotri glacier is higher by approximately 43% in comparison to Chhota Shigri glacier; Sensible heat flux is lesser by 77%; Latent heat flux is higher by 66% in the month of November 2011. Comparison in the month of December shows that net radiation in Gangotri glacier is higher by approximately 22% from Chhota Shigri glacier; Sensible heat flux is lesser by 90%; Latent heat flux is higher by 3%.Total energy received at the glacier surface and contributes for melting is estimated to be around 32% higher in Gangotri than Chhota Shigri glacier in November, 2011 and 1.25% higher in December, 2011. The overall results contribute towards higher melting rate in November and December, 2011 in Gangotri than Chhota Shigri glacier.
* Corresponding author. This is useful to know for communication with the appropriate person in cases with more than one author.
1. INTRODUCTION
Glaciers and snow cover play a major role in the dynamics of the Earth with respect to both climate and hydrology. Earth’s cryosphere has been changing rapidly, as characterized by worldwide glaciers and sea ice loss, especially during the past century. From climatological perception, snow and ice interact with the atmosphere spatially as well as temporally. These interactions involve intricate and sensitive feedback mechanisms. From a hydrological perspective, the behavior of glaciers is a sign of fluctuations in the climate system and thereby making them important indicators of climate change. Glaciers are considered to be the most important source of fresh water contributing significantly to stream flow. Understanding of snow and ice surface melt rates is important for the proper estimation and management of water resources [Hamlet and Lettenmaier, 1999; Marsh 1999], including the prediction of seasonal or short-term discharge, for studies of glacier hydrology and dynamics [Fountain and Walder, 1998] and of glacier mass balance [Arnold et. al., 1996; Richards et. al., 1996]. The issues related to water supply, hydroelectric facilities give rise to simulate and predict melt-derived stream flow. In addition to it, glacier/ snow melt runoff estimates are needed for forecasting seasonal water yields, river regulation and storage works, planning flood control programs, etc [Arnold et. al., 1996]. In this way glacier/snow runoff has received extensive examination in terms of both measurements and modeling. In the complex relationship between glaciers
and climate, one of the key processes is melt of snow and ice at the glacier surface. The accuracy of glacier-derived runoff modeling is highly dependent on the formulation of interaction between atmosphere and glacier/snow surface. Melt models relate the ablation to meteorological conditions, varying greatly in complexity and scope. Numerical glacier models quantify the sensitivity of glaciers to climate change and provide tools for evaluating the close relation of ecosystems and water resources in glacierized regions of the world [Hock 2005]. Glacier surface melt rate can be calculated by two different approaches: i) empirical models based on temperature index/ temperature degree day and ii) energy-balance models. Both, process-based models (derived from a surface energy balance) and empirical models, which correlate melt with temperature and to some extent the radiation, have been developed for glacierized regions. Empirical models/approach are normally area specific and difficult to extend to other regions as they are developed under specific conditions (geomorphic settings and physical environment). Empirical models based on air temperature was first used by Finsterwalder et. al., in 1887 and since then refined for estimating glacier melt rate [Jones 1997, Hock 2003]. These models relate ice melt with temperature but sometimes additional input variables such as incoming shortwave radiations are also incorporated through parameterization based on time and locations. Energy Balance approach are generic in nature offering better accuracy as it involves computations based on basic principles of Physics.
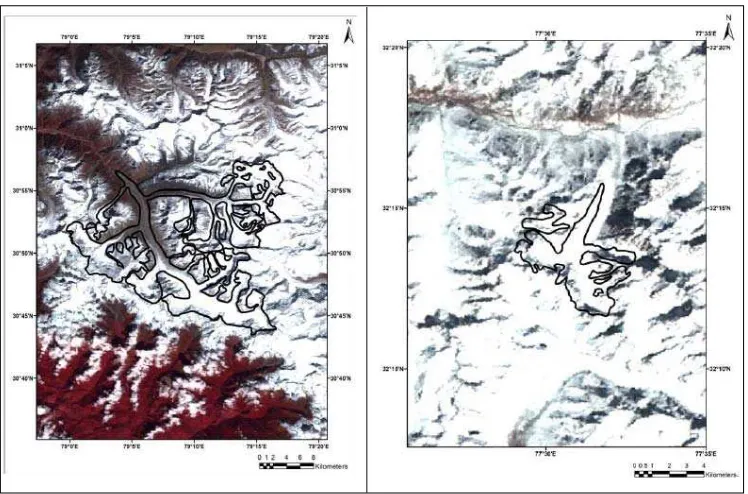
Figure -1(a) False Color Composite (Green, Red and NIR bands) of Resourcesat 1-AWiFS image showing location of Gangotri glacier lying in Ganga basin of Himalayan region and (b) depicts False Color Composite (Green, Red and NIR bands) of Resourcesat 1-AWiFS image showing location of Chhota Shigri glacier lying in Chandra basin of Himalayan region.
Establishing the physical relationship between glacier and climate requires the study of its surface energy balance [Favier et. al., 2004]. Surface energy balance is a vital element responsible for melting or sublimation processes of the glacier and snow. Small changes in the surface energy balance can lead to dramatic changes in the snow and ice cover. [Luers and Bareiss, 2010]. Energy Balance approach is based on the computation of the relevant energy fluxes and melt rate is calculated as the sum of the individual fluxes [Pellicciotti et.al., 2005]. The energy balance incorporates radiative fluxes, turbulent fluxes and the energy flux in the subsurface. This approach requires information on radiation energy, sensible and latent heat flux. These models more properly describe the physical processes at the glacier surface and provides reliable estimate of ablation and melt rates. In the recent years there has been increasing interest in spatially distributed estimates of glacier ablation and mass balance. There has been a large number of studies on energy balance computation on glaciers in different parts of the world, e.g. in the Sierra Nevada [Marks and Dozier, 1992], in Antarctica [Bintanja et al., 1997], in the Alps [Oerlemans and Klok, 2002; Klok and Oerlemans, 2002]. Studies have been done to compute glacier ablation in outer tropics using energy balance approach [Wagnon et al. (1999a, 1999b, 2001, 2003)]. Favier et. al., 2004 computed the annual cycle of the local surface energy balance on the ablation zone of Antizana Glacier 15, Ecuadorian Andes (inner tropics). Moolg and Hardy et. al., 2004 estimated the energy balance of a horizontal glacier surface on Kilimanjaro, tropical East Africa, for the periods March to September 2000 and March 2001 to February 2002 to study the impact of climate variations. Sicart et. al., 2005 examined the surface energy fluxes of the Bolivian Zongo Glacier (South American Andes) for identifying the atmospheric variables that control melting. A distributed surface energy-balance model was developed by Hock et. al., 2005 for complex topography of Storglaciaren, a valley glacier in Sweden. Energy and mass balance of Zhadang
glacier surface situated in central Tibetan Plateau has been estimated by Zhang et. al., 2013. Though energy balance studies have been carried out in Antarctica, Andes, Alps, inner and outer tropical region, however it has not been used for estimating glacier ablation, mass balance and melt run off in the valley glaciers of the Himalayas. The difficulties in taking in-situ measurements, required for formulation of energy balance equation in the highly undulating and difficult terrains might have been the main reason for lack of such studies in the Himalaya. The Himalayas have the highest concentration of glaciers outside the polar region and thus holds one of the most important natural resources of water in frozen form. It is important from the point of view of water and energy security of India and many other countries in the region.
To understand the response of Himalayan glaciers to climatic variability, a study was taken to compare energy balance on two of the Himalayan glaciers, one each from Indus and Ganga basins, which have different climatic and physiographic conditions.
2. STUDY SITE
The first glacier chosen for this study is Gangotri glacier. Gangotri glacier is one of the largest glaciers in the central Himalaya. It is located in Uttarkashi District, Uttarakhand, India. Gangotri glacier originating from Chaukhamba peaks (7138 m asl) and is about 27 km long with a glacierised area of about 143.58 km2. This is a valley type glacier in Ganga basin and the source of a major river system Ganga in northern India . This glacier is bounded between longitude 78̊ 59ˈ30̎ and 79̊ 17ˈ45̎ E and latitude 30̊ 43ˈ00̎ and 30̊ 57ˈ15̎ N. The snout is around 18 km from Gangotri Township. This glacier is having orientation in the north-west direction and is about 2 to 3 km wide. Most of the people depend on these rivers for their water and food supply. Indian population is dependent on it for irrigation and drinking water purposes.
Figure-2 Variation of heat fluxes on Gangotri and CS glacier during November, 2011(a) Daily variation of net radiations; (b) Daily variation of sensible heat flux ; (c) Daily variation of latent heat flux ; (d) Daily variation of total energy.
Because of these reasons it has gained lot of attention. Global warming and impact of climate change has added more concern to the Gangotri glacier melt runoff. Figure -1(a) depicts Resourcesat 1-AWiFS image showing location of Gangotri glacier lying in Ganga basin of Himalayan region.
The second glacier chosen for surface energy balance comparison is Chhota Shigri glacier. The Chhota Shigri glacier of Chandra River basin on the northern poles of the Pir Panjal range in the Lahaul and Spiti valley of Himachal Pradesh , is located at a distance of about 36km SE of Rohtang Pass, in the western Himalaya and bounded by latitudes 32.19-32.280
N and longitudes 77.49-77.550E. Its reported maximum elevation is 6263 m a.s.l., snout position is nearly at 4050 m a.s.l., and length of glacier is ~ 9 km and width of about 1.5 km in its widest portion. It is included in the upper basin of the Chandra River, contributing to Chenab River, one of the tributaries of the Indus river basin. This valley-type glacier is oriented roughly north-south in its ablation area, but variety of orientations in the accumulation area. This glacier is well developed and easily accessible glaciers of the Chandra river basin. As this glacier falls in the monsoon-arid transition zone that is why it is considered to be a sensitive indicator of northern climate. It lies in high pressure belt that is controlled by the intense heat of summer and severe cold in winter season. It is covered by debris because of weathering effects. The climate of this zone is mainly characterized by extreme winters from October to April. Figure-1(b) depicts Resourcesat 1-AWiFS image showing location of Chhota Shigri glacier lying in Chandra basin of Himalayan region.
3. FORMULATION OF ENERGY BALANCE FOR THE GLACIERS
To understand the causes of ablation by melting and sublimation, we need to examine the ways in which the glacier
surface gains and losses heat and be able to measure or calculate the gains and losses under different weather conditions. The surface energy balance is an essential element responsible for melting or sublimation process of the glacier and snow. Small changes in the surface energy balance can lead to dramatic changes in the snow and ice cover. [Luers and Bareiss, 2010].
The energy balance of the glacier surface is described by the sum of the radiative (incoming and reflected solar radiation, incoming and outgoing long wave radiation) components and turbulent heat fluxes. Assuming no horizontal transfers of heat on the ground, the net energy flux into the surface can be expressed as:
Q = R + H + LE + G +P (1a) Where Q is the energy available for melting of the snowpack; R is the net radiations; H is the turbulent sensible heat; LE is the turbulent latent heat of evaporation, condensation or sublimation, G is the conductive energy flux or subsurface energy flux in the snow/ice and P is the heat supplied by precipitation. In diurnal estimation of Q, conductive heat flux G in the snow/ice can be neglected as the glacier is isothermal. Since precipitation is always snow in the vicinity of the equilibrium line and since snowfall intensities are usually weak, P remains insignificant and negligible as compared to the other terms. The importance of each component varies temporally and spatially. Details of computation of each of the above energy fluxes are given in Rastogi et. al., 2013.
4. DATA USED
The input data sources used to compute energy balance
components in the present study are described as under:
Figure-3 Variation of heat fluxes on Gangotri and CS glacier during December, 2011(a) Daily variation of net radiations; (b) Daily variation of sensible heat flux ; (c) Daily variation of latent heat flux ; (d) Daily variation of total energy.
4.1 Satellite data
Surface reflectance and land surface temperature products (at 500m and 1km resolution respectively) of MODIS, onboard TERRA have been used in this study. MODIS has 36 spectral bands with spatial resolutions as: 250m (band1 – 2), 500m (band3 – 7), 1000m (band8 – 36) and quantization is 12 bits. 4.2 Meteorological data
Meteorological parameters such as wind speed, air temperature and relative humidity were obtained through a manned observatory of Snow and Avalanche Study Establishment (SASE) located at Bhojbasa in Gangotri sub-basin. Meteorological parameters over the Chhota Shigri glacier have been taken from an AWS (Automatic Weather Station), installed there at 3851.46m above sea level.
4.3 Field data
The surface roughness parameter used to calculate turbulent heat fluxes is obtained through doing field measurements using surface profilometer. The surface roughness parameter is estimated by microtopographic method.
5. RESULTS AND DISCUSSION
For comparison of Energy Balance on Gangotri and Chhota Shigri Glaciers different energy components (Net radiations, Sensible heat flux and Latent heat flux) have been computed on daily basis for November and December, 2011. Total energy available for melting of the glaciers has also been computed by taking the algebric sum of above mentioned energy fluxes. Different energy fluxes for two glaciers are shown in figures 2 and 3.
5.1 Net Radiations (NR)
The net radiation is the balance of the incident and reflected short-wave radiation and the incident and emitted long-wave radiation. As shown in figure-2(a) the monthly average value of net radiations during November, 2011 on Gangotri is 87.26 W/m2 while on Chhota Shigri is 50.04 W/m2. This variation is because incoming shortwave radiation is higher on Gangotri than Chhota Shigri and outgoing longwave radiation is higher on Chhota Shigri than Gangotri. Figure-3(a) depicts the similar trend in December, 2011. Monthly average value of net radiations during December, 2011 on Gangotri is 73.25 W/m2 while on Chhota Shigri is 57.31 W/m2
.
5.2 Sensible Heat Flux (SH)
This is the heat exchange that takes place because of temperature gradient between atmospheric boundary layer and glacier surface. As shown in figure-2(b) the monthly average value of Sensible heat flux during November, 2011 on Gangotri is 3.28 W/m2 while on Chhota Shigri is 14.41 W/m2. Sensible heat flux in Chhota Shigri is higher than Gangotri glacier because the wind speed and ambient temperature values are higher in Chhota Shigri than Gangotri glacier. Figure-3(b) depicts the similar trend in December, 2011. Monthly average value of Sensible heat flux during December, 2011 on Gangotri is 1.45 W/m2 while on Chhota Shigri is 17.78 W/m2
.
5.3 Latent Heat Flux (LH)
This is the heat exchange that takes place because of moisture gradient between atmospheric boundary layer and glacier surface. As shown in figure-2(c) the monthly average value of Latent heat flux during November, 2011 on Gangotri is -1.85
W/m2 while on Chhota Shigri is -5.48 W/m2. Here negative sign of heat flux represents heat sink. Negative values of latent heat flux also indicate that snow/ice surface loses mass by sublimation and also infers that the stratification of the lower atmosphere is moderately stable. Latent heat flux in Chhota Shigri is lesser than Gangotri glacier because the atmosphere in Chhota Shigri is dry than Gangotri glacier. Figure-3(c) depicts the similar trend in December, 2011. Monthly average value of Latent heat flux during December, 2011 on Gangotri is -1.34 W/m2 while on Chhota Shigri is -1.38 W/m2.
5.4 Total Energy (TE)
Total heat flux available for melting of the glaciers has also been computed by taking the algebric sum of above mentioned energy fluxes. As shown in figure-2(d) the monthly average value of total heat flux during November, 2011 on Gangotri is 85.53 W/m2 while on Chhota Shigri is 57.64 W/m2. Figure-3(d) depicts the similar trend in December, 2011. Monthly average value of Total heat flux during December, 2011 on Gangotri is 74.30 W/m2 while on Chhota Shigri is 73.35 W/m2. Total heat flux on Gangotri glacier is higher than Chhota Shigri because net radiation contribution and latent heat contribution is higher on Gangotri. Thus the melting of ice is higher for Gangotri as compared to Chhota Shigri glacier during the above two months.
6. CONCLUSION
In this study comparison has been made for each of the energy balance fluxes as well as total energy for Gangotri and Chhota Shigri glaciers for the months of November and December, 2011. It is observed that net radiation in Gangotri glacier is higher by approximately 43% in comparison to Chhota Shigri glacier; Sensible heat flux is lesser by 77%; Latent heat flux is higher by 66% in the month of November 2011. Comparison in the month of December shows that net radiation in Gangotri glacier is higher by approximately 22% from Chhota Shigri glacier; Sensible heat flux is lesser by 90%; Latent heat flux is higher by 3%.Total energy received at the glacier surface that contributes to melting is estimated to be around 32% higher in Gangotri than Chhota Shigri glacier in November, 2011 and 1.25% higher in December, 2011. This clearly indicates that the melting of ice in November and December, 2011 is higher in Gangotri than Chhota Shigri glacier.
ACKNOWLEDGEMENTS
We are thankful to Shri. A.S. Kiran Kumar, Director, SAC for his interest in this study. We are also thankful to Dr. P.K. Pal, Deputy Director, EPSA; Dr. Prakash Chauhan, GH, PMD/ BPSG/EPSA and Dr. I. M. Bahuguna, Scientist ‘G’ for discussions and support. We owe our sincere thanks to Director, SASE for providing Automatic Weather Station data for our study.
REFERENCES
Arnold, N.S., I.C. Willis, M.J. Sharp, K.S. Richards and W.J. Lawson. (1996). A distributed surface energy-balance model for a small valley glacier. I. Development and
testing for Haut Glacier d’Arolla, Valais, Switzerland. J. Glaciol., 42(140), 77–89.
Bintanja, R., S. Jonsson, and W. Knap (1997). The annual cycle of the surface energy balance of Antartic blue ice. J. Geophys. Res., 102(D2), 1867–1881.
Favier, V., P. Wagnon, J. P. Chazarin, L. Maisincho, and A. Coudrain. (2004). One-year measurements of surface heat budget on the ablation zone of Antizana glacier 15, Ecuadorian Andes. J. Geophys. Res., 109, D18105, doi:10.1029/2003JD004359.
Finsterwalder, S., Schunk, H., 1887. Der Suldenferner. Zeitschrift des Deutschen und Oesterreichischen Alpenvereins 18, 72–89.
Fountain, A.G. and J.S. Walder. (1998). Water flow through temperate glaciers. Rev. Geophys., 36(3), 299–328. Hamlet, A.F. and D.P. Lettenmaier. (1999). Effects of climate
change on hydrology and water resources in the Columbia River basin. J. Am. Water Res. Assoc., 35(6), 1597–1623.
Hock, R. (2003). Temperature index melt modelling in mountain areas. Journal of Hydrology, 282, 104-115. Hock, R. (2005). Glacier melt: a review of processes and their
modelling. Progress in Physical Geography, 29(3), 362-391.
Hock, R and Holmgren, B. (2005). A distributed surface energy balance model for complex topography and its application to Storglaciaren. Journal of Glaciology, 51, 25-36.
Jones, J.A.A. (1997). Global Hydrology. Harlow: Pearson. Klok, E. J., and J. Oerlemans (2002), Model study of the
spatial distribution of the energy and mass balance of Morteratschgletscher, Switzerland, J. Glaciol., 48(163), 505– 518.
Luers, J. and Bareiss, J. (2010). The effect of misleading surface temperature estimations on the sensible heat fluxes at a high Arctic site. Atmos. Chem. Phys. 10, 157-1.
Marks, D. and Dozier, J. (1992). Climate and energy exchange at the snow surface in the Alpine Region of the Sierra Nevada: 2. Snow cover energy balance. Water.
Resour. Res., 28,3043-3054.
Marsh, P. (1999). Snowcover formation and melt: recent advances and future prospects. Hydrol. Process., 13, 2117–2134.
Moolg, T. and Hardy, D. R.: Ablation and associated energy balance of a horizontal glacier surface on Kilimanjaro, J. Geophys. Res.-Atmos., 109, 16104– 16116, doi:10.1029/2003JD004338, 2004. 98. Oerlemans, J., and E. J. Klok (2002), Energy balance of a
glacier surface: Analysis of AWS data from the Morteratschglatscher, Switzerland, Arct. Antarct. Alp. Res., 34(123), 115–123.
Pellicciotti, F., Brock, B., Strasser, U., Burlando, P., Funk, M. and Corripio, J. (2005). An enhanced temperature-index glacier melt model including the shortwave radiation balance: Development and testing for Haut Glacier d’Arolla, Switzerland. Journal of Glaciology, 51, 573-587.
Richards, K.S. and 9 others. (1996). An integrated approach to modelling hydrology and water quality in glacierized catchments. Hydrol. Process, 10, 479–508.
Rastogi, G. and Ajai. (2013). Energy balance modeling for ablation estimation of Gangotri glacier. Journal of Geomatics, 7, 178-185.
Sicart, J. E., Wagnon, P., and Ribstein, P.: Atmospheric controls of the heat balance of Zongo Glacier (160S, Bolivia), J. Geophys. Res.-Atmos., 110, 12106– 12122, doi:10.1029/2004JD005732, 2005. 98. Wagon, P., Ribstein, P., R.E, Francou, B. and Pouyaud, B.
(1999a). Annual cycle of energy balance of Zongo Glacier, Cordillera Real, Bolivia. Journal of Geophysical Research, 104, 3907-3923.
Wagnon, P., P. Ribstein, G. Kaser, and P. Berton (1999b), Energy balance and runoff seasonality of a Bolivian glacier, Global Planet. Change, 22, 49– 58.
Wagnon, P., P. Ribstein, B. Francou, and J. E. Sicart. (2001). Anomalous heat and mass budget of Glaciar Zongo, Bolivia, during the 1997/98 El Nin˜o year, J. Glaciol., 47, 21–28.
Wagnon, P., J. E. Sicart, E. Berthier, and J. P. Chazarin (2003), Wintertime high-altitude surface energy balance of a Bolivian glacier, Illimani, 6340 m above sea level, J. Geophys. Res., 108(D6), 4177, doi:10.1029/2002JD002088.
Zhang, G. and 9 others (2013). Energy and mass balance of Zhadang glacier surface, central Tibetan Plateau. J. Glaciol., 59(213), 137-148.