CHANGE DETECTION OF SEAFLOOR TOPOGRAPHY BY MODELING
MULTITEMPORAL MULTIBEAM ECHOSOUNDER MEASUREMENTS
E. Zirek, F. Sunar
Istanbul Technical University, Department of Geomatics Engineering, 34469, Maslak, Istanbul [email protected], [email protected]
Commission VII, WG 5
KEY WORDS: Multibeam Echo sounder, 3D sea floor modeling, change detection
ABSTRACT:
The term "topography" implies the study of numerous landforms that exist on or below the Earth and a detailed knowledge of topography is required to understand the most Earth processes.In the oceans, sea floor topography refers the geographic features of the sea floor including the configuration of a surface and the position of its natural and man-made features; and detailed nautical chartsare fundamental for many sciences such as physical oceanography, biology and marine geology.
The hydrographic offices, which use the Multi Beam Echo sounder (MBE) system for the establishment of nautical charts, have their own set of accuracy standards for hydrographic surveys, which generally comply with the standards defined by the International Hydrographic Organization. MBE systems include multiple measurement systems such as sonar head, positioning system, motion sensor that work in a synchronized manner. Before the measurements, the ‘Patch Test’ is required to eliminate the systematic errors due to instrumental synchronization and installation. In this test, signal delay test (latency), Y-axis rotation (roll), X-axis rotation (pitch), Z-axis rotation (yaw) errors are calculated. Besides, the effects of the sound velocity measurement through water column and the sea level changes need to be taken into consideration especially in the multi-temporal data analysis and 3D modeling.
In this paper, the seafloor of the Anamur -TRNC Drinking Water Pipeline route in the ‘Northern Cyprus Water Project’ is selected as a study area. This project, a unique in the world, is an international water diversion project designed to supply water for drinking and irrigation from southern Turkey to Northern Cyprus via pipeline under Mediterranean Sea. Multi temporal multi beam echo sounder measurements are used in the change analysis and surface modeling and the efficiency of this system is outlined together with its limitations.
1. INTRODUCTION
The World’s oceans are covering almost 75% of total surface
area. This fact alone indicates how important oceans and ocean geography for all life forms on the Earth. Same as the landside of the Earth, ocean floor contains slopes, geological contents, shelves, sub marine canyons etc. Hence, a detailed knowledge of sea floor topography is fundamental to the many sciences such as physical oceanography, biology and marine geology. Hydrography is the science of determination of the sea floor topography by using proper and acceptable techniques. Many different measurement systems are being used to determine sea floor topography. In general there are two main systems used for this purpose. First one is the classical manual measurement system like a rope and a Secchi disc that can be used for very shallow water. The second one is the modern measurement systems such as LIDAR (Light Detection and Ranging), radar altimeters and the acoustic systems, which are faster and more accurate. Among the modern methods, the acoustic systems, both single-beam sounders and multi beam echo sounder systems, are the most preferable ones. Single beam and multi beam echo sounder systems use SONAR (SOund Navigation and Ranging) to send sound beam from transducer to seafloor and read reflected sound data. Depth can be calculated by the time difference between transmitted and reflected data. From the 1930s, single-beam sounders were mostly used to create bathymetric charts.
Today, multi beam echo sounder (MBES) is used to get a more precise description of the bottom topography with hundreds of very narrow adjacent beams arranged in swath degrees across track line. These new survey data sets are extremely dense in comparison to traditional surveys, and basically provide total coverage of the bottom. To capture and store bathymetric data from these datasets for subsequent analysis and modelling, some basic approaches such contours and grid models are used. A three dimensional model of the sea floor created by these approaches is very important for environmental monitoring such as bed shear stress, erosion rates, etc., and also for simulations (Derek D., 2014).
This study is focused on the comparison of two depth data which surveyed in different time periods on the channel dragged along the water pipeline project route between Turkey and Turkish Republic of Northern Cyprus. The depth data sets will be used to determine seafloor difference on this dragged channel. With the 3D modelling, it is aimed to monitor the changes along the shallow part of the pipeline route, which are crucial for the marine geology and the pipeline risk assessments such as sea floor erosion, sediment deposition, etc.
2. STUDY AREA and DATA USED
Hence, with this project, first of its kind in the world, 75 million cubic meters drinking and irrigation water will be supplied to a severely water-deficient North Cyprus after completion.
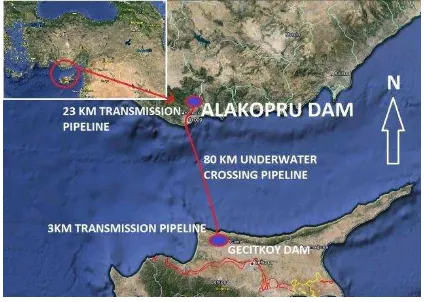
The project consists of four stages. The first one is the Alakopru Water Dam, having a capacity of 103 million cubic meters, and already built in 2014, July. The second stage is the transmission line between the Alakopru Water Dam and the Anamorium pumping station, which connects to underwater pipeline. The next stage of the project is the underwater part, which involves the most important part and makes the project unique in the world. This stage will be 80 km long. The pipeline will cross the route from Anamur
(Turkey) to Geçitköy (TRNC) as deep as 1430 meters and will be suspended in 250 meters below the sea surface (Wikipedia, 2014). One of the reasons for being unique is the size of the pipeline (1600mm diameter and 500 meters monolithic pipes)( Kalyon Construction, 2013). The final stage is the transmission line between the Geçitköy to
Geçitköy Water Dam. The total project length will be 107 km from one water dam to another (Figure 1)
(
General Directorate of State Hydraulic Works, 2012).As a dataset, the multibeam echo sounderdata are collected along this water pipeline project route. The data comprises depth information of shallow parts of pipeline route (8-30 m water depth). Between these depths, there is a channel on both sides of this project route, which dragged by a dragging ship. Inshore entrance of pipeline in both sides will be located in each of them.
Figure 1: The map of the study area showing the water pipeline project route.
In the Turkish part, the first survey took place in June 2013 and the second one is performed in October 2013, whereas in the TRNC part, surveys are completed in July 2013 and March 2014, respectively.
3. METHOD
Although only multibeam echo sounder system is used in this study, both single beam or multi beam echo sounder systems use SONAR (SOund Navigation And Ranging) for the depth measurements. In principle, the system sends sound beam from transducer to seafloor and read reflected sound data. The depth is calculated by the time difference between transmitted and reflected beam. Single beam echo sounder sends one pulse per measurement whereas the multi beam echo sounder sends a pulse and reads all scattered data. This enables to MBES having larger swath width and area coverage (Figure 2) (NOAA, 2012).
Figure 2 :Multibeam Sonar (© NOAA).
As given in the Table 1, a high frequency (400 kHz
frequency, 0.5° beam width across track, 256 beams along track and up to 160° swath coverage) multibeam echo sounder was used to collect high-resolution depth data in 20 cm x 20 cm grid. The use of high frequency is an important parameter in the change detection accuracy assessment. Girne Mareograph station is used as a tide station to reduce depth data to Mean Sea Level (MSL). The sound velocity is another variable that is measured through the water column and as a real-time by using a conductivity-temperature-depth probe (CTD) and sound velocity sensor (SVS) devices inserted in the data acquisition system for the acoustic correction. Besides, differential GNSS positioning data is used for vertical positioning data together with the XP (decimetre level accuracy) correction signal provided by Fugro SeaStar. In addition to positioning system dual-heading antennas is used to determine heading information of vessel. After the data collection phase completed, all dataset are transferred to the computer using software synchronized to data through time stamps. For the data consistency, same survey equipment is being used for both surveys done in the both sides.
Table 1: List of the survey equipment used.
Equipment Model
Multibeam Echo sounder R2 Sonic 2024 Motion Sensor
(MRU/IMU) Pos MV Wave Master
Sound Velocity Profiler RBR XR-620 Sound Velocity Sensor Valeport Mini SVS Positioning Fugro SeaStar 9200 DGPS Heading Antennas Trimble Dual Antennas
Software Hypack Hysweep
The survey conducted in this study is designed to reach the survey standards defined by International Hydrographic Organization (IHO). These standards are designed to execute the hydrographic surveys for the collection of data, which will primarily be used to compile navigational charts (International Hydrographic Bureau, 2008). In other words, these are required for conducting appropriate measurements with the equipment to be used and also for ensuring the adequate calibrations to be performed prior to, as well as during and, if appropriate, after the survey being carried out.
3.1. Pre-processing and Signal Corrections
phases. In this study, the phases taken into consideration are the general standards that need to be adopted and are described in below.
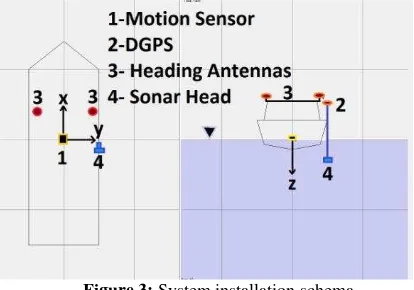
a. System Installation and Offset Measurement Multibeam sonar head is mounted to the bow of the vessel in a way that fixed rigidly in one immoveable position and away from any electrical and mechanical noise interference. This installation is crucial and required to prevent the sonar sound pulses from noises, which might be caused by vibrations come from the vessel engine. Other important piece of the system is the motion sensor (IMU/MRU) that needs to be
mounted to the vessel’s gravity centre as close as possible (Burnett, 2013).
To determine heading information, dual antennas are installed to top of vessel across the vessel track direction. The aux GPS antenna directly mounted on vertical alignment of sonar head to decrease the offset values against offset measurement mistake (Figure 3).
The process of physical alignment of the equipment on the vessel is referred to as offsets. Before to starting measurement, the gravity centre of vessel determined and motion sensor mounted on the centre. The centre of gravity obtained from the blueprints of vessel. This point accepted as reference point of all measurements. As the offset measurement is crucial for accuracy of the survey data, measurements are referenced to reference point of vessel. In this respect offsets are measured using a metal tape and plumb bob. After making the first leg measurement, the second leg measurement made in another direction to confirm the results. A centimeter level disagreement detected and this error is averaged for measurement data. As a next step, sonar head draft, which directly affects depth data, is measured. From the draft measurements, the water between sea surface and sonar head measurement plane is determined (Brennan, 2009).
Figure 3: System installation schema.
b. System Calibration
Before the measurements, the ‘Patch Test’ is required to
eliminate the systematic errors due to instrumental synchronization and installation. In this test, signal delay test (latency), Y-axis rotation (roll), X-axis rotation (pitch), Z-axis rotation (yaw) errors are calculated (Figure 4).
Figure 4: Calibration axis (R2sonicLLC 2014).
For the patch test, the selection of the test area is important to determine not only the errors caused by installation but also the angular misalignments and timing differences in the multibeam system hardware. To have a better patch test results, some seafloor features such as slope, flat bottom and a discrete objects (i.e. a pipe, shipwreck or rock) are required in the patch test area. Matching and locating these more observable features ensure better results for patch test. In this study, the project area is selected as a patch test area because the channel in survey area is ideal for this purpose.
Four tests performed in this area and proper lines planned for each test (Figure 5). Patch test results are listed in the Table 2 and the tests performed are outlined below:
1. Pitch test: it is done to determine the offset or angular misalignment between the fore/aft orientations of the multibeam sonar head with respect to the motion reference unit (MRU), mounted to the gravity centre of the vessel. 2. Roll test: Similar to the pitch test; it is performed to determine the offset or angular misalignment between the port/starboard orientations of the multibeam sonar head respecting with MRU.
3. Yaw test: it is applied to determine the offset or angular misalignment between the orientations of the multibeam sonar head with respect to the heading antennas.
4. Latency test: It is performed to determinate time-synchronization differences between the times tagging of the multibeam soundings with respect to the time tagging of the position records. For this purpose, ports, protocols, and services (PPS) cable are used for data flow. Since PPS which provides data packages in chosen time periods, is used in this study, the latency test was not performed (Burnett, 2013).
Figure 5: Patch test survey lines.
Table 2: The patch test results.
PITCH ROLL YAW
c. Data Acquisition
The main advantage of the multibeam echo sounder survey is to cover all survey area by sweeping. In this study, dragged channel area is covered for both sides and for all surveys in the specific route. All data recorded in a log file as raw data. The recorded raw data includes all motion recordings of vessel (pitch, roll, yaw, and heave), 3D positioning information (X, Y, Z) and time tagging of survey data. Those survey data were collected along the survey lines, which configured by the helmsman (Figure 6). Survey lines were defined taking the depth changes into consideration. According to the depth changes, the coverage is also changed relatively. During the trial, all return signals are recorded together with the corresponding GPS measurements to determine the exact location (Brown & Noll 2003).
Figure 6: Tracks of survey lines.
3.2. Data Processing
The aim of this step is to make ready all the data collected for the analysis by checking and cleaning from the errors and noises (also called spikes). In other words, the navigation track lines, heave-pitch-roll, tide-and-draft and sound velocity profile information are reviewed before processing.
Collected data is edited by using a area-based editing tool
which groups points into ‘cells’ and applies statistical filters
based on the distribution of z-values in each cell. Noise data, major flyers, blowouts or bad outer beam data are being cleaned from each data set to not effect to final dataset (Figure 7) and then exported as X, Y, Z file for 3D modelling (Mallace & Gee, 2005).
Figure 7: Noise cleaning process.
Both for data acquisition and data processing, the WGS84
datum and UTM 36N (30°E-36°E) projection are used.
3.3. 3D modelling
The most exciting processing step for the bathymetric survey is modelling of the seafloor and comparison of multi-temporal multibeam bathymetric data sets. The bathymetric digital terrain models or DEMs are the real strength of multibeam sonar remote sensing providing an improved vision of the seafloor.
The demand for bathymetric digital terrain models or DEMs are growing with the increase in use of GIS and with an increase in the quality of information extracted using elevation data. These models are seen as a critical source of information for change detection analysis.
In this study, 3D surface modelling application carried out with Fledermaus software that has a feature of 3D visualization and analysis for elevation data. Full resolution bathymetric and terrain model can be created and interacted with this software (Figure 8). The software operates to create 3D model with equidistant grid algorithm. The depth values are calculated for gridding with method of weighted moving average. This method analyses data points by creating a series of averages of different subsets of the full data set.
Figure 8: TRNC side 3D seafloor model
.
Besides, the effect of the sound velocity measurement through water column is taken into consideration. The sound velocity produced by probing CTD along water column is logged into survey software (Figure 9). Velocity values are in m/sn and the max depth is 340m that CTD deployed.
Figure 9: CTD profile measured for survey data.
4. APPLICATION
echo sounder data to implement specific representation of seafloor requires sufficient computer system and faster modelling algorithms. The multibeam echo sounder system used in this study, provides equiangular and equidistance depth data. With the Equiangular swath measurement, it is possible to collect data in narrower intervals; hence the shallow water measurement achieved approximate 0.20 m x 0.20 m resolution in nadir. Due to huge data sets and prevent seafloor model from interval difference between nadir and side beams, a frequent type of filtering is used to increase the grid interval distance from approximate 0.20 m by 0.20 m to a grid of exact 0.5 m by 0.5 m. This grid calculation is made by using weighted moving average which is flexible for surface modelling (De Wulf, et al., 2012).
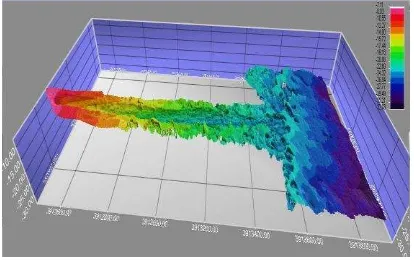
Four 3D surface models (for two phase measurements from each side) are produced as an output of the model analysis. The data coverage of the Anamur side is specified as 2000m along the route and 150m widths and for TRNC side 1500m along the route and 200m widths. 3D seafloor model of each side is given in Figure 10 (a) and (b).
(a)
(b)
Figure 10: 3D seafloor models (a) Anamur_P2. (b) TRNC_P2.
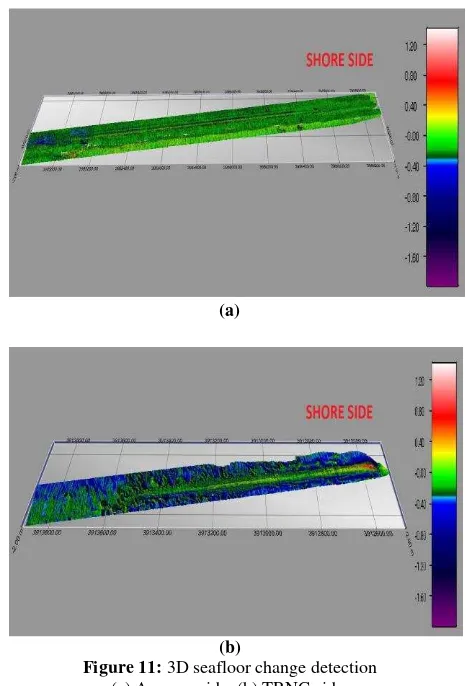
By using surface difference calculation tool, the differences between two seafloor surfaces are modelled as change. The algorithm determines the height at the bin centre from the other surface using linear interpolation of the nearest bins at
the point of interest. The determined surface differences from the two height values are recorded to the output file. Figure 11 (a) and (b) show the changes occurred in both sides of the project route.
(a)
(b)
Figure 11: 3D seafloor change detection (a) Anamur side. (b) TRNC side.
5. RESULTS
Both survey areas have surface differences along and around the channel area (Figure 11). These changes are detected especially on channel route due to dredge deformation of channel slopes.
Change detection analysis done in the Anamur side showed that the area has changed 4.580 cubic meters according to the volume calculation four months after dredging. This seafloor change observed from channel slopes through centre of the channel. Slides are formed in depths in the outer part of the Anamur foreland alignment. Based on this observation it is understood that the foreland acted as natural protector from coast to -18m water depths. Approximate depth change observed in this part is 20 cm as shown in Figure 12.
Figure 12: Change detection profile of shallow part.
Figure 13: Change detection profile of middle part.
On deeper part of channel, the same changes are observed in the middle part. Figure 14 shows the changes of the profile taken in the deeper part of channel.
Figure 14: Change detection profile of deeper water part.
For the other side of project area, one-year interval multi-temporal seafloor models are used. Change detection calculations showed that 12.617 cubic square meters changed in the study area of TRNC side according to the volume calculation. Same as the Anamur side, seafloor slides from channel slopes and materials left during the dredging operation caused this change. Also sea dynamics transported sediment materials into channel. In this section it is observed that, especially the channel area changed along the route.
The beginning of the channel dredge stars from -8 meters water depth. While the sea surface waves come to shores they break with the form of foamy, bubbly surface. The region of breaking waves defines as the surf zone which usually between 5m and 10 m water depth. This area meets with the inflow of the channel of TRNC side. Due to surf
zone, the major changes are detected in this area. The Figure 15 shows approximate 2m-depth change that observed in the channel.
Figure 15: Change detection profile of the surf zone.
The second profile is selected on the middle part of the channel. It shows that the same transport regime occurs as in Anamur side but one year interval of data collection causes to detect more deposition on channel which is approximately 50cm as shown in Figure 16.
Figure 16: Change detection profile of the middle of the channel
.
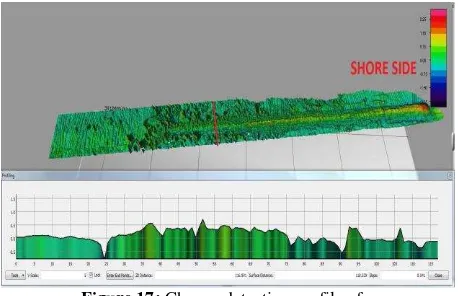
The deeper part of the channel indicates the same regularity of surface difference with the profile in the middle part of the channel. The approximate depth change is observed as 50cm (Figure 17).
6. CONCLUSIONS
In this case study, the seafloor change has been detected by using multi-temporal multibeam echo sounder data. The change of seafloor and the deformation of manmade structure on study area are calculated with 3D seafloor models created by using high-resolution multibeam data and data gridding method.
For both Anamur and TRNC side, ±5cm error is encountered between multi-temporal survey couples. The main sources of this error are multiple equipment installation and possible offset errors during the installation. In this context, the patch test used for the synchronization of the equipment in the multibeam system is crucial. Besides, the collection of the sound velocity and tidal data is directly affecting the reliability of the model.
Change detection analysis showed that shallow part is protected by a natural breakwater in the Anamur side; but along the channel, it is homogeneously filled by sea material. However the TRNC side has different feature as sea dynamics, it is clearly seen the effects of surf zone in shallow parts of channel. Besides the changes in and around the channel, the dredged area is distinctly existed in area. Furthermore, it is also observed that the material, which filled up the channel area, can be identified as a coarse material because of its transport rate by sea dynamics.
REFERENCES
Brennan, C.W., 2009. R2Sonic LLC Multibeam Training – Offset measurements, pp. 1-10.
Brown, J., Noll, G., 2003. Multibeam Sonar Data Acquisition Systems: A Simplified conceptual model. (NOAA 2003), pp.1-10.
Burnett, J., 2013. Multibeam System Setup and Patch Test Data Collection, Hypack Software Publication, (July 2013), pp. 1-9.
Derek D., 2014. Describe the Ocean Floor and Its Importance, http://www.ehow.com/info_8597301_describe-ocean-floor-its-importance.html (last access: 2014).
De Wulf, A., Constales D., Stal C., Nuttens T., 2012. Accuracy Aspects of Processing and Filtering of Multi beam Data: Grid Modeling versus TIN Based Modeling, Belgium (FIG Working Week 2012), pp.1-6.
General Directorate of State Hydraulic Works, 2012.
KKTC’ ye Su Temini Projesi,
http://www.dsi.gov.tr/projeler/kktc-su-temin-projesi, (© 2012 DSI ).
International Hydrographic Bureau, 2008. IHO Standards for Hydrographic Surveys, 5th edition Special Publication No. 44 (February 2008), pp. 22-28.
Kalyon Construction, 2013. Turkey-Cyprus Water Supply Project, http://www.kalyongrup.com/en-us/projects/ongoing- projects/water-and-energy-projects/turkey-cyprus-water-supply-project.aspx.
Mallace, D., Gee, L., 2005. Multibeam Processing – The End to Manual Editing?, U.S. Hydro 2005, San Diego, California, 29-31 March 2005.
NOAA, 2012. Hydrographic Survey Techniques, Multibeam Sonar,
http://celebrating200years.noaa.gov/breakthroughs/hydro_sur vey/welcome.html#hydro (Revised July 19, 2012).