CONGRUENCE ANALYSIS OF POINT CLOUDS FROM UNSTABLE STEREO IMAGE
SEQUENCES
Christian Jepping, Folkmar Bethmann, Thomas Luhmann
Jade University of Applied Sciences, Institute for Applied Photogrammetry and Geoinformatics, Oldenburg, Germany
[email protected]; [email protected]; [email protected]
Commission V, WG V/1
KEY WORDS: stereo image matching, 3D point tracking, congruence analysis
ABSTRACT:
This paper deals with the correction of exterior orientation parameters of stereo image sequences over deformed free-form surfaces without control points. Such imaging situation can occur, for example, during photogrammetric car crash test recordings where on-board high-speed stereo cameras are used to measure 3D surfaces. As a result of such measurements 3D point clouds of deformed surfaces are generated for a complete stereo sequence. The first objective of this research focusses on the development and investigation of methods for the detection of corresponding spatial and temporal tie points within the stereo image sequences (by stereo image matching and 3D point tracking) that are robust enough for a reliable handling of occlusions and other disturbances that may occur. The second objective of this research is the analysis of object deformations in order to detect stable areas (congruence analysis). For this purpose a RANSAC-based method for congruence analysis has been developed. This process is based on the sequential transformation of randomly selected point groups from one epoch to another by using a 3D similarity transformation. The paper gives a detailed description of the congruence analysis. The approach has been tested successfully on synthetic and real image data.
1. INTRODUCTION 1.1 Application
This research is allocated to a special problem in car safety testing. Real crash tests and numerical crash simulations are used to investigate the behaviour of a car during heavy impacts of mechanical forces in order to evaluate the potential of injuries for involved persons (e.g. driver, pedestrians) and to develop efficient approaches to maximize safety. A number of different sensors and systems are used to measure different effects during the crash test. Photogrammetric high-speed camera systems are used to record the geometric behaviour of different object, for instance the 3D trajectories of dummy bodies or the surface of dynamically deformed car parts. The results of photogrammetric measurements are subsequently used for the verification and validation of finite-element simulations (FE) which are developed for every car type. These numerical models are successively improved by data from real experiments (Raguse et al., 2004).
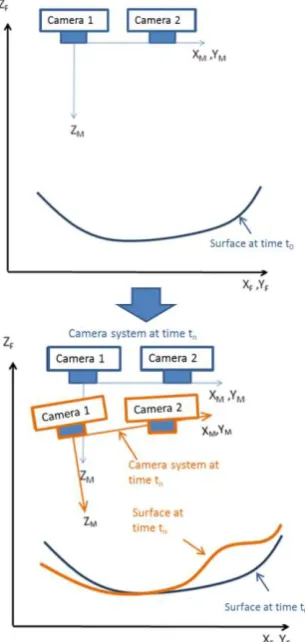
For this verification process it is required to provide data fusion of photogrammetric results with data from other sensors. Hence 3D data has to be transformed into the global coordinate system of the car XF, YF, ZF, see Figure 1. If calibrated stereo or multi-camera systems are used that observe the car from an external viewpoint, the transformation can be provided by given control points that are targeted on stable parts of the car body. In contrast, using on-board camera systems that are observing only partially stable object areas, this approach cannot be applied.
In addition, due to the massive forces during crash it cannot be assumed that the interior orientation of on-board cameras stays constant, not even for high-stability camera bodies.
Figure 1. Possible camera- and object-movements, and object deformations between time t0 and time tn
With respect to photogrammetric aspects and under consideration of the above described problem of data fusion, the following technical problems can be identified (Figure 1):
The relative orientation of cameras (in system XM, YM, ZM) will change from epoch to epoch (i.e. with each frame).
The observed object area will be deformed; reference points with pre-defined coordinates XF, YF, ZF are not valid anymore; hence, calculation of new exterior camera orientation with respect to the coordinate system XF, YF, ZF is not possible any longer.
The spatial transformation of the system XM, YM, ZM with respect to the car coordinate system XF, YF, ZF will change from epoch to epoch.
The parameters of interior orientation can be changed.
This paper will discuss some approaches for the solution of the above mentioned issues. The main part of the research deals with a RANSAC-based method for the detection of stable object areas (congruence analysis, see section 3) which allows for the successive re-orientation of camera system XM, YM, ZM relative to the object surface. Congruence analysis requires appropriate data which is described in the following section.
2. DATA
Within the following sections the generation of the input data for congruence analysis is described. Section 2.1 presents the approach for stereo matching and 3D point tracking. Section 2.2 explains the necessity for re-calculation of the relative orientation of the cameras for each time step and gives a schematic description of the information within the 3D trajectories of the object points which are subsequently used for the congruence analysis.
2.1 Stereo matching and 3D point tracking
For congruence analysis (section 3) the spatial trajectories of a high number of 3D points are required which lie on the observed object surface. For this purpose the software package PISA (Photogrammetric Image Sequence Analysis) is used that has been developed at IAPG. PISA allows for the extraction of a dense 3D point cloud starting in epoch 0 for a well-defined object area with sufficient texture. Image-based point matching is based on extended least-squares matching (Bethmann et al., 2009).
In addition, each point can be tracked into the next epoch by robust tracking to give 3D point trajectories through the complete sequence. The tracking algorithm uses stereo-matching local window-based stereo-matching techniques (normalized cross-correlation (NCC) and least-squares matching (LSM)) for the tracking of image points. Since in crash-test environments, and especially for on-board scenarios, a lot of disturbances (e.g. occlusions, dust, changing light reflection on the object surface and so on) may occur, the tracking algorithm should be able to handle these disturbances as robust as possible. Therefore, an algorithmic solution has been developed which focusses on integrating all available (stereo-) information as extensive as possible. Figure 2 illustrates the procedure of 3D point tracking exemplarily for the tracking of one point.
Figure 2: Point tracking
The point tracking starts with the 3D coordinate of a point at time t0 which has been calculated by stereo matching with PISA
in epoch 0. The 3D coordinate is back-projected into both images and the resulting image coordinates are used for the initialization of the tracking algorithm. The movement of the image coordinates between time t0 and time t1 are estimated by
using NCC and LSM (temporal image matching). The result of this temporal matching is verified by using different statistical parameters (mainly the correlation coefficient of NCC and s0 a
posteriori of the LSM). Within this verification process three cases are distinguished:
1. Point is disturbed in both cameras
2. Point is disturbed in one camera (left or right) 3. No disturbance
Figure 2 shows exemplarily the case 3 for time t0 to t3 and the
case 2 for time t4 to t5. In case 2 the algorithm tries to re-detect
the point which is lost in camera 1. On the one hand, the algorithm tries to retrieve the temporal correspondence by matching between the last position of the point at time t3 to time
t4, t5 and so on. On the other hand, the algorithm tries to retrieve
the stereo-correspondence by matching between the point in the second camera (which is successfully tracked) and the approximate position for the point in camera 1. For the definition of the approximate image coordinates for spatial and temporal matching knowledge of the epipolar geometry is used. Since rectified image pairs are used, the point can be shifted to the y'-coordinate of the (horizontal) epipolar line which is known due to the successful point tracking in camera 2. Since the relative orientations of the cameras may change between two time steps this solution must be regarded as an approximate solution. The x'-coordinate of the lost point can optionally be estimated by using a simple linear prediction algorithm. To increase the probability for a subsequent point re-detection it is possible to increase the size of the search windows for spatial and temporal image matching. The described algorithm is able to re-detect temporarily disturbed points with a high probability. Further on, it is able to label points that are temporarily disturbed (e.g. by assigning a special point code) which is necessary to avoid their introduction into the congruence analysis.
2.2 Re-calculation of the relative orientation
For this approach it is assumed that valid parameters of interior and exterior orientation are given for epoch 0. The point trajectories are then calculated in the coordinate system of The International Archives of the Photogrammetry, Remote Sensing and Spatial Information Sciences, Volume XL-5, 2014
exterior orientations. As already being mentioned, the exterior orientations cannot be assumed to be stable during the sequence. However, since >5 homologous points can be measured in each epoch i, the relative orientation, based on the coplanarity constraint, can be calculated for each epoch with respect to the local coordinate system XM, YM, ZM (e.g. Luhmann et al, 2013). Consequently, the measured 3D points are given in system XM, YM, ZM whose scale can vary from epoch to epoch, depending on the amount of camera movements. Following this strategy, all points can be tracked in this coordinate system for the complete image sequence. The measured points implicitly consist of the following information:
the real deformations in object space
scale changes in system XM, YM, ZM
relative movements between object surface and camera system
The task of the following congruence analysis is to distinguish between these three effects. The main aspect is the separation of deformed object areas from non-deformed or less deformed patches. If stable object areas can be identified, the camera system can be re-oriented using points of these areas. The new transformation gives the relative movement between cameras and object surface for each epoch of the sequence.
3. CONGRUENCE ANALYSIS 3.1 State of the art
Congruence analysis is a key step in classical geodetic deformation analysis (Welsch et al., 2000). Given a geodetic network measured in several epochs, the objective of congruence analysis is to test significant deformations in terms of point movements. Classical geodetic deformation analysis is based on a well-defined separation between stable reference points and unstable object points.
If surface point measurement is done by photogrammetric stereo processing, no clear between reference points and object points can be provided. Thus, congruence analysis will be based on all object points whereby area-line deformation must be assumed.
As a consequence, special requirements for congruence analysis must be taken into account. Since the above explained relative orientation of stereo images may be subject to scale changes, the approach must be scale-invariant. It must also be invariant against rotations and translations. Since a high number of deformed object areas are expected, a single point deformation analysis will not be appropriate.
For networks without reference points several solutions for congruence analysis are known. The approach of Reinking (1994) is based on datum transformation by means of 3D similarity transformation. The method of Neitzel (2004) uses datum-invariant parameters such as distances, distance proportions or angles. Niemeyer (2008) addresses the suitability of robust adjustment techniques for transformations. Besides these approaches, RANSAC-based methods are useful for ill-posed problems with a high number of outliers.
3.2 New approach
The following method based on distance analysis, robust adjustment with m-estimators (Niemeyer 2008) and RANSAC
has been developed in order to meet the special requirements within the crash test application.
First results have shown that a method based on distance analysis between points is only of limited applicability. Since changes of point coordinates more or less parallel to the XM -/YM-plane can be detected successfully, movement in the direction of the ZM-axis cannot be determined as it is possible with other approaches.
In contrast, congruence analysis based on m-estimators yields promising results. The practical implementation of the m-estimator is based on the iterative modification of the weight matrix of observations in order to reduce the impact of outliers. However, as reported by Neitzel (2004), a level of 10% of outliers already leads to solutions in side maxima.
As a consequence, a RANSAC-based approach has been developed since the number of outliers in our datasets is assumed to be much higher. As a special modification, the Local Optimized RANSAC approach (Lo-RANSAC) according to Chumet al. (2003) has been adapted. Lo-RANSAC extends the classical RANSAC procedure by one additional optimization step.
The functional model for the Lo-RANSAC approach uses a 6-parameter similarity transformation for given scale, or a 7-parameter transformation if scale has to be determined as well. This function enables the handling of translations, rotations and optionally scale of points groups that are stable within itself and moving within the XM, YM, ZM system.
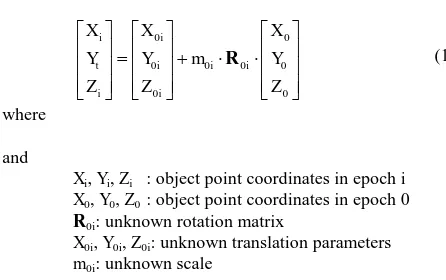
The functional model is given by
R0i: unknown rotation matrix
X0i, Y0i, Z0i: unknown translation parameters
m0i: unknown scale
Figure 3 displays the flow chart of the RANSAC approach based on the functional model of eq. 1.
For the determination of the 6 (resp. 7) unknowns a minimum of three points is required. They are selected randomly from the total set of points (step 2 in Figure 3). Subsequently, the unknown parameters of the transformations between epoch 0 and epoch i are estimated by least-squares adjustment (step 3). Since the functional model is overdetermined (redundancy r=3 with 6 and r=2 with 7 unknowns) the standard deviation s0 a
posteriori may be used as a measure of transformation precision for every epoch i. In step 4 all s0i are tested against a given
threshold. If this test is successful for all epochs, all points of epoch 0 are transformed by the calculated parameters into all subsequent epochs (step 5). Based on the calculated s0i are used
to determine the standard deviations of transformed points: The International Archives of the Photogrammetry, Remote Sensing and Spatial Information Sciences, Volume XL-5, 2014
X
The definition of weights considers the imaging configuration, typically pX = pY and pZ < pX if the stereo base b is shorter than
the minimum object distance h. Subsequently the differences Δx, Δy, Δz between transformed points and measured points of the actual epoch, and their absolute values are tested against the 3-sigma confidence interval of the transformed points. All points that meet the test criterion |Δx| < 3·sx, |Δy| < 3·sy and |Δz|
< 3·sz are accepted as new points for the congruent group (step
7). The introduction of standard deviations as thresholds can be regarded as a variation of the Lo-RANSAC approach since it usually works with pre-defined fixed threshold values.
When a congruent point group has been enlarged by the above describe procedure, the coefficients of the 6- or 7-parameter transformation are recalculated using the three original points and all new added points. This procedure will be repeated until the group cannot be enlarged any further. In this case the point group will be stored (step 9). Since it is possible that the maximum group is not found immediately the process will be restarted by using three new random points (step 2). In order to limit the computational effort this step will be repeated until a maximum number of iterations has been reached (step 10). The necessary number of iterations depends on the number of outliers in the dataset.
As for RANSAC, the presented method depends on only one parameter which is a threshold t for s0 a posteriori of the 3D
similarity equation. This parameter can be defined empirically or derived from the image configuration by using the base-to-high ratio and a priori knowledge about the accuracy of image point measurement. Within our experiments as described in section 4 we defined the threshold empirically (with t =
Figure 3. Process of congruence analysis
4. INVESTIGATION OF CONGRUENCE ANALYSIS In order to validate the developed method experiments have been undertaken based on real test data and using synthetic data as well. One significant problem for validation is the complexity of real test setups. To ensure a profound evaluation of the procedure, changes in relative orientation between cameras, changes of object orientation and surface deformations had to be applied and measured by means of an independent system of higher accuracy. Since the effort for providing reference for real
tests is extremely high, a complete and detailed investigation of the new approach is done by synthetic data while with real tests only the principle practical applicability is demonstrated.
4.1 Investigations using synthetic data
The following section summarizes the evaluation of the new congruence analysis approach using synthetic data. The use of synthetic data provides arbitrary imaging configuration and object shapes with given reference data in all stages of the process. Without great effort it is possible to modify relative orientations or changes in interior orientation during an image sequence. In addition, arbitrary object deformation and occlusions can be created. The generation of synthetic data includes object data (rotations, translations, scaling and deformations of pre-defined surfaces), their virtual texturing and the subsequent creation of simulated images for any number and type of camera and orientation parameters. Synthetic images are calculated under consideration of rigorous geometric imaging models and complex colour interpolation methods in order to ensure high image quality and sub-pixel matching accuracy. Further details about the image generation procedure is given in Bethmann et al. (2013).
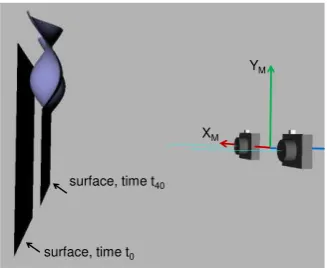
The image sequence used here consists of 40 epochs. On epoch 0 a plane is observed by a stereo camera system in a distance of 300mm. The stereo camera has a base of 150mm and a focal length of 8mm. This configuration represents a typical high-speed camera setup in car crash testing. The parameters of interior orientation are taken from a real camera calibration. The used camera calibration was taken from a stereo camera setup with two IDT N3x cameras. During the complete period of the sequence the upper part of the plane will be deformed step by step until an amplitude of 20mm has been reached in epoch 40. Additionally, a relative movement between camera system and object is applied, and the relative orientation between both cameras is also altered with ±0.5mm for the spatial position of both cameras and ±0.01rad for the camera rotations. The interior orientations remain stable. The simulated image sequence is processed according to the approach described in section 2. In this process more than 900 points have been measured and tracked into each epoch. These points have been used for the initialization of the congruence analysis.
surface, time t0
surface, time t40
YM
XM
Figure 4. Simulated imaging configuration The International Archives of the Photogrammetry, Remote Sensing and Spatial Information Sciences, Volume XL-5, 2014
result of congruence analysis: deformed object areas (red points)
result of congruence analysis: stable (non-deformed) object areas
Figure 5. Result of congruence analysis for time t40
Within the congruence analysis the threshold t for the s0 a posteriori after 6- or 7-parameter similarity transformation is set to t 0.4mm. Hence, this value is significantly higher than the expected object accuracy of the stereo system with 0.1 – 0.2mm. The result of congruence analysis is displayed in Figure 5. The green points have been identified as being stable over the complete sequence. The result meets the expectations since these points lie on not deformed object areas. However, there are also points belonging to this group which lie on deformed object areas. The reason is addressed to the function of surface deformation which follows, for this example, a sinusoidal function. The false classified points lie beneath the zero-crossing of the sine function, thus here no significant object deformation exists, or the deformation is smaller than the assumed object accuracy. As a conclusion, the green points within the deformed area are also classified correctly.
4.2 Investigations based on real data
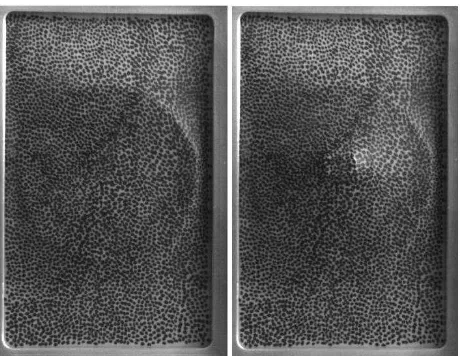
For analyzing the potential of the new approach in a real experiment, a textured membrane made of rubber material has been recorded (Figure 6). By point-wise pressing a deformation of the surface has been created that is observed by a stereo camera. The stereo system is characterized by a base line of 150mm, a focal length of about 8mm and a distance to the object of about 650mm.
An image sequence of 25 epochs has been recorded. The maximum deformation of the membrane appears at epoch 15. Again a threshold for the s0 of t< 0.4mm was defined.
In each epoch about 900 points have been measured during the process as described in section 2. The expected accuracy of each of these points is about 0.17mm in viewing direction and about 0.04mm parallel to the image planes if an image measuring accuracy of 0.1 pixels is assumed.
Figure 7 shows the result of congruence analysis. As expected, the outer regions of the membrane have been classified as not deformed. It can be observed that a few points in the border regions have been classified as deformed, presumably due to single outliers in the data set.
Figure 6. Image sections of membrane in epoch 0 and epoch 15 (contrast enhanced)
Figure 7. Measured deformation superimposed with deformation vectors (left) and one image of epoch 15
superimposed with congruent points (right)
The accuracy for the transformations of each epoch into the first epoch is below 0.18mm. That matches to the expected single point accuracy of the used stereo-camera system.
4.3 Additional investigations
Additional investigations and extensions of the implemented method are addressed to special cases in car safety testing. These include mostly the handling of partial object occlusions that may appear during the sequence due to moving dummy legs or are parts flying around through the scene. In order to solve the problem robustly, temporarily non-measured points have to be detected and labeled. It has to be noted that the least-squares matching-based point tracking is able to deal with temporary occlusions, as shown in section 2.1. The RANSAC algorithm does not exclude these points finally, but uses them only for those epochs for which the points are not occluded. If the occluded points are not used it is likely that large parts of the observed surface are not used for the congruence analysis and therefore possibly stable areas will not be detected.
5. SUMMARY AND OUTLOOK
Photogrammetric onboard measurements with stereo cameras for car crash testing requires camera systems and processing methods that can handle the special environmental conditions during high dynamic processes. The key problem is the transformation of all measured 3D data into one common coordinate system whereby stable reference points are not available. The here presented solution detects congruent object areas from unstable point clouds that have been measured by least-squares stereo matching.
With two representative examples the performance of a new developed approach for congruence analysis has been demonstrated. On the one hand, a synthetic data set with unstable exterior camera orientations has been evaluated. Synthetic data enables error-free reference data for all steps of the analysis process, hence completeness, robustness and accuracy could be tested. On the other hand, data from a real experiment has been analyzed in order to show the applicability of the new approach to real test scenarios. In addition to these examples, possible extensions of the methods have been discussed, primarily adapted to car crash testing.
One important precondition of congruence analysis is scale-invariance of the approach. As a consequence, a homogeneous shrinking or stretching of the surface cannot be detected since relative orientation compensates for any scale changes in object space. In addition, up to now it is not possible to separate changes in interior orientation from deformations in object space. As a possible future solution, additional scale bars could be placed into the observed scene, and crash-suited cameras with extremely robust mechanical design should be used.
ACKNOWLEDGEMENTS
The research has been supported by the European Fonds for Regional Development, EFRE, 2011-2013.
REFERENCES
Bethmann, F., Herd, B., Luhmann, T, Ohm, J., 2009: 3D-Erfassung von Freiformflächen aus Bildsequenzen unter Berücksichtigung von Störobjekten. Publikationen der Deutschen Gesellschaft für Photogrammetrie, Fernerkundung und Bildverarbeitung, Band 18, 2009, pp. 303-314.
Bethmann, F., Jepping, C., Luhmann, T., 2013: Generation of synthetic image sequences for the verification of matching and tracking algorithms for deformation analysis. In Remondino et al. (eds.), Videometrics, Range Imaging and Applications XII, Proceedings of SPIE, Vol. 8791, pp. 87910K1-10, doi: 10.1117/12.2020510.
Chum, O., Matas, J. Kittler, J., 2003: Locally Optimized RANSAC. In: B. Michaelis & Krell, G. (eds.): Pattern Recognition, LNCS 2781, Springer, Berlin Heidelberg, pp. 236-243.
Luhmann, T., Robson, S., Kyle, S., Boehm, J., 2013: Close-Range Photogrammetry and 3D Imaging. 2. Ed., de Gruyter, Berlin, 684p.
Neitzel, F., 2004: Identifizierung konsistenter Datengruppen am Beispiel der Kongruenzuntersuchung geodätischer Netze.
Bayerische Akademie der Wissenschaften, Reihe C, Heft Nr. 565, München.
Niemeyer, W., 2008: Ausgleichsrechnung, 2. Auflage, Walter de Gruyter, Berlin.
Raguse, K., Derpmann-Hagenström, P., Köller, P., 2004: Verifizierung von Simulationsmodellen für Fahrzeugsicherheitsversuche. Publikationen der Deutschen Gesellschaft für Photogrammetrie, Fernerkundung und Bildverarbeitung, Band 13, pp. 367-374.
Reinking, J., 1994: Geodätische Analyse inhomogener Deformationen mit nichtlinearen Transformationsfunktionen. Bayerische Akademie der Wissenschaften, Reihe C, Heft Nr. 413, München.
Welsch, W., Heunecke, O., Kuhlmann, H., 2000: Handbuch Ingenieurgeodäsie, Auswertung geodätischer Überwachungs-messungen. Heribert Wichmann Verlag, Heidelberg.