INTEGRATION OF REMOTE SENSING DATA AND BASIC GEODATA AT DIFFERENT
SCALE LEVELS FOR IMPROVED LAND USE ANALYSES
G. Waldhoff a, *, S. Eichfuss a, G. Bareth a
a Institute of Geography, University of Cologne, Albertus-Magnus-Platz, 50923 Cologne, Germany - (guido.waldhoff,
seichfus, g.bareth)@uni-koeln.de
Commission VII, WG VII/5
KEY WORDS: GIS,Land Use, Digital Landscape Model, Cadastral Data, WorldView-2, ATKIS, ALK, Multi Data Approach
ABSTRACT:
The classification of remote sensing data is a standard method to retrieve up-to-date land use data at various scales. However, through the incorporation of additional data using geographical information systems (GIS) land use analyses can be enriched significantly. In this regard, the Multi-Data Approach (MDA) for the integration of remote sensing classifications and official basic geodata for a regional scale as well as the achievable results are summarised. On this methodological basis, we investigate the enhancement of land use analyses at a very high spatial resolution by combining WorldView-2 remote sensing data and official cadastral data for Germany (the Automated Real Estate Map, ALK). Our first results show that manifold thematic information and the improved geometric delineation of land use classes can be gained even at a high spatial resolution.
* Corresponding author
1. INTRODUCTION
Satellite remote sensing is a standard method for the generation of land use and land cover data for global or regional investigations. Also at local scales, the method is still competitive using high spatial resolution data, where up-to-date information is needed for wider areas. For the global scale, remote sensing is often the only way to acquire coherent land cover information (Mora et al., 2014). However, for the regional and the local scale several additional sources of spatial information can be incorporated in a GIS to enrich the land use analysis. Although initiatives for the integration of remote sensing and GIS date back to the late 1970s (Hutchinson, 1982; Merchant and Narumalani, 2009), today a strong integration of GIS methods in remote sensing-based land use analyses is still rather the exception than the rule. Often additional spatial information is used to focus on a single subject. For example agricultural parcel boundaries are incorporated to reduce misclassification (Aplin and Smith, 2008; De Wit and Clevers, 2004; Esch et al., 2014; Lucas et al., 2007; Smith and Fuller, 2001; Turker and Arikan, 2005).
Nowadays, various official basic geospatial datasets like digital landscape models (DLM) or digital cadastral information systems are available at different scale levels for many countries. These datasets usually contain manifold high-quality information on various land use categories. Nevertheless, approaches that incorporate DLM data more comprehensively are rare (e.g. Hazeu et al., 2014) and the intensive incorporation of cadastral data is even rarer.
Hence, at first we summarise a methodology developed for the integration of remote sensing-based land use information and official DLM data for Germany for a regional scale land use analysis. Afterwards, the potential of the methodology and the usability of official German cadastral data are investigated for land use analyses at a significant higher spatial resolution (local scale).
2. MULTI-DATA APPROACH
The methodological background of the presented studies is the Multi-Data Approach (MDA) by Bareth (2008), which was adapted and further developed in the raster data model (Waldhoff, 2014). The key aspect of the MDA is the emphasis on the integration of remote sensing-based classification results and officially available basic geodata in a GIS, to generate land use data of enhanced information content.
In the initial remote sensing part of the MDA, (multi temporal) satellite images are analysed individually using supervised classification methods like support vector machines (SVM) or maximum likelihood (MLC). With regard to the information content of the additionally available datasets, the classification of each remote sensing image focuses mostly on the vegetation information that is only insufficiently provided by other sources.
In the GIS part of the MDA, the remote sensing classification results and preselected information of the basic geodata are combined to a multi-layer dataset. By the means of expert knowledge-based production rules, the valuable information of each information layer is then combined in the final land use data product. In this way, either categorical information, geometrical information or both were at the centre of attention.
3. MDA IMPLEMENTATION ON A REGIONAL SCALE
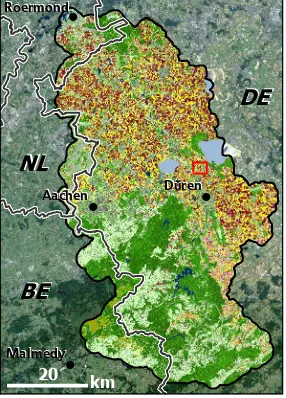
The further development of the MDA for a regional scale land use analysis (ca. 1:50.000) was conducted for the Rur catchment, being the study area of the CRC/TR 32 “Patterns in Soil-Vegetation-Atmosphere-Systems: Monitoring, Modelling and Data Assimilation” (www.tr32.de). The Rur catchment (ca. 3000 km²) is mainly situated in western Germany, but it also reaches into the Netherlands and Belgium (cf. Figure 1). It is
characterised by intensive arable land use in the north and mainly grassland and forest in the south.
The main objectives of this land use study were therefore the adequate disaggregated differentiation of the various land use types for a regional scale and the differentiation of the major crop types on parcel-level. For this purpose, a cell size of 15 m was chosen.
The handling of agricultural land and the differentiation of the crop types through the multi temporal analysis of moderate spatial resolution remote sensing data (e.g. ASTER, Landsat-7 & -8) is treated in more detail in Waldhoff et al. (2012) or in Waldhoff (2014).
Besides the crop classification, also the basic differentiation of the other major land use classes, in particular concerning non-agricultural vegetation and impervious surfaces, was obtained from the remote sensing analysis (cf. Figure 2a).
Figure 1. Land use overview of the Rur catchment.
To enhance the remote sensing results outside of agricultural land, selected land use classes of the ATKIS Basis DLM (ATKIS = Authorative Topographic-Cartographic Information System) were used for the German part of the Rur catchment (Waldhoff and Bareth, 2009). The ATKIS is provided by the official state survey and mapping agencies at a scale of 1:25,000 and is currently updated in total every three years (BRK.NRW, 2012). It includes diverse information for example on the transport system, but it also distinguishes built-up areas, different residential and industrial land uses, forest areas, arable land or grassland. The data are provided in vector format with a spatial accuracy of ±3 m (AdV, 2008b). For the study, selected ATKIS layers were rasterised and resampled to a spatial resolution of 15 m.
Figure 2b shows selected rasterised ATKIS layers for the same area as in Figure 2a. Red and orange tones indicate different residential and commercial land uses, while green colours (from dark to light) denote forest areas, non-agricultural vegetation areas and grassland. Grey colours represent different road categories (e.g. carriage way or municipal road).
Compared to Figure 2a, even after the resampling to 15 m pixel size, the delimitation of the individual land use areas appears much sharper. Also, most areas are differentiated into more land use classes than in the remote sensing result. However, the information content of some land use classes is highly aggregated. For example, there is no differentiation of arable land into different crop types. Additionally, for residential areas only sparse information is provided on the vegetation cover or
impervious surfaces. Thus, one step to improve the land use/land cover differentiation within the major land use categories (e.g. arable land, built-up, forest, other vegetation areas) was to combine either thematically or geometrically more precise ATKIS land use classes with the corresponding remote sensing classification results. In addition, land use classes that were more adequately represented in the ATKIS were fully transferred to the final land use dataset via overlay analysis.
a)
b)
c)
Root Crops Rapeseed Coniferous Trees Deciduous Trees Asphalt/Building Winter Wheat Winter Barley Bare Ground
1
km
Figure 2. (a) Subset of the MLC result of a Landsat-8 image (05.05.2014). (b) Selected ATKIS classes (rasterised). Dark red to orange tones indicate different residential and commercial land uses, dark to light green colours denote forest, non-agricultural vegetation and grassland whereas grey colours differentiate road categories. (c) MDA classification of 2014 (Lussem and Waldhoff, 2014).
Figure 2c depicts the final MDA land use classification for the subset area. Compared to Figure 2a, much more land use/land cover classes are differentiated. For example, now areas of different settlement-related land uses are distinguished (grey colours). Likewise, arable land is now differentiated into the major crops, based on the remote sensing results. Moreover, the misclassification of crops outside of arable land areas (e.g. !
! !
!
Düren Düren Aachen
Aachen
Malmedy Malmedy Roermond Roermond
20 km
DE
DE
NL
NL
BE
BE
winter wheat in settlement areas, cf. Figure 2b), was reduced dramatically with the ATKIS data. Yet, the classification of vegetation in settlement areas per se was maintained to differentiate vegetated and impervious surface areas within the corresponding ATKIS classes. Finally, the final MDA result now contains areas that are occupied by the transportation network. Such areas are usually not adequately represented in remote sensing classifications.
4. LOCAL SCALE INVESTIGATION
Based on the results that were achieved for a regional scale, this study was intended as a first evaluation of applying the MDA on a high spatial scale (in the range of 1:5000 and higher) using the adequate basic geodata. For this study, a part of the Rur catchment in the north of Düren, near Selhausen was selected (red square in Figure 1).
4.1 Remote sensing analysis
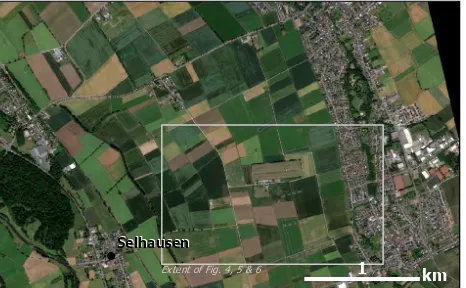
For the high spatial resolution remote sensing land use mapping a WorldView-2 (WV-2) image of June 11, 2014 was chosen (Figure 3). The WV-2 sensor has a spatial resolution of 2 m for the eight multispectral channels that were used (Updike and Comp, 2010). In accordance with the procedure of the MDA, the WV-2 image was separately classified using the supervised MLC algorithm.
!
Extent of Fig. 4, 5 & 6 Selhausen
Selhausen
1 km
Figure 3. Subset of the WorldView-2 image (11.06.2014).
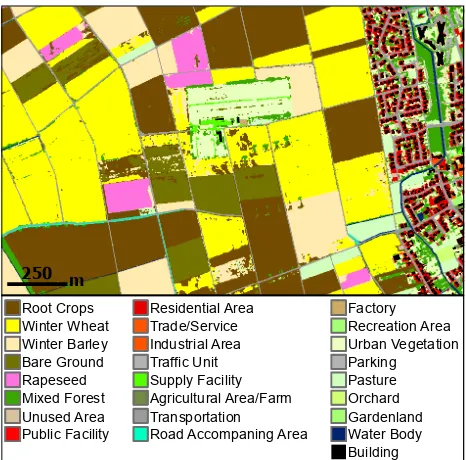
For the aim of the investigation the classification yielded satisfying results for the major crop types and for the other land use classes (overall accuracy: 91.30 %). Figure 4 displays the result for a subset of Figure 3.
250 m Root Crops Winter Wheat Winter Barley Bare Ground Pasture Rapeseed Forest Water Asphalt/Building
Figure 4. Subset of the MLC result of the WordView-2 scene.
Owing to the acquisition date of the WV-2 image, many agricultural parcels which comprise summer crops either still
show more or less bare ground (brown and olive colours and in Figure 4) or the development stage of the crops was inadequate for the identification of the crop. As a result, no specific crop types could be classified on the corresponding parcels whereas winter crops were adequately differentiated.
4.2 Integration of additional data
Concerning the integration of the remote sensing results with additional data at this spatial resolution, cadastral information systems are the first choice in terms of geometric accuracy and thematic resolution. Thus, in this study the usage of the Automated Real Estate Map (Automatisierte Liegenschaftskarte, ALK) was investigated. This data product is available in vector format for whole Germany and is produced by the official cadastre offices (Ehrmanntraut and Nerkamp, 2011). As a result, it is continuously updated and of high quality. However, for this study only polygon data of 2009 was available, so that there is quite a large time gap between the acquisition date of the remote sensing data and the production date of the ALK. Yet, for the aim of the study the data was considered suitable. The ALK is a spatially comprehensive data product and describes the actual use of land parcels at a resolution of about 1:1000. It contains diverse and detailed information on the use of each land parcel, like specific types of residential or commercial use, dominant vegetation cover (e.g. deciduous, coniferous or mixed forest, copse or pasture) or the spatial extent of the different transportation route categories. Moreover, it also informs about the existence and the geometry of small vegetation patches which often accompany roads (turquoise colour in Figure 5). Furthermore, the surface areas occupied by buildings are included.
4.3 Results
For this study, an area of roughly 45 km² was available, where the ALK data and the WV-2 scene overlapped. This area includes 17,776 single land parcel objects that are organised into 131 different classes. To handle the vast amount of thematic information, associated classes where aggregated to 29 superordinate categories that are relevant for a common land use analysis. In this regard, for example land use classes like health, public administration, research and education were combined to the class public facilities.
250 m
Figure 5. Example of the selected and aggregated ALK classes for the land use analysis (class colours correspond with Figure 2b).
Figure 5 illustrates the thematically aggregated ALK layer for the selected subset. Still manifold land use categories are differentiated. The grey lines delimit the individual land parcels. Following the general colouring of the ATKIS data for
the regional scale analysis (cf. Figure 2b), for example green colours indicate forest areas, copse or pasture (from dark to light colours). Dark brown areas signify arable land. Red colours differentiate various residential and commercial land use types. Additionally, the building layer (black colour) is overlaid.
Figure 6. Integration result of selected remote sensing derived class allocations and ALK information.
In accordance with the MDA procedure presented before, at first, the land parcel layer and the layer of the building geometries were converted to raster layers with the same cell size as the WV-2 data. In the MDA-GIS-part, the classification results and the ALK raster were then combined to a layer stack. Afterwards, selected information of each layer was subsequently integrated into the final land use layer to enrich its information content (cf. Figure 6).
On the one hand, arable land, as indicated by the ALK, was disaggregated with the crop type distribution information of the remote sensing classification for the corresponding land parcels. Additionally, the misclassification of impervious surfaces within arable land (caused by the high spectral similarity e.g. of asphalt and dry soil) could be reclassified to bare soil through the utilisation of the ALK data (compare centres of Figures 4 & 6). On the other hand, for non-agricultural land use classes, the ALK land use information was combined with the remote sensing-based land use/land cover information. In doing so, the classification results on vegetation coverage, impervious surfaces or bare ground were used to disaggregate the land use information within the cadastral parcels of settlement areas. Furthermore, various land use classes of the ALK were considered as more spatially precise or thematically detailed than the class allocations of the remote sensing classification. As a result, ALK classes like the road network, road accompanying area, water body or pasture completely substituted the corresponding remote sensing class allocations in the final dataset. Also, areas occupied by buildings were transferred from the ALK.
5. DISCUSSION & CONCLUSION
In this contribution, at first the MDA for the integration of DLM data and remote sensing-derived land cover/land use
information for the regional scale was recapped. It was shown that by using multiple data sources in a knowledge-based approach, manifold additional information can be derived that are not obtainable from one of the incorporated sources alone. On this basis, the second study was designated to investigate the implementation of this methodological approach for a considerably higher spatial scale by incorporating geometrical and categorical information of a cadastral information system. Regarding the remote sensing data analysis, the high spatial resolution WV-2 data obviously provided much more geometrical detail, than the moderate spatial resolution remote sensing data that was used for the regional scale analysis. However, the degree of the categorical information that was obtained from the WV-2 classification was principally not very different to the results, which were obtained for the regional scale analysis (cf. Figure 2a & 4). In addition, even object-based classification approaches are not expected to lead to significant improvements without meticulous and time-consuming iterative algorithm refinement.
Concerning the enrichment of the categorical information content, already the conducted steps of integrating classification results and the cadastral ALK data revealed the high potential of this approach for large-scale land use/land cover analyses. In this study, the first focus was on the disaggregation of arable land using the remote sensing crop class allocations in conjunction with the ALK geometric information on arable land parcels. Thus, the classification of crops was restricted to arable land. For the sake of simplicity, adjacent arable land parcels were regarded as one coherent area. In future analyses, the usage of the single land parcel information will be investigated to further reduce classification errors (Smith and Fuller, 2001). For non-agricultural land use classes, the ALK land use information was combined with the remote sensing-based land use/land cover information on vegetated, bare or impervious surfaces to disaggregate the parcel-based land use information. In this regard, also misclassifications of crops in built-up areas were considered as valuable information for the identification of vegetation areas. In this way, also a higher geometrical accurateness concerning the delimitation of land cover patches was achieved.
In addition, the representation of the transportation network areas is still improved through the data integration. Especially the relatively small accompanying areas of streets are now better distinguishable from other features. Corresponding vegetation areas like small patches of bushes that accompany arable land are otherwise easily ignored or confused with the adjacent agricultural crop. The totality of such features should sum up to a significant areal extent, with regard to total areas of vegetation classes.
For this study only a rather outdated ALK dataset was available. However, for the purpose of this investigation, this aspect was negligible. The fact that cadastral data is usually continuously updated, is one of the main reasons why this data is especially attractive for the presented approach. While no dataset is without errors, there is still a high certainty of correctness in current ALK data.
In terms of the data product of the cadastral data of Germany, the ALK is currently successively replaced by the ALKIS (Official Real Estate Cadastre Information System). However, the general findings of this investigation will still apply to the ALKIS. Moreover, compared to the ALK, the ALKIS conveys even more valuable information. For example, the ALKIS also contains multiple point or line features, with attributes concerning their areal extent (AdV, 2008a). The integration of such information will be investigated in the future.
ACKNOWLEDGEMENTS
We thank Geobasis.NRW for the provision of the ATKIS Base DLM and the ALK data. The Landsat data and the ASTER data was obtained from the U.S. Geological Survey.
REFERENCES
AdV, 2008a. Dokumentation zur Modellierung der Geoinformationen des amtlichen Vermessungswesens (GeoInfoDok) - ALKIS-Objektartenkatalog, Version 6.0, Stand: 11.04.2008. Arbeitsgemeinschaft der Vermessungs-verwaltungen der Länder der Bundesrepublik Deutschland.
AdV, 2008b. Dokumentation zur Modellierung der Geoinformationen des amtlichen Vermessungswesens (GeoInfoDok) - ATKIS-Katalogwerke - ATKIS-Objektarten-katalog Basis-DLM - NRW-Erfassung, Version 6.0, Stand: 11.04.2008. Arbeitsgemeinschaft der Vermessungs-verwaltungen der Länder der Bundesrepublik Deutschland, p. 192.
Aplin, P., Smith, G.M., 2008. Advances in Object-Based Image Classification International Society of the Photogrammetry and Remote Sensing, Beijing, pp. 725-728.
Bareth, G., 2008. Multi-Data Approach (MDA) for Enhanced Land Use/Land Cover Mapping, The International Archives of the Photogrammetry, Remote Sensing and Spatial Information Sciences, Vol. XXXVII. Part B8. Beijing 2008. International Society of the Photogrammetry and Remote Sensing Beijing, pp. 1059-1066.
BRK.NRW, 2012. Amtliches Topographisch-Kartographisches Informationssystem (ATKIS®) - Digitale Landschaftsmodelle. Bezirksregierung Köln - Abteilung Geobasis NRW, Bonn, p. 8.
De Wit, A.J.W., Clevers, J.G.P.W., 2004. Efficiency and accuracy of per-field classification for operational crop mapping. International Journal of Remote Sensing 25, 4091-4112.
Ehrmanntraut, E., Nerkamp, K.-H., 2011. Konzeption und Nutzung des automatisiert geführten Liegenschaftskatasters, In: Kummer, K., Frankenberger, J. (Eds.), Das deutsche Vermessungs- und Geoinformationswesen 2012. Wichmann, Berlin, pp. 137-164.
Esch, T., Metz, A., Marconcini, M., Keil, M., 2014. Differentiation of Crop Types and Grassland by Multi-scale Analysis of Seasonal Satellite Data, In: Manakos, I., Braun, M. (Eds.), Land Use and Land Cover Mapping in Europe: Practices & Trends. Springer, Dordrecht Heidelberg, pp. 329-339.
Hazeu, G.W., Schuiling, C., Dorland, v.G.J., Roerink, G.J., Naeff, H.S.D., Smidt, R.A., 2014. Landelijk Grondgebruiksbestand Nederland versie 7 (LGN7): vervaardiging, nauwkeurigheid en gebruik. Alterra Wageningen UR, Wageningen.
Hutchinson, C.F., 1982. Techniques for Combining Landsat and Ancillary Data for Digital Classification Improvement.
Photogrammetric Engineering and Remote Sensing 48,
123-130.
Lucas, R., Rowlands, A., Brown, A., Keyworth, S., Bunting, P., 2007. Rule-based classification of multi-temporal satellite imagery for habitat and agricultural land cover mapping. ISPRS Journal of Photogrammetry and Remote Sensing 62, 165-185.
Lussem, U., Waldhoff, G., 2014. Enhanced land use classification 2014 of the Rur catchment. CRC/TR32 Database (TR32DB), DOI: 10.5880/TR32DB.12.
Merchant, J., Narumalani, S., 2009. Integrating Remote Sensing and Geographic Information Systems, In: Warner, T.A., Nellis, M.D., Foody, G.M. (Eds.), The SAGE handbook of remote sensing. SAGE Publications Ltd., London, pp. 257-269.
Mora, M., Tsendbazar, N.-E., Herold, M., Arino, O., 2014. Global Land Cover Mapping: Current Status and Future Trends, In: Manakos, I., Braun, M. (Eds.), Land Use and Land Cover Mapping in Europe: Practices & Trends. Springer, Dordrecht Heidelberg, pp. 11-30.
Smith, G.M., Fuller, R.M., 2001. An integrated approach to land cover classification: An example in the Island of Jersey. International Journal of Remote Sensing 22, 3123-3142.
Turker, M., Arikan, M., 2005. Sequential masking classification of multi‐temporal Landsat7 ETM+ images for field‐based crop mapping in Karacabey, Turkey. International Journal of Remote Sensing 26, 3813-3830.
Updike, T., Comp, C., 2010. Radiometric Use of WorldView-2 Imagery - Technical Note. DigitalGlobe, Inc.
Waldhoff, G., 2014. Multidaten-Ansatz zur fernerkundungs- und GIS-basierten Erzeugung multitemporaler, disaggregierter Landnutzungsdaten. Methodenentwicklung und Fruchtfolgen-ableitung am Beispiel des Rureinzugsgebiets. Universität zu Köln, Köln, p. 334.
Waldhoff, G., Bareth, G., 2009. GIS- and RS-based land use and land cover analysis: case study Rur-Watershed, Germany, Geoinformatics 2008 and Joint Conference on GIS and Built Environment: Advanced Spatial Data Models and Analyses, Proc. SPIE 7146. SPIE, pp. 714626-714628.
Waldhoff, G., Curdt, C., Hoffmeister, D., Bareth, G., 2012. Analysis of multitemporal and multisensor remote sensing data for crop rotation mapping. ISPRS Annals of the Photogrammetry, Remote Sensing and Spatial Information Sciences I-7, 177-182.