SERVQUAL: An Experimental Approach
Albert Caruana
UNIVERSITY OFMALTAMichael T. Ewing
CURTINUNIVERSITY OFTECHNOLOGY
B. Ramaseshan
CURTINUNIVERSITY OFTECHNOLOGY
Over the past decade, SERVQUAL has emerged as perhaps the most emerged as perhaps the most popular standardized question-naire to measure service quality. Despite numerous criticisms,
popular standardized questionnaire to measure service quality. This study
investigates the usefulness of the three-column format SERVQUAL pro- SERVQUAL continues to appeal to both academics and prac-titioners. Originally developed and tested in the consumer
posed by Parasuraman, Zeithaml and Berry, (Parasuraman, A., Zeithaml,
V. A., Berry, L. L.: Reassessment of expectations as a comparison standard retail environment, more recent replications have extended
in measuring service quality: Implications for further research,Journal of to the industrial market (Westbrook and Peterson, 1998;
Marketing58 (January 1994): 111–124. Using a six-group experimental Young and Varble, 1997), the public sector (Orwig, Pearson,
design, group 1 respondents are administered the revised SERVQUAL and Cochran, 1997), higher education (Anderson, 1995a),
instrument containing minimum expectations, desired expectations, and information systems (Pitt, Watson, and Kavan, 1995), real
performance items. The remaining five groups are given different combina- estate (Nelson and Nelson, 1995), hospitals (Anderson,
tions of the one and/or two column questionnaire. The findings indicate 1995b; Youssef, Nel, and Bovaird, 1995) and the legal
profes-that the perception battery is the salient component, raising new concerns sion (Witt and Stewart, 1996). Moreover, the number of
SERV-regarding the usefulness of the revised expectations scale in service quality QUAL applications outside the United States continues to
measurement. Management implications and future research issues are increase (see for example, Lam and Woo, 1997; Johns and
discussed. J BUSN RES2000. 49.57–65. 2000 Elsevier Science Inc. Tyas, 1997).
All rights reserved Notwithstanding the considerable research that has been
conducted using SERVQUAL, there are still a number of unre-solved issues associated with service quality measurement. These include the need for further research on expectations,
D
efinitions of service quality revolve around the idea as well as elaboration of gap issues and the underlying factor that it is the result of the comparison that customers structure (Carman, 1990; Babakus and Boller, 1992; Bouman make between their expectations about a service and and van der Wiele, 1992; Cronin and Taylor, 1992, 1994; their perception of the way the service has been performed Teas, 1993; Dabholkar, Thorpe, and Rentz, 1996; Gagliano (Lehtinen and Lehtinen, 1982; Lewis and Booms, 1983; Gro¨n- and Hathcote, 1994). In response to these criticisms, Parasura-roos, 1984; Parasuraman, Zeithaml, and Berry, 1985, 1988). man, Zeithaml, and Berry (1994b) developed and investigated In developing their GAPS model, the latter authors employ three alternative SERVQUAL formats. From their empirical generally accepted psychometric procedures (cf., Churchill, research, the authors conclude that “the three-column format 1979) that have resulted in the operationalization of service questionnaire seems most useful” as it can be used for diagnos-quality by the SERVQUAL instrument. SERVQUAL has tic purposes and offers the possibility of using the perception items separately for those interested in maximizing predictive power. Among other improvements, the three-column format Address correspondence to A. Caruana, Department of Marketing, Universityincorporates the recent reconceptualization of the expectations of Malta, Msida MSD06, Malta.
The research for this paper was conducted when Albert Caruana was a side of the GAPS model into desired and minimum expecta-visiting research fellow with the School of Marketing at Curtin Business
School in Perth, Western Australia. tions and the use of nine-point scales. Adjustments to the
Journal of Business Research 49, 57–65 (2000)
2000 Elsevier Science Inc. All rights reserved ISSN 0148-2963/00/$–see front matter
instrument also have been made to accommodate the elimina- scores will be obtained. This can potentially lead to a variance restriction problem for the perception scores as it limits the tion of one of the original items thereby reducing the number
full use of the nine-point scale provided. The second objective of items to 21 and a reordering of the sequence of some of
of the study is to consider whether respondents are influenced the items (Parasuraman, Zeithaml, and Berry, 1994b).
in their reply to performance issues by having just replied to SERVQUAL rests on a gap conceptualization in which
ex-identical items, first with respect to desired and then again pectations play a key role. The expectations side of SERVQUAL
to adequate expectations. has been the subject of considerable debate. Teas (1993)
dis-By using the operationalization of service quality suggested tinguished among “predicted” “attribute importance” and
by Parasuraman, Zeithaml, and Berry (1985, 1988), it has “classical ideal point” concepts of expectations while Boulding
been demonstrated that the five dimensional structure claimed Kalra, Staelin, and Zeithaml (1993) differentiate among “will,”
for SERVQUAL is unstable (cf., Carman 1990; Babakus and “should,” and “ideal” expectations. Zeithaml, Berry, and
Para-Boller, 1992; Cronin and Taylor, 1992; Pitt, Watson, and suraman (1993) suggested a continuum conceptualization of
Kavan, 1995). Detailed theoretical development can take place expectations with desired and minimum expectations at either
only when it is explained how both the service quality con-end and a zone of tolerance in between. Parasuraman,
Zei-struct and its dimensions relate to other conZei-structs and dimen-thaml, and Berry (1994b) made use of this latter
conceptual-sions. This step necessitates a broader consensus on the di-ization of expectations in their three-column format
SERV-mensional structure of the service quality construct. Teas QUAL. They argued strongly in support of the expectations
(1993) argued that a considerable portion of the variance in side of the SERVQUAL instrument claiming that this provides
SERVQUAL is the result of measurement error induced by management with an important diagnostic tool. In their results
respondents’ varying interpretation of the expectations con-from data obtained for the one-column and two-column
for-struct. The use of difference scores has been questioned in mat SERVQUAL, Parasuraman, Zeithaml and Berry (1994b,
the literature (cf., Brown, Churchill, and Peter, 1993). The p. 206) report a logical inconsistency because the mean for
complications resulting from a poor interpretation of expecta-perceived service relative to desired service (MSS) is found to
tions by respondents are perhaps being compounded by an be higher than perceived service relative to adequate service
operationalization of service quality that seeks to represent (MSA). Their preferred three-column format SERVQUAL did
an entire psychological process as simply the subtraction of not reveal such an inconsistency. However, it is quite possible
expectations from perceptions. Therefore, the third objective that this finding is a consequence of the three-column
ques-is to consider whether a perception only conceptualization of tionnaire format, where as part of the administration of the
service quality (cf., Cronin and Taylor, 1992, 1994) provides instrument, minimum and desired expectations are defined
a clearer factor structure than that provided by difference and respondents are required to complete the three columns
scores (Parasuraman, Zeithaml, and Berry, 1985, 1988, for each item simultaneously.
1994b; Parasuraman, Berry, and Zeithaml, 1991). As a result, the question as to whether respondents can
The results of a controlled effort involving 4,662 cases are actually distinguish between desired and minimum
expecta-reported. Implications for methodology and theory develop-tions remains unanswered. There is little empirical evidence
ment are drawn, and suggestions are made for ongoing re-that customers do indeed make these distinctions. In the
search. absence of any empirical evidence the theoretical development
suggested for expectations may be open to further debate. The first objective of this study is to consider empirically
Theoretical Base
whether respondents can distinguish between desired and
adequate expectations. It appears that the theoretical “inspiration” for the service
In the context of service quality, expectations are important quality model (Parasuraman, Zeithaml, and Berry, 1985, and the management of expectations is an important aspect 1988) has been the expectancy/disconfirmation paradigm in in the delivery of service quality (Carman, 1990). It has been process theory (Boulding, Kalra, Staelin, Zeithaml, 1993). This shown empirically that expectations scores have a direct effect framework provides the grounding for the vast majority of on perception scores (Boulding, Kalra, Staelin, and Zeithaml, satisfaction studies and encompasses four constructs: expecta-1993). This in turn questions the use by researchers of differ- tions, performance, disconfirmation, and satisfaction. Discon-ence scores as measures of quality. In the proposed three- firmation arises from discrepancies between prior expectations column format SERVQUAL, respondents must provide per- and perceived actual performance. There are three possibilit-ception scores to the same items that they have just scored ies: zero disconfirmation can result when a product performs for both desired and minimum expectations scores. Although as expected; positive disconfirmation with resultant satisfac-it is possible for respondents to provide perception scores that tion can occur when the product performs better than ex-are below minimum expectations, it is likely that the prior pected; and negative disconfirmation when the product per-scores allocated to expectations will anchor the either-end forms below expectations and dissatisfaction sets in (Oliver, points on the desired-minimum expectations continuum de- 1980; 1981; Churchill and Surprenant, 1982; Oliver and
In the service quality model by Parasuramanet al.(1985;
SERVQUAL Gap Issues
1988; 1991; 1994a; 1994b) the two key concepts of customerPrevious studies have shown that respondents tend to give perceptions and expectations are compared. In the original
high expectations scores that often result in a variance restric-SERVQUAL instrument, expectations referred to what
cus-tion problem (cf., Parasuraman, Berry, and Zeithaml, 1991; tomers could anticipate from excellent firms. The resultant
Babakus and Boller, 1992; Brown, Churchill, and Peter, 1993). ‘gap’ represents a measure of the level of service quality, the
To overcome this, Parasuraman, Zeithaml, and Berry (1994b) narrower the gap the higher the level of service received.
have moved to nine-point rather than seven-point scales in their three-column format SERVQUAL. It is possible that de-creasing P-E (gap) scores do not necessarily reflect
continu-Conceptualization and
ously increasing levels of perceived service quality; and given
Operationalization of Expectations
a seven-point scale, there are six ways in which the samedifference score can be obtained (Teas, 1993). Parasuraman, Recent literature acknowledges the existence of multiple
Zeithaml, and Berry (1994b) have continued to argue about classes of expectations (Forbes, Tse, and Taylor, 1986; Wilton
the importance of measuring expectations, suggesting that a and Nicosia, 1986; Tse and Wilton, 1988; Boulding, Kalra,
high score on the performance items may not be high enough Staelin, and Zeithaml, 1993; Zeithaml, Berry, and
Parasura-and could “lead to inaccurate assessment of perceived service man, 1993). In the subjective disconfirmation approach to
quality”. However, it is quite possible that in many cases customer satisfaction, expectations reflect anticipated
perfor-customers do not have any real specific expectations about a mance or predictions (Miller, 1977; Gilly, Cron, and Barry,
service and making use of the expectation batteries of ques-1983; Prakash, 1984; Tse and Wilton, 1988). The service
tions results in specific expectation scores for the various items quality literature defines expectations as “desires or wants of
that might not in fact exist. Respondents can have only a customers, i.e., what they feel a service provider should offer
general overall expectation that in turn results in a halo effect rather than would offer” (Parasuraman, Zeithaml, and Berry,
on the more specific expectations. It also has been demon-1988, p. 17). They are seen as normative standards of future
strated that the perception scores on their own “explain more wants that are “similar to the ideal standard in confirmation/
of the variation in service quality” than gap measures (Babakus disconfirmation literature” (Zeithaml, Berry, and Parasura- and Boller, 1992; Cronin and Taylor, 1992, 1994; Parasura-man, 1991) and are more or less fixed. Teas (1993) argued man, Zeithaml, and Berry, 1994b). The wisdom of factor that the original definition used in the service quality literature analyzing gap scores has been questioned (Brown, Churchill, is “vague” and can have several meanings. Indeed, following and Peter, 1993). However, Parasuraman, Zeithaml, and Berry the results of a number of replication studies, Parasuraman, (1994a) argued that the disconfirmation model of service qual-Berry, and Zeithaml (1991) have reassessed the expectations ity provides managers with a more practical diagnosis of the side of their model and have respecified expectations asdesired service quality problems.
wants—the extent to which customers believe a particular attribute is “essential” for an excellent service company. More
SERVQUAL Dimensions
recently, the developers of SERVQUAL have further elaborated expectations distinguishing desired from minimum
expecta-Parasuraman, Zeithaml, and Berry (1988) originally claimed tions. Minimum service level expectations are described as
structure posited”. Babakus and Boller (1992) have suggested dents’ overall perceptions of service quality provided by the that the number of service quality dimensions is dependent tertiary institution together with four classificatory variables on the service being offered. Using the revised SERVQUAL also were included. The final questionnaire was pilot tested scale, Parasuraman, Zeithaml, and Berry (1994b) moved away and found to be satisfactory. Different combinations of the from their original five dimensions to three: reliability, tangi- instrument were administered to six groups. The sampling bles, while “responsiveness, assurance and empathy meld into frame consisted of the entire database of 4,662 full-time
stu-a single fstu-actor”. dents at a business school. Demographically this represented
This review indicates that the conceptualization for service a homogenous population with few differences on most vari-quality with an expectation and a perception component may ables. A student population was used as SERVQUAL purports be flawed. The theoretical refinement to the expectation com- to be a general measure of service quality. Furthermore, SERV-ponent in terms of a desired and a minimum expectation may QUAL previously has been applied in the tertiary education not be meaningful to customers. It may be that it is the sector (cf., Rigotti and Pitt, 1992; Boulding, Kalra, Staelin, perceptions items that have the salient impact on the factor and Zeithaml, 1993; Ford, Joseph, and Joseph, 1993), and
structure that results. there is ongoing support for its continued use in educational
institutions (Kotler and Fox, 1995).
Each of the 777 subjects in the six groups was randomly
The Study
assigned to a treatment. A covering letter together with aquestionnaire and a reply paid envelope was mailed to all The study utilizes the three-column format SERVQUAL to
subjects. The first group received the entire three-column determine (1) whether respondents can distinguish between
SERVQUAL instrument consisting of both desired and mini-desired expectations (DE) and minimum expectations (ME);
mum expectations as well as performance columns. Respon-(2) the impact of measuring expectations prior to the
measure-dents in the second and third groups were administered ques-ment of perceptions; and; (3) whether perceptions are
de-tionnaires containing only two of the three columns. The termining the underlying factor structure. The three-column
second group did not receive the minimum expectations col-format SERVQUAL instrument (Parasuraman, Zeithaml, and
umn while the third group did not receive the desired expecta-Berry, 1994b) was used in the study to measure service quality
in tertiary institutions. A nine-point item measuring respon- tions column. The fourth, fifth, and sixth groups were sent
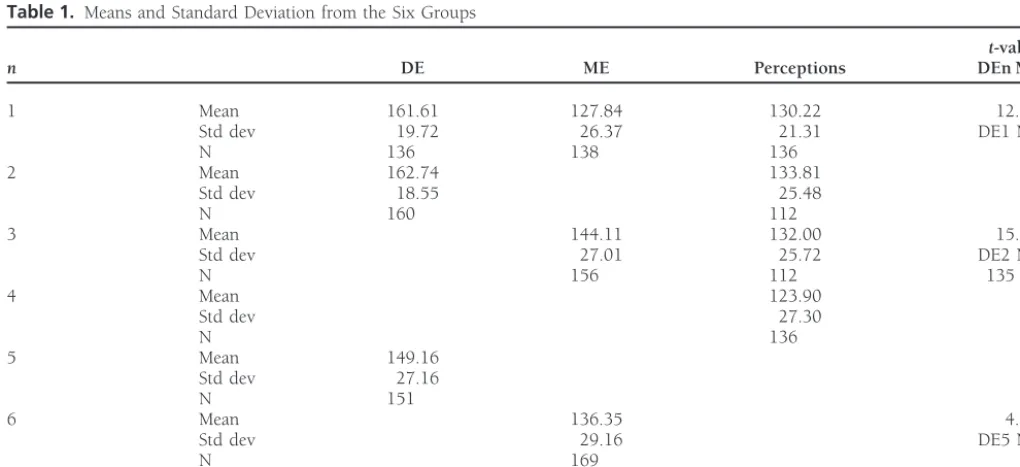
Table 1. Means and Standard Deviation from the Six Groups
t-value
n DE ME Perceptions DEn MEn
1 Mean 161.61 127.84 130.22 12.02a
Std dev 19.72 26.37 21.31 DE1 ME1
N 136 138 136
2 Mean 162.74 133.81
Std dev 18.55 25.48
N 160 112
3 Mean 144.11 132.00 15.11a
Std dev 27.01 25.72 DE2 ME3
N 156 112 135
4 Mean 123.90
Std dev 27.30
N 136
5 Mean 149.16
Std dev 27.16
N 151
6 Mean 136.35 4.05a
Std dev 29.16 DE5 ME6
N 169
ANOVA F 17.49a 12.69a 3.79*
(i) DEn MEn refers to thet-tests undertaken between the means for desired expectations (DE) and minimum expectations (ME) in the same or different groups (n). Since in the first test the means for DE and ME both come from the same group, a pairedt-test was used. Independentt-tests were computed between the means for DE and ME in groups 2/3 and 5/6, respectively. Expectations data is often not normally distributed, and therefore Mann Whitney U tests also were computed. These indicate no change in the significance of the results reported. The means obtained from the six groups for each of DE (three means); ME (three means) and Perceptions (four means) were tested “vertically” for significant differences by using ANOVAs.nis less than the response rate reported because a number of respondents made use of the “no opinion” option for one or more of the items when replying.
ap
,0.001.
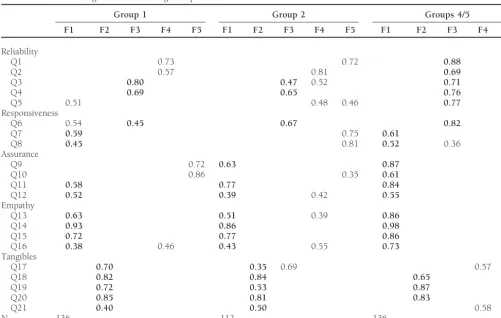
Table 2. Factor Loading Matrices following Oblique Rotation of Five Factor Solutions for MSS Scores
Group 1 Group 2 Groups 4/5
F1 F2 F3 F4 F5 F1 F2 F3 F4 F5 F1 F2 F3 F4 F5
Reliability
Q1 0.73 0.72 0.88
Q2 0.57 0.81 0.69
Q3 0.80 0.47 0.52 0.71
Q4 0.69 0.65 0.76
Q5 0.51 0.48 0.46 0.77
Responsiveness
Q6 0.54 0.45 0.67 0.82
Q7 0.59 0.75 0.61
Q8 0.45 0.81 0.52 0.36
Assurance
Q9 0.72 0.63 0.87
Q10 0.86 0.35 0.61
Q11 0.58 0.77 0.84
Q12 0.52 0.39 0.42 0.55
Empathy
Q13 0.63 0.51 0.39 0.86
Q14 0.93 0.86 0.98
Q15 0.72 0.77 0.86
Q16 0.38 0.46 0.43 0.55 0.73
Tangibles
Q17 0.70 0.35 0.69 0.57
Q18 0.82 0.84 0.65
Q19 0.72 0.53 0.87
Q20 0.85 0.81 0.83
Q21 0.40 0.50 0.58 0.43
N 136 112 136
Loadings less than 0.35 have been omitted. Boldface lettering indicates loading on three rather than five factors.
questionnaires consisting only of one column—the percep- A comparison of means for desired expectations and per-tions, desired or minimum expectaper-tions, respectively (see de- ceptions between respondents in groups 1 and 2 indicate that tails in Table 1). Overall 1,122 valid replies were received the means for desired expectations (161.61 and 162.74) and representing a response rate of 24.5%. The response rate for perceptions (130.22 and 133.81) are in fact not influenced each of the six groups is quite similar and varied from a by not asking minimum expectations. However, a comparison minimum of 22.1% in group 3 to a maximum of 27.3% in of means for minimum expectations and perceptions between group 4 indicating that the different formats used do not groups 1 and 3 shows that minimum expectations scores appear to have had an influence on the response rate. (127.84 vs. 144.11) are significantly higher when desired expectations are not asked while perceptions remain
compara-Descriptive Statistics and Comparison of
ble (130.22 vs. 132.00).When perceptions and desired expectations are collected
Means for the Six Groups
separately (groups 4 and 5) and not in conjunction with one Table 1 shows the mean scores for desired expectations,
mini-or mmini-ore other variables (groups 1, 2, and 3), results show mum expectations and perceptions. The results indicate that
that the means are significantly lower for both perceptions respondents in group 1 are able to distinguish between desired
(123.90 vs. 132.00, 133.81, and 130.22) and desired expecta-expectations (161.61) and minimum expecta-expectations (127.84)
tions (149.16 vs. 162.74 and 161.61). When minimum expec-with the latter getting a significantly lower mean. A paired
tations are collected separately (group 6), the mean obtained samplet-test confirms a statistically significant difference. A
is also lower than that in group 3 (136.35 vs. 144.11), where similar situation exists based on the results of the replies
minimum expectations are collected together with percep-received from respondents in groups 2 and 3 as well as in
tions. However, in both groups 3 and 6 the means obtained groups 5 and 6, where it also can be seen that the mean scores
for minimum expectations (136.35 and 144.11) are not lower for desired expectations (162.74 and 149.16) are higher than
than those for perceptions means from any of the groups that for minimum expectations (144.11 and 136.35),
respec-(123.90, 132.00, 133.81, and 130.22). Only when minimum tively. Again, independent samplet-tests confirm a statistically
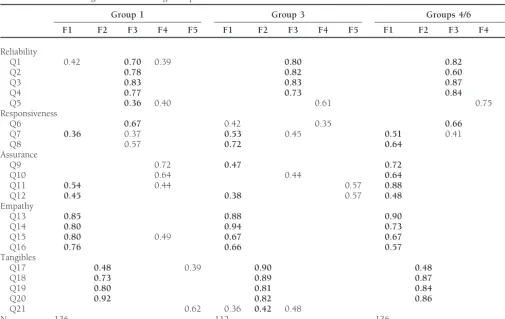
de-Table 3. Factor Loading Matrices following Oblique Rotation of Five Factor Solutions for MSA Scores
Group 1 Group 3 Groups 4/6
F1 F2 F3 F4 F5 F1 F2 F3 F4 F5 F1 F2 F3 F4 F5
Reliability
Q1 0.42 0.70 0.39 0.80 0.82
Q2 0.78 0.82 0.60
Q3 0.83 0.83 0.87
Q4 0.77 0.73 0.84
Q5 0.36 0.40 0.61 0.75
Responsiveness
Q6 0.67 0.42 0.35 0.66
Q7 0.36 0.37 0.53 0.45 0.51 0.41
Q8 0.57 0.72 0.64
Assurance
Q9 0.72 0.47 0.72
Q10 0.64 0.44 0.64
Q11 0.54 0.44 0.57 0.88
Q12 0.45 0.38 0.57 0.48
Empathy
Q13 0.85 0.88 0.90
Q14 0.80 0.94 0.73
Q15 0.80 0.49 0.67 0.67
Q16 0.76 0.66 0.57
Tangibles
Q17 0.48 0.39 0.90 0.48
Q18 0.73 0.89 0.87
Q19 0.80 0.81 0.84
Q20 0.92 0.82 0.86
Q21 0.62 0.36 0.42 0.48 0.80
N 136 112 136
Loadings less than 0.35 have been omitted. Boldface lettering indicates loading on three rather than five factors.
sired expectations, as in group 1, is the mean for minimum contrary to the findings by Parasuraman, Zeithaml, and Berry (1994b, p. 212, Table 4) the tangible items in this study have expectations lower than that for perceptions (127.84 vs.
130.22). The variance in the perception scores is lowest for tended to load on the tangibles dimension without exhibiting splitting onto other factors. Our results show that item 6 loads group 1. Finally, one way ANOVA’s for the means of the same
variables from the different groups provide a significant F that on the reliability dimension in the factor analysis of MSA scores and exhibits mixed loadings on both the responsiveness is the lowest for the perception means.
and reliability dimensions in the case of MSS scores (see Tables 2 and 3). Comparisons to Parasuraman, Zeithaml and Berry
Factor Structure
(1994b: 212, Table 4) indicate that this is in line with their results where item 6 exhibits mixed, but higher, loadings on Although numerous writers have considered the number of
factors that constitute service quality, the original researchers the reliability than the responsiveness dimension.
The factor loadings obtained for the MSS scores that result have until recently consistently provided empirical support for
the existence of five factors (Parasuraman, Berry, and Zeithaml, from group 2 (only desired expectations and perceptions col-lected, in Table 2) exhibit a loading pattern that is similar to 1991; Parasuraman, Zeithaml, and Berry, 1991). However,
their revised 21-item, three-column SERVQUAL instrument that obtained for group 1. Using the MSA scores, we see that a similar factor loading pattern results for group 3 (only indicates the presence of three factors with the five reliability
items and five tangible items loading separately on two factors minimum expectations and perceptions collected, in Table 2). Finally, when the MSS and MSA scores are obtained from while the 11 remaining items load on a third distinct factor
(Parasuraman, Zeithaml, and Berry, 1994b, p. 211). The data different groups (4/5 and 5/6), the factor structure is again surprisingly similar to that obtained from group 1. Indeed, from group 1 in this study for the MSS (Measure of Service
Superiority) and MSA (Measure of Service Adequacy) scores the loading pattern resulting from the factor analysis of the MSS scores of group 4/5 (Table 2) and of the MSA scores of provides very similar loading patterns (Tables 2 and 3)
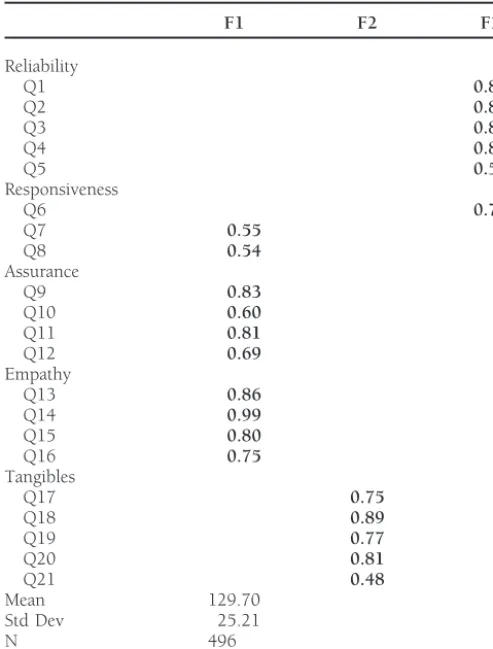
Table 4. Factor Loading Matrices following Oblique Rotation Eigen-
Conclusions and Implications
values Greater Than 1 Solution for Perceptions Items from All GroupsFor the past decade, the importance of measuring and
manag-F1 F2 F3
ing service quality has been widely recognized by both
aca-Reliability demics and practitioners. Not surprisingly, service quality has
Q1 0.81 been the most researched area in the marketing sciences (Fisk,
Q2 0.81 Brown. and Bitner, 1993). In this regard, SERVQUAL has
Q3 0.83
emerged as the most popular generic measure of service
qual-Q4 0.86
ity. In its original form, the instrument measured ideal
expec-Q5 0.53
Responsiveness tations and perceptions. In response to certain criticisms
re-Q6 0.70 garding the measurement of expectations, a refined and more
Q7 0.55 sensitive measure of expectations covering minimum and
de-Q8 0.54
sired levels of service quality has been proposed. This study
Assurance
set out to investigate the usefulness of the revised SERVQUAL
Q9 0.83
Q10 0.60 instrument.
Q11 0.81 The results from the analysis of means in Table 1 offers
Q12 0.69
limited support for the ability of respondents to distinguish
Empathy
between minimum and desired expectations. It would appear
Q13 0.86
that respondents find it difficult to visualize real difference
Q14 0.99
Q15 0.80 between desired and minimum expectations, and the results
Q16 0.75 obtained seem only to indicate the allocation of relatively
Tangibles
lower scores to minimum expectations when this is asked in
Q17 0.75
conjunction with desired expectations. Indeed, the collection
Q18 0.89
Q19 0.77 of data separately for each of the three constructs results in
Q20 0.81 different means from when two or more constructs are
col-Q21 0.48 lected together. The results also confirm that measuring
expec-Mean 129.70
tations prior to the measurement of perceptions does have
Std Dev 25.21
an effect on the latter. When perceptions are measured in
N 496
conjunction with both desired and minimum expectations,
Loadings less than 0.35 have been omitted. Boldface lettering indicates loading on three the variance of the perception scores is also lower. Collectively
factors.
these two findings raise new questions as to the diagnostic usefulness resulting from the simultaneous collection of expec-tations and perception scores. It would appear that collection number of items loading outside the three factors. This result
of data about expectations and perceptions is best done sepa-is almost identical to that reported by Parasuraman, Zeithaml,
rately. The former can be conducted on a less frequent basis and Berry (1994b, p. 212, Table 2). However in our case, the
than the latter. The findings also confirm that asking desired perceptions and expectation data were collected separately
expectations in conjunction with minimum expectations and not simultaneously as advocated in the three-column format.
perceptions (groups 1 and 2) appears to result in higher It has been argued in the literature that it is the perception
desired expectation scores than when these are asked sepa-items that truly capture the service quality construct (cf.,
rately (group 5). This would seem to suggest that the distortion Cronin and Taylor 1992, 1994; Brown, Churchill, and Peter,
in the loading patterns from the factor analysis is principally 1993). In this experiment, perception items have been
col-due to the effect the expectations items have on the resultant lected from groups 1, 2, 3, and 4. Data on perceptions for
difference scores. These in turn manifest themselves in differ-groups 1, 2, and 3 were collected simultaneously with either
ent loading patterns, leading us to question which set of desired and/or minimum expectations. The results in Table
dimensions represent the “right” factor structure. 1 indicate a small but significant difference between the mean
The study contributes to the extant knowledge about ser-scores of groups 1, 2, and 3, as against those of group 4,
vice quality. The findings from this research shed new light which involved the collection of perception items only. As a
on the expectations measurement debate in service quality. result of this, the factor structure for cases from groups 1, 2,
They question the usefulness of the expectations side of SERV-and 3 was first investigated SERV-and then followed by that for
QUAL and indicate that the addition of minimum expectations cases in group 4. Absolutely no difference resulted in the
appear to have added little that is of incremental value to loading pattern from the two-factor analyses. Cases were
com-the measurement of service quality. Additional research is bined and the resultant factor analysis for all the perception
necessary and the experimental design needs to be repeated items is shown in Table 4. Here the clearest three-factor
gen-Cronin, J. J., and Taylor, S. A.: SERVPERF versus SERVQUAL:
Recon-eralizability of the findings. More theory-based development
ciling Performance Based and Perception Based Minus
Expecta-also is required so that a clearer understanding of expectations
tion Measurements of Service Quality.Journal of Marketing 58
can be obtained. It may be that customers’ expectations about (January 1994): 125–131. services are often passive and ill defined. Therefore, direct
Dabholkar, P. A., Thorpe, D. I., and Rentz, J. O.: A Measure of
measures may elicit expectations that otherwise might not Service Quality for Retail Stores: Scale Development and Valida-operate in customers’ cognitive evaluations. This has implica- tion.Journal of the Academy of Marketing Science24 (Winter 1996):
3–16.
tions on theory development and would suggest more research
to investigate whether expectations have an impact on percep- Fisk, R. P., Brown, S. W., and Bitner, M. J.: Tracking the Evolution of the Services Marketing Literature.Journal of Retailing69 (Spring
tions as suggested by a number of authors (cf., Boulding,
1993): 61–103.
Kalra, Staelin, Zeithaml, 1993; Anderson, Fornell, and
Leh-Forbes, J. D., Tse, D. K., and Taylor, S.: Toward a Model of Consumer
mann, 1994). It may be that in measuring service quality, it
Post-Choice Response Behavior’, in Advances in Consumer
Re-is more appropriate to adopt an attitudinal approach that Re-is
search, R. L. Lutz, ed., Association for Consumer Research,
Val-operationalized within the perceptions side of SERVQUAL
dosta, GA, 13, 1986, pp. 658–661.
rather than the parallel operationalization that SERVQUAL
Ford, J. B., Joseph, M, and Joseph, B.: Service Quality in Higher
suggests. Education: A Comparison of Universities in the United States and
New Zealand using SERVQUAL, inEnhancing Knowledge Develop-The authors sincerely thank the two anonymous reviewers for their many ment in Marketing, AMA Educators Proceedings Summer, 1993, helpful comments and suggestions. pp. 75–81.
Gagliano, K. B., and Hathcote, J.: Customer Expectations and Percep-tions of Service Quality in Apparel Retailing.Journal of Services
References
Marketing8 (1994): 60–69.Anderson, E.: High Tech v. High Touch: A Case Study of TQM
Gilly, M. C., Cron, W. L., and Barry, T .E.: The Expectation-Perfor-Implementation in Higher Education.Managing Service Quality5
mance Comparison Process: An Investigation of Expectation (1995a): 48–56.
Types, inInternational Fare in Consumer Satisfaction and Complain-Anderson, E.: Measuring Service Quality at a University Health Clinic. ing Behavior, R. L. Day and H. K. Hunt, eds., School of Business,
International Journal of Health Care Quality Assurance8 (1995b): Indiana University, Bloomington, IN. 1983, pp. 10–16. 32–37.
Gro¨nroos, C.: A Service Quality Model and its Market Implications. Anderson, E. W., Fornell, C., and Lehmann, D. R.: Customer Satisfac- European Journal of Marketing18 (1984): 36–44.
tion, Market Share, and Profitability: Findings from Sweden.
Jour-Johns, N., and Tyas, P.: Customer Perceptions of Service Operations: nal of Marketing58 (July 1994): 53–66.
Gestalt, Incident or Mythology? Service Industries Journal 17 Babakus, E., and Boller, G. W.: An Empirical Assessment of the (1997): 474–488.
SERVQUAL Scale. Journal of Business Research 24 (May 1992):
Kotler, P., and Fox, K. A.:Strategic Marketing for Educational Institu-253–268.
tions, 2nd edition, Prentice Hall, Englewood Cliffs, NJ. 1995. Berry, L. L., and Parasuraman, A.: Marketing Services—Competing
Lam, S. S. K., and Woo, K. S.: Measuring Service Quality: A Test-through QualityFree Press, New York. 1991.
Retest Reliability Investigation of SERVQUAL.Journal of the Market Boulding, W., Kalra, A., Staelin, R., and Zeithaml, V.: A Dynamic Research Society39 (1997): 381–396.
Process Model of Service Quality: From Expectations to Behavioral
Lehtinen, U., and Lehtinen, J. R.:Service Quality—A Study of Dimen-Intentions. Journal of Marketing Research 30 (February 1993):
sions, Unpublished working paper, Service Management Institute, 7–27.
Helsinki. 1982, pp. 439–460. Bouman, M., and van der Wiele, T.: Measuring Service Quality in
Lewis, R. C., and Booms, B. H.: The marketing Aspects of Service the Car Service Industry: Building and Testing an Instrument.
Quality, inEmerging Perspectives in Service MarketingL. L. Berry, International Journal of Service Industry Management 3 (1992):
G. Shostasck, and G. Upah, eds., American Marketing Association, 4–16.
Chicago. 1983, pp. 99–107. Brown, T. J., Churchill, G. A. Jr., and Peter, J. P.: Improving the
Miller, J. A.: Studying Satisfaction, Modifying Models, Eliciting Ex-Measurement of Service Quality.Journal of Retailing68(1) (Spring
pectations, Posting Problems, and Making Meaningful Measure-1993): 127–139.
ments, inConceptualization and Measurement of Consumer Satisfac-Carman, J. M.: Consumer Perceptions of Service Quality: An
Assess-tion and DissatisfacAssess-tion, H. K. Hunt, ed., School of Business, ment of the SERVQUAL Dimensions. Journal of Retailing 66
Indiana University, Bloomington. 1977, pp. 2–6. (Spring 1990): 33–55.
Nelson, S. L., and Nelson, T. R.: RESERV: An Instrument for Measur-Churchill, G. A. Jr.: A Paradigm for Developing Better Measures of
ing Real Estate Brokerage Service Quality.Journal of Real Estate Marketing Constructs.Journal of Marketing ResearchXVI (February
Research10 (1995): 99–113. 1979): 64–73.
Oliver, R. L.: A Cognitive Model of the Antecedents and Conse-Churchill, G. A. Jr., and Surprenant, C.: An Investigation into the
quences of Satisfaction Decisions.Journal of Marketing Research Determinants of Customer Satisfaction.Journal of Market Research
XVII (November 1980): 460–469. XIX (November 1982): 491–504.
Oliver, R. L., and DeSarbo, W. S.: Response Determinants in Satisfac-Cronin, J. J., and Taylor, S. A.: Measuring Service Quality: A
Re-tion Judgments.Journal of Consumer Research14 (1988): 495–507. Examination and Extension.Journal of Marketing56 (July 1992):
into the Validity of SERVQUAL in the Public Sector.Public Admin- Perception of Quality. Journal of Marketing57 (October 1993): 18–34.
istration Quarterly21 (1997): 54–68.
Parasuraman, A., Berry, L. L., and Zeithaml, V. A.: Refinement and Tse, D. K., and Wilton, P. C.: Models of Consumer Satisfaction Formation: An Extension.Journal of Marketing ResearchXVII (No-Reassessment of the SERVQUAL Scale.Journal of Retailing 67
(1991): 420–450. vember 1988): 460–469.
Westbrook, K. W., and Peterson, R. M.: Business-to-Business Selling Parasuraman, A., Zeithaml, V. A., and Berry, L. L.: A Conceptual
Model of Service Quality and its Implication for Future Research. Determinants of Quality. Industrial Marketing Management 27 (1998): 51–62.
Journal of Marketing49 (April 1985): 41–50.
Parasuraman, A., Zeithaml, V. A., and Berry, L. L.: SERVQUAL: A Wilton, P., and Nicosia, F. M.: Emerging Paradigms for the Study of Consumer Satisfaction.European Research14 (January 1986): Multiple-Item Scale for Measuring Consumer Perceptions of
Ser-vice Quality.Journal of Retailing64 (Spring 1988): 12–40. 4–11.
Witt, C. A., and Stewart, H. M.: Solicitors and Customer Care.Service Parasuraman, A., Zeithaml, V. A., and Berry, L. L.: Reassessment of
Expectations as a Comparison Standard in Measuring Service Industries Journal16 (1996): 21–34.
Quality: Implications for Further Research.Journal of Marketing Yi, Y.: A Critical Review of Consumer Satisfaction, in Review of 58 (January 1994a): 111–124. Marketing, V. A. Zeithaml, ed., American Marketing Association,
Chicago. 1990, pp. 68–123. Parasuraman, A., Zeithaml, V. A., and Berry, L. L.: Alternative Scales
for Measuring Service Quality: A Comparative Assessment Based Young, J. A., and Varble, D. L.: Purchasing’s Performance as Seen on Psychometric and Diagnostic Criteria.Journal of Retailing70 by its Internal Customers: A Study in a Service Organization. (1994b): 201–230. International Journal of Purchasing and Materials Management 33
(1997): 36–41. Pitt, L. F., Watson, R. T., and Kavan, C. B.: Service Quality: A
Measure of Information Systems Effectiveness.MIS Quarterly19 Youssef, F., Nel, D., and Bovaird, T.: Service Quality in NHS Hospi-(1995): 173–187. tals.Journal of Management in Medicine9 (1995): 66–74. Prakash, V.: Validity and Reliability of the Confirmation of Expecta- Zeithaml, V. A., Berry, L. L., and Parasuraman, A.: An Empirical
tions Paradigm as a Determinant of Consumer Satisfaction.Journal Examination of Relationships in an Extended Service Quality Model, of the Academy of Marketing Science12 (Fall 1984): 63–76. Marketing Science Institute, Working paper No. 90-122,
Cam-bridge, MA. 1991. Rigotti, S., and Pitt, L. F.: SERVQUAL as a Measuring Instrument
for Service Provider Gaps in Business Schools.Marketing Research Zeithaml, V. A., Berry, L. L., and Parasuraman, A.: The Nature and News15 (1992): 9–17. Determinants of Customer Expectations of Service.Journal of the