www.elsevier.com/locate/eja
Turnover and fate of
15
N-labelled cattle slurry ammonium-N
applied in the autumn to winter wheat
L.S. Jensen*, I.S. Pedersen, T.B. Hansen, N.E. Nielsen
Plant Nutrition and Soil Fertility Laboratory, Department of Agricultural Sciences, The Royal Veterinary and Agricultural University, Thorvaldsensvej 40, DK-1871 Frederiksberg C, Denmark
Accepted 20 August 1999
Abstract
The fate of15NH
4-N labelled cattle slurry applied before sowing in September of a winter wheat crop was studied on a loamy sand soil. The aim was to quantify immobilization of slurry NH
4-N into microbial biomass, the speed at which nitrate derived from the slurry NH
4-N was transported down the soil profile, and the utilization of slurry NH
4-N by the winter wheat crop. Cattle slurry was applied at a rate corresponding to 75 kg NH4-N ha−1, with very little loss by volatilization (<4%) due to rapid incorporation by ploughing. The slurry amendment resulted in a doubling of soil surface CO
2 flux, an index of microbial activity, over non-amended soil within the first c. 2 weeks, but ceased again after c. 4 weeks, due to depletion of the easily degradable substances, e.g. volatile fatty acids, in the slurry. Nitrification of the applied NH
4-N was fast and complete by 3 weeks from application, and at this time, the maximum immobilization of slurry NH
4-N into the microbial biomass (23%of applied15NH4-N ) was also observed, although no significant increase in total microbial biomass was observed. Rapid turnover of the microbial biomass quickly diluted the assimilated15N, with only 6% of applied 15NH
4-N remaining in the microbial biomass by next spring. Downwards transport of nitrate was rapid in spite of lower than normal precipitation, and slurry-derived 15NO
3-N appeared in ceramic suction cups installed at 60 cm depth already 2 months after slurry application. Due to the unusually low winter precipitation in the experimental year, wheat yields were high, and the recovery of N in above-ground plant biomass derived from slurry NH
4-N at harvest reached 32%. An additional 45%of the applied slurry NH
4-N could be found in the soil to a depth of 100 cm (mostly in organic form in the plough layer), indicating that 23%had been lost by leaching or in gaseous form. It was concluded that although significant immobilization of slurry NH
4-N did occur, this was not sufficient to prevent leaching of slurry-derived N over the winter and that the relatively high recovery of slurry-derived N in the wheat crop was due partly to lower than normal winter percolation and partly to a relatively high rooting depth on this particular site. © 2000 Elsevier Science B.V. All rights reserved.
Keywords:Cattle slurry;15N; N immobilization; N leaching; N-use efficiency; Soil microbial biomass N
* Corresponding author. Tel.:+45-3528-3470; fax:+45-3528-3460. E-mail address:[email protected] (L.S. Jensen)
1. Introduction of adverse effects of spring slurry application on soil fertility is thus emerging, and in this context, the complete ban on autumn slurry application for With the intensification of livestock production
in many Western European countries, over the last nearly all arable crops has been questioned. It is well known, however, that autumn applica-couple of decades, much attention has been
focused on its eventual adverse environmental tion of fertilizer N results in poor crop recovery of the applied N (Powlson et al., 1986), and it effects. Intensive livestock production commonly
leads to a high excess of nitrogen (N ) in animal may be expected that autumn application of liquid animal manures, with the major proportion of N manures, which is at great risk of being lost, either
through gaseous losses, i.e. ammonia volatilization in mineral form, would yield similar low recoveries (Jackson and Smith, 1997). However, as animal or denitrification, or through leaching. Kirchmann
et al. (1998) stated that in Western Europe, an slurries usually contain a fair proportion of easily degradable substances, such as volatile fatty acids average of 30%of the N excreted by farm animals
is released to the atmosphere as ammonia, causing (Sørensen, 1998), immobilization of slurry ammo-nium N normally occurs due to the increased economic losses and problems with acidification
and eutrophication in surrounding natural, biological activity after application ( Kirchmann and Lundvall, 1993). Where this may be seen as a N-limited ecosystems. Many studies have also
shown an increased risk of nitrate leaching from major disadvantage by spring application (crop roots and microorganisms compete for the same soils receiving high levels of animal manure (e.g.
Nielsen and Jensen, 1990; Beckwith et al., 1998). mineral N ), it may pose a potential advantage by autumn application if the immobilization is large For this reason, legislative regulations have been
introduced in many European countries to control enough for retaining a significant proportion of the slurry ammonium-N and provided that the these adverse environmental effects, and the EU
has implemented an upper limit for the amount of immobilized N is released again the following cropping season.
total N in animal manure that may be applied per
hectare annually. The appropriate methodology for studying the
fate of animal manure N in the soil–plant cropping In Denmark, current legislation requires
farm-ers to utilize animal manure total N with an system, is to label the manure with 15N. Several studies have been published where either the faeces efficiency of 45–55%in the first year after
applica-tion and 10%in the second year. This encourages or the urine fraction (e.g. Sørensen and Jensen, 1996, 1998; Thomsen et al., 1997), as well as a farmers to use more efficient application techniques
with a lower potential for ammonia volatilization synthetic urine (Clough et al., 1998) have been 15N labelled. However, if the aim is to only trace losses (Sommer et al., 1997). Furthermore,
spread-ing of liquid animal manure, e.g. slurry and urine, the ammonium-N fraction of an animal manure, the labelling can be carried out by simply spicing is generally not allowed in the autumn, to prevent
nitrate losses caused by leaching of nitrified slurry it with a small quantity of highly 15N enriched ammonium-N. However, only a few published ammonium-N. These regulations have forced
Danish farmers to apply more than 80% of the studies have applied this methodology ( Trehan and Wild, 1993; Paul and Beauchamp, 1995; Carey liquid manure in the spring season, either before
sowing of spring crops or with trail hose techniques et al., 1997; Morvan et al., 1997).
Our objectives were therefore to study: in between the rows of growing crops (Sommer
et al., 1997). In the cool and humid Danish climate, 1. the turnover and fate of autumn applied slurry ammonium-15N in the soil with a winter wheat this has put a relatively heavy workload on many
livestock farms during a few weeks in the spring. crop over 1 year following application;
2. how rapidly nitrified slurry ammonium-15N is Farmers are therefore often tempted to apply
slurry slightly too early, when the soils are still transported down the soil profile by percolation to estimate the risk of leaching; and
wet and prone to soil compaction by the heavy
immobilization of the slurry ammonium-15N appropriate plots (microplots for 15N were cov-ered) and incorporated immediately by ploughing does occur to such a degree that it may protect
it from leaching. to a maximum depth of 20 cm, followed by
seed-bed preparation. Winter wheat (Triticum aestivum
L.) was sown the day after at a target density of 350 plants m−2. The field received a herbicide
2. Materials and methods
application in the autumn and two fungicide treat-ments in the following summer.
2.1. Site and soil
A framed microplot (1 m×1 m, 20 cm depth) was established in each of the plots receiving cattle The experiment was conducted on a loamy sand
soil located at a private farm (Nordkær) at slurry, and 15N-labelled cattle slurry was applied on 22 September 1995 at the same N rate as that Nørhalne, Denmark (57/10∞N, 9/50∞E ). Basic
top-soil (0–25 cm) properties were 6.5%clay (<2mm), applied in the surrounding main plot 2 days earlier. The cattle slurry was spiced with a small quantity 12.5% silt (2–20mm), 67.9% fine sand (20– 15N. The 15N-labelled cattle slurry was incorpo-maintained as arable land for a long period (more
than 75 years) and during the last 25 years was rated into the soil in the microplots by hand cultivation, simulating ploughing and to the same cropped with cereals or fodder beets; however,
peas were grown in the year preceding the experi- depth as in the surrounding main plot.
Two ceramic suction cups were installed c. mental year.
60 cm below each microplot and 30 cm apart. The ceramic cups (25 mm diameter) were mounted on
2.2. Experimental design
1 m long plastic tubes and inserted from outside the microplot at an angle inclined c. 45°to the soil The study was conducted in a randomized field
experiment (four replicates in a block design) with surface (see Nielsen and Jensen, 1990). Ceramic suction cups were also installed in the main plots three factors: (1) with or without cattle slurry
applied either in autumn or spring at a rates with and without cattle slurry. A screw auger slightly larger than the diameter of the ceramic corresponding to 75 kg NH
4-N ha−1, (2) with or
without fertilizer N applied in spring at a rate of cup was used to bore the hole and a kaolinite paste used to ensure good contact between the soil 75 kg NH
4-N ha−1, and (3) conventional or
reduced tillage for seed-bed preparation. The and the ceramic cup. A rubber collar mounted around the tube at the soil surface prevented experimental plots of the study were placed in the
treatments with no fertilizer applied, but with or bypass flow of rainwater from above. without cattle slurry applied in the autumn and
with conventional or reduced tillage for seed-bed 2.3. Sampling
preparation. As the tillage treatments did not show
any significant effects in any of the parameters Soil samples were taken from both main plots and 15N-labelled microplots 2, 23, 74 (autumn) reported here, all the following results have been
averaged over tillage treatments (n=8). and 205 (spring) days after application of the cattle slurry. On each occasion, 16 cores per main plot Experimental plots (4×15 m) were established
in mid-September 1995, after the preceding pea or microplot were taken to a depth of 20 cm using a steel corer of 30 mm diameter. After harvest of crop had been harvested and the straw removed.
Cattle slurry (4.5 g total N kg−1, 2.1 g NH
4- the wheat crop, soil samples were taken in the microplots to a depth of 100 cm in 25 cm depth N kg−1, 2.4 g organic-N kg−1and 85 g dry matter
plings, the soil cores were thoroughly mixed, stored 105°C over night) was measured at each sam-pling date.
for a maximum of 24 h at 2–5°C before analyses
and were not sieved or pre-incubated to avoid Measurements of soil surface CO
2 flux as an index of in-situ microbial respiratory activity were interference of soil handling on biological and
biochemical properties before analysis (Ocio and made seven times during the first 5 weeks after application of the cattle slurry. A closed chamber Brookes, 1990). Soil samples for total C, N and
15N were dried at 105°C and finely ground on a (diameter 10 cm) was placed on the soil (inserted 1–2 cm) and connected to an infra-red CO
2 gas ball mill before analyses on an ANCA-MS system
as described below. Chemical and biochemical analyzer (Soil Respiration System SRC-1, PP Systems, Hitchin, UK ) in a closed circuit. Normal analyses were carried out in duplicate for each
soil sample. exposure time was less than 2 min. Thorough
mixing of the air in the closed chamber, tubing Sampling of soil solution started after the field
had reached field capacity and was carried out and IRGA sensor cell was ensured by a small ventilator inside the chamber. Further details have four times during autumn and twice during spring.
A vacuum of −0.06 MPa was applied to the been given by Jensen et al. (1996). In each main plot, five replicate measurements were made at ceramic suction cups with a small hand-operated
pump 2 days prior to sampling the soil solution. random location. Measurements were made in the daytime (from 8.00 a.m. to noon every time) and Soil solution samples were frozen immediately
until analysis. treatments randomized in the measuring sequence.
Soil microbial biomass was determined by fumi-Winter wheat plant samples were taken in both
main plots and microplots during the growing gation–extraction ( FE) (Brookes et al., 1985); see Jensen et al. (1997b) for further details of analyti-season (three times in autumn and three times in
spring/summer) and at harvest. In the main plots, cal procedures. The total N in the 0.5 M K 2SO4 soil extracts was determined by a persulphate-plants from 2 to 6 m of row were harvested at
each sampling, except at harvest where the whole oxidation procedure according to Cabrera and Beare (1993), a method which, for soil extracts, plot was harvested. In the microplots, 15 plants
were sampled at random (excluding the outer yields total N results similar to total Kjeldahl N. Soil microbial biomass N was calculated from the 10 cm) at each sampling except for the last
sam-pling, where the whole microplot was harvested difference in total N between fumigated and unfu-migated samples, using anf
EN(=1/KEN) factor of (excluding the outer 10 cm). Plant materials were
dried at c. 70°C and finely ground (<0.5 mm) 1.85 (Brookes et al., 1985; Joergensen and Mueller, 1996).
before analyses for total N and 15N on an
ANCA-MS system as described below. Plant dry Nitrate-N in the soil solution and ammonium-N and nitrate-N in the unfumigated 0.5 M K
2SO4 matter yield and total N uptake were determined
from the main plots, and15N enrichment from the extracts were determined by standard colorimetric methods ( Keeney and Nelson, 1982) using flow-microplots.
injection analysis.
Total 15N of all fumigated and unfumigated
2.4. Measurements and analyses
0.5 M K
2SO4extracts and mineral15N in unfumi-gated 0.5 M K
2SO4 extracts and soil solution Meteorological data (precipitation and air
tem-perature) were recorded at a meteorological station sampled from suction cups were determined in aliquots selected to contain c. 100–400mg N. A ( Tylstrup) 8 km from the experimental site. The
mean annual precipitation and annual mean air micro-diffusion procedure slightly modified from that of Sørensen and Jensen (1991) was used. temperature (30 year averages) were 668 mm and
7.3°C, with maximum and minimum daily mean Recovery of N in the diffusion traps was normally 95–100%. Diffusion traps were analysed for total temperatures of 15.5°C (July) and −0.7°C
(February). N and 15N on the ANCA-MS system described
15N in all extracts was corrected for the N content in blanks, according to Sørensen and Jensen (1991).
Total C, N and 15N in the whole soil, taken from microplots amended with labelled cattle slurry and from main plots with or without cattle slurry, were determined in samples taken initially, in spring and at harvest using an ANCA-MS system (ANCA-SL elemental analyzer and 20–20 mass spectrometer, Europa Scientific Ltd., Crewe, UK ).
Nitrogen derived from slurry ammonium-N
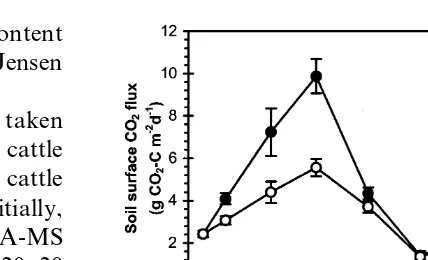
Fig. 1. Temporal variations in soil surface CO
2flux as a measure (Ndfs) in the different soil nitrogen pools and of microbial activity in soil non-amended or amended with taken up by the plants, was calculated according cattle slurry (at a rate of 3.5 kg m−2, corresponding to c. 310 g DM m−2) on 20 September 1995 (main plots, indicated to Powlson and Barraclough (1993).
Meas-by arrow). The first point shown was measured prior to slurry urements of 15N in soil and plant samples from
application. Both non-amended and amended soils were the plots without application of cattle slurry were
ploughed to a depth of 20 cm immediately following the applica-used to determine the background enrichment applica-used tion of slurry. Bars represent SE (n=8).
in the calculations.
2.5. Statistics 3.2. Soil mineral N and N derived from the slurry
(Ndfs)
Plant dry matter yield and N uptake, soil
micro-bial biomass N, soil mineral N, soil solution The soil mineral N content in the non-amended treatment decreased significantly during the NO
3-N and N derived from cattle slurry were
analysed statistically by analysis of variance autumn [Fig. 2(a)] and remained at a minimum of c. 20 kg N ha−1 (0–20 cm) from the December (ANOVA). The significance of differences between
slurry application rates and sampling dates was 1995 to the April 1996 sampling. In the amended treatment, the soil mineral N content had increased estimated using the Tukey test with a=0.05. A
statistical analysis was performed using SAS soft- by 54 kg N ha−1at the first sampling (2 days after the cattle slurry application and sowing of the ware (SAS Institute, 1985).
winter wheat), corresponding to c. 72% recovery of the 75 kg NH
4-N applied in the slurry (calcu-lated by difference). Soil mineral N derived from
3. Results
the slurry ammonium-N determined from the 15N labelling amounted to a similar figure of
3.1. Soil surface CO
2flux 59 kg N ha−1[Fig. 2(b)]. Nitrification was fast, at the first sampling c. 2/3 of the increase was as After the cattle slurry application and seedbed
tillage, the soil surface CO
2flux increased in both ammonium-N, but at the second sampling 3 weeks later, ammonium-N levels were similar in the the slurry-amended and non-amended treatments
(Fig. 1), with significantly (P<0.01) higher flux amended and non-amended treatments, with nitrate-N levels having increased significantly rates in the slurry amended treatment until a
maximum was reached c. 2 weeks after application. (P<0.001) in the amended treatment [Fig. 2(a)]. However, at the third sampling in December 1995, After that, flux rates decreased and were not
significantly different on the last two measuring soil mineral N levels in the amended treatment had decreased to a level similar to the non-dates. The soil temperature during this period
averaged 11.3°C, and showed no clear correspon- amended treatment, probably due to leaching of mineral N below 20 cm depth. Simultaneously, dence with the CO
Fig. 3. Temporal variations in (a) soil microbial biomass N (0– Fig. 2. Temporal variations in (a) soil mineral N
20 cm), in soil non-amended or amended with cattle-slurry on (NO
3-N+NH4-N ) and soil ammonium N (0–20 cm), in soil 22 September 1995 (to microplots, indicated by arrow) and (b) non-amended or amended with cattle-slurry (at a rate of
soil microbial biomass N derived from the slurry (Ndfs) in soil 7.5 g NH
4-N m−2) on 22 September 1995 (to microplots, indi- amended with cattle-slurry. Bars represent SE (n=8). cated by arrow) and (b) soil mineral N derived from the slurry
(Ndfs) in soil amended with cattle-slurry. Bars represent SE (n=8).
observed, with 17 kg N ha−1 derived from the slurry in the microbial biomass, corresponding to 23% of the applied slurry ammonium-N [Fig. 3(b)]. At the third sampling in December mineral N derived from the slurry NH
4-N
decreased dramatically (P<0.001), and only 3 and 1995, the microbial biomass N derived from slurry NH
4-N had decreased significantly (P<0.01), fol-2 kg N ha−1 [Fig. 2(b)] were found at the
December 1995 and April 1996 samplings. lowed by a slight decrease until the fourth sampling in April 1996.
3.3. Soil microbial biomass N and slurry-derived N
(Ndfs) 3.4. Soil solution nitrate-N and slurry-derived
nitrate-N (Ndfs)
Soil microbial biomass N was relatively stable
at a level between 187 and 143 kg N ha−1in both Nitrate-N levels in the soil solution at 60 cm depth did not differ significantly between treat-amended and non-treat-amended treatments [Fig. 3(a)],
showing a slightly decreasing trend with time. ments at any time [Fig. 4(a)]. At the last sampling in June 1996, soil solution could only be recovered Slurry application caused a slight, but insignificant,
increase in microbial biomass N at the second from suction cups in the slurry amended treatment. There was a marked temporal pattern of soil sampling, c. 3 weeks after application [Fig. 3(a)],
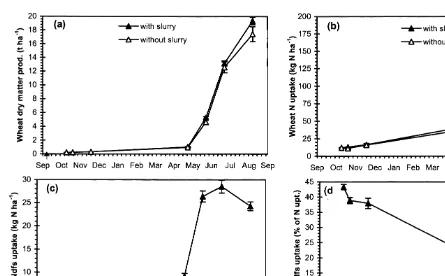
season in 1996 and did not differ between treat-ments [Fig. 5(a)]. Crop growth conditions were very optimal in 1996, however, and dry-matter production increased dramatically during the growing season, reaching a maximum of 19.4 and 17.4 t DM ha−1(not significantly different) at har-vest in August 1996 in the amended and non-amended treatments, respectively (corresponding to a grain yield of 10 100 and 9100 kg ha−1, H.S. Østergaard, pers. commun.). Winter wheat N uptake ( Fig. 5b) showed a marked sigmoidal pattern as well, with c. 40 kg N ha−1being taken up in both treatments in the beginning of May 1996 and a final N uptake of 182 and 150 kg N ha−1(not significantly different) at har-vest in Aug 1996 in the amended and non-amended treatments, respectively. Winter wheat uptake of N derived from the slurry ammonium-N [Fig. 5(c)] showed a similar pattern, although the crop uptake of soil derived N was dominant in the last part of the growing season, with the maximum amount of slurry-derived N, 28.5 kg N ha−1, found in the crop at the early July sampling and a significant Fig. 4. Temporal variations in (a) NO
3-N in soil solution
sampled with ceramic suction cups at 60 cm depth in soil non- decrease (P<0.05) in slurry-derived N content by amended or amended with cattle-slurry on 22 September 1995 harvest. The proportion of winter wheat N content (indicated by arrow) and (b) fraction of soil solution NO
3-N derived from the slurry ammonium-N decreased derived from the slurry in soil amended with cattle-slurry. Bars
continuously over the whole growth period from represent SE (n=8).
43%of plant N at the initial sampling in late Oct 1995 to only 14%of plant N at harvest [Fig. 5(d)]. 13–14 mg nitrate-N l−1at the first two samplings,
to very high levels of 53–81 mg nitrate-N l−1 at
3.6. Post-harvest depth distribution of
slurry-the samplings in November and December 1995
derived N
and April 1996, followed by a sharp decrease at the last sampling, probably due to plant uptake.
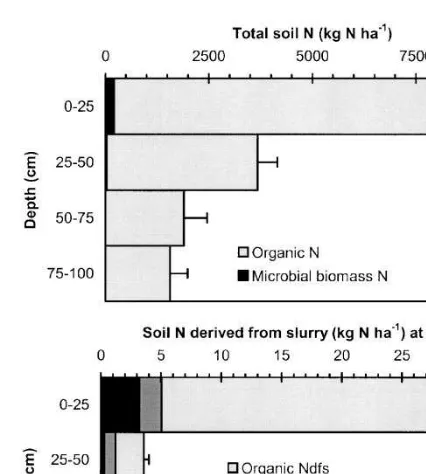
The soil had a relatively high total N content, The proportion of slurry-derived nitrate-N in the
especially in the deeper layers [Fig. 6(a)]. The total soil solution [Fig. 4(b)] became significant
N content in the 0–100 cm depth amounted to (P<0.001) from the late November 1995 sampling,
15 600 kg N ha−1, with more than half of this in where nitrate leaching apparently occurred, and
the top 25 cm. Most of this N was in dead organic increased significantly at the following early
form; very little mineral N was left in the soil December 1995 and subsequent April 1996
sam-profile at harvest (only c. 30 kg N ha−1), and soil pling, where it reached a maximum of 6% of the
microbial biomass only accounted for a significant soil solution nitrate-N being derived from the
proportion (2.5%) of total N in the top 25 cm. slurry ammonium-N.
Nitrogen derived from the slurry ammonium-N showed a distribution with the majority being
3.5. Wheat crop dry matter production and N
located in the top 25 cm [Fig. 6(b)] most of this
uptake
being in dead, organic form, and the remainder being in the form of microbial biomass and mineral Winter wheat dry matter production was less
Fig. 5. Time-course of (a) winter wheat dry matter production and (b) N uptake on non-amended or cattle-slurry amended plots and (c) winter wheat uptake of N derived from the slurry and (d ) fraction of winter wheat N uptake derived from the slurry in soil amended with cattle-slurry on 22 September 1995 (indicated by arrow). Bars represent SE.
ammonium-N was found below a depth of 50 cm 58 kg N ha−1, corresponding to 77%of the applied ammonium-N ( Table 2). This means that less than (3 kg N ha−1).
a quarter of the slurry ammonium-N was lost by either volatilization, denitrification or leaching,
3.7. Recovery of slurry-derived ammonium-N
and approximately a third of the applied slurry ammonium-N was removed with the harvested Two days after application of the slurry, 79%
of the slurry-derived ammonium-N was recovered wheat grain and straw. Thus, about 45% was left in the soil, mainly in organic form as mentioned in the soil mineral N pool to 20 cm depth, while a
further 18% was recovered as organic (non-micro- above. bial ) or clay-fixed N, making the recovery in the
plough layer almost complete ( Table 1). In the
following spring, almost the same amount was 4. Discussion
recovered as organic (non-microbial ) or clay-fixed
N, but the soil mineral and microbial biomass N 4.1. Biological activity and microbial N immobilization
were negligible, and thus only 24% of the applied slurry ammonium-N was recovered to a depth
of 20 cm. The continuous N
mineralization–immobiliza-tion turnover (MIT ) is caused by microbial activ-However, the recovery of slurry-derived
matter, albeit at a relatively low rate. However, for a significant microbial immobilization of min-eral N to occur, an increase in the microbial activity is required and will be brought about by a substrate input such as animal manure containing a mixture of both easily available and more recalcitrant C sources. In our study, soil surface CO
2flux also increased after ploughing in the non-amended treatment ( Fig. 1), in spite of a generally decreasing temperature trend (data not shown). As shown by Reicosky (1997), however, soil till-age, and especially mould-board ploughing, may induce very large increases in CO
2flux. Certainly, the application of cattle slurry in this experiment at a rate equivalent of 35 t FW or c. 3 t DM ha−1 produced a further increase in soil respiration of the amended over the non-amended treatment, but only temporarily. Two week after application of the slurry, the soil surface CO
2 flux reached a maximum in both treatments, with approximately twice the flux rate in the amended treatment com-Fig. 6. Distribution with depth after wheat harvest of soil min- pared to the non-amended treatment ( Fig. 1). One eral, soil microbial biomass and soil organic (non-SMB) N (a) week later, the flux rates had decreased, and the and N derived from the applied cattle slurry (b). In (a), soil
difference between treatments ceased. In Canada, mineral N content is insignificant (<20 kg N per layer) and
Gregorich et al. (1998) found similar increases thus omitted. Bars represent SE of the total N (a) or total Ndfs
(b) (n=8 ). in soil surface CO
2 flux after application of 56 t ha−1of solid farmyard manure. Their absolute
Table 1
Recovery of N derived from slurry NH
4-N in the soil (0–20 cm) 2 days after slurry application and in the following spring [means±SE (n=8)]
Total N N derived from slurry NH 4-N
kg N ha−1 kg N ha−1 Percentage of added
24 September 1995
Soil mineral N 104±9 58.8±9.2 78
Soil microbial biomass N 187±7 0.0±4.3 0
Organic (non-SMB) or clay-fixed N 6050±94 13.2±6.0 18
Total soil N 6340±88 72.0±8.0 96
Slurry NH
4-N not recovered 0–20 cm 3 4
14 April 1996
Soil mineral N 21±1 2.0±0.1 3
Soil microbial biomass N 155±3 4.5±0.5 6
Organic (non-SMB) or clay-fixed N 6057±131 11.6±1.0 15
Total soil N 6234±133 18.0±1.0 24
Slurry NH
Table 2
Recovery of N derived from slurry NH
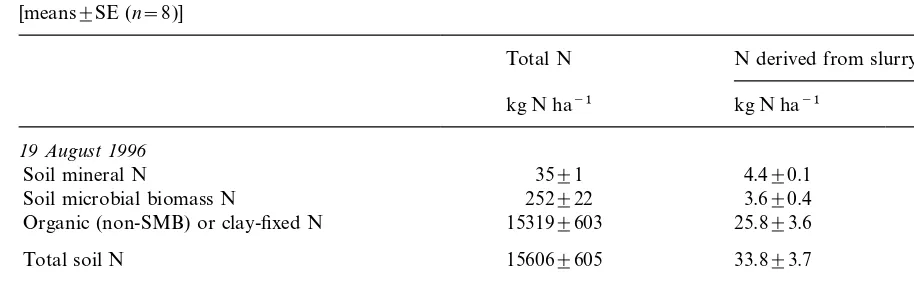
4-N in the soil (0–100 cm) and in the wheat crop (above ground) at harvest in August 1996 [means±SE (n=8)]
Total N N derived from slurry NH 4-N
kg N ha−1 kg N ha−1 Percentage of added
19 August 1996
Soil mineral N 35±1 4.4±0.1 6
Soil microbial biomass N 252±22 3.6±0.4 5
Organic (non-SMB) or clay-fixed N 15319±603 25.8±3.6 34
Total soil N 15606±605 33.8±3.7 45
Total wheat N (aboveground ) 182±8 24.3±1.0 32
Recovery of slurry NH
4-N (in soil+crop) 58 77
Slurry NH
4-N not accounted for 17 23
flux rates were also comparable to our study, but volatile fatty acids ( VFA) in anaerobic slurries, the difference between the manure-amended and the VFAs decomposing very rapidly within a few non-amended treatments persisted for much days after application to soil. In our study, meas-longer, c. 100 days compared to the c. 25 days in urements were not carried out frequently enough, our study. This means that the initial flush of so we cannot exclude the possibility that immobili-microbial activity within the first 3–4 weeks in our zation has been even higher either during the first experiment was most likely driven by easily decom- 2 weeks or later, but the following measurements posable substances, such as soluble organic C and in early December and April showed no further volatile fatty acids, known to accumulate especially immobilization, with values decreasing to roughly in dry matter rich slurries during anaerobic storage a quarter of the maximum value by next spring, (Sørensen, 1998). At the same time, the level of indicating a rapid turnover of microbial N derived microbial biomass N derived from the slurry from the slurry. This is more rapid than the [Fig. 3(b)], i.e. immobilized from the soil mineral microbial turnover observed by Jensen et al. N pool, was the highest measured; 23% of the (1997a), who found 15N-labelled microbial bio-applied slurry ammonium N was immobilized into
mass half-lives of 230–570 days. Total microbial the microbial biomass during the first 3 weeks.
biomass N is hardly affected over time [Fig. 3(a)], Other studies have shown equally fast
immobiliza-however, although a small, non-significant, tion rates; in a pot experiment at 20°C, Trehan
increase was observed in the amended treatment and Wild (1993) found maximum immobilization
at the second sampling. This is contrary to Paul to occur within 3 weeks, and Morvan et al. (1997)
and Beauchamp (1996) and Jensen et al. (1997b), found a very rapid immobilization of slurry
who found increases of c. 30%upon incorporation NH
4-N within the first week in a field experiment of either c. 6 t DM ha−1 of cattle slurry or with temperatures ranging between 15 and 25°C.
4 t DM ha−1of rape straw, respectively, somewhat In an incubation experiment, Sørensen and Jensen
more than in the current study, where c. (1995) also found that maximum immobilization,
3 t DM ha−1 was applied. Apparently, the sub-due to slurry application, occurred within 1–
strate amendment with the slurry mainly produced 2 weeks at 22°C, and they furthermore observed
a temporal increase in MIT (Trehan and Wild, an increasing degree of N immobilization and
1993; Paul and Beauchamp, 1995), without any decreasing remineralization rate with soil clay
significant net growth of the microbial biomass, content. Both Kirchmann and Lundvall (1993)
but with a significant proportion of the assimilated and Sørensen (1998) showed a close relationship
N (e.g. microbial metabolites) within the first few occurred even under such low leaching risk condi-tions, but we do not know to what depth below weeks (Mueller et al., 1998).
60 cm it was leached before winter percolation ceased. The soil solution nitrate concentrations
4.2. Losses of slurry ammonium-N
[Fig. 4(a)] were extraordinarily high in November, December and April, regardless of manure applica-The rapid incorporation of the slurry into the
soil apparently prevented ammonia volatilization, tion, probably due to large N mineralization from roots and rhizodeposits of the previous pea crop. as can be seen from the high recovery of
slurry-derived N (96%) at the initial sampling ( Table 1). This further accentuates the fact that the slurry-derived15N signature could be picked out on such Sørensen and Jensen (1995) found similar low
apparent loss rates. Some immobilization of a high background of mineral N so early after slurry application.
ammonium-N did occur during the first 2 days
from application to the initial sampling (18%, Beckwith et al. (1998) estimated from a number of experiments on loamy sandy soils in the UK Table 1), however, but it seemed to be mainly
abiotic, i.e. ammonium fixation, as no measurable that application of animal slurries in September resulted in leaching losses of 20–30%of the applied assimilation of15N into the soil microbial biomass
was observed at that time. Sørensen and Jensen 200 kg total N ha−1 and that delaying this until December or January could minimize losses to less (1995) also found ammonium fixation to occur at
rates between 0.6 and 19% on sandy and sandy than 5%. However, Thomsen et al. (1997) found that by spring application, slurry15N did not seem loam soils
Climatic conditions during the experimental much more prone to leaching in the following winter than applied fertilizer15N, with 3–5 and 1– period were somewhat unusual and were
charac-terized by a winter precipitation much lower than 3% of the applied15N being leached, respectively. However, as larger amounts of total N were normal, only half of the long-term average of
326 mm from September to March. Furthermore, applied with the slurry, absolute leaching losses were larger with slurry.
winter temperatures were lower than normal, mostly below 0°C from December to February
(2.8°C below the long-term average), and this 4.3. Crop uptake and soil profile distribution of N derived from slurry ammonium-N
altogether decreased the risk of N losses from leaching. As a consequence, very favourable crop
growth conditions prevailed in the spring with an Considering the observed rapid movement of slurry-derived 15N down through the soil profile, ample supply of mineral N in the profile available
for the winter wheat corresponding to c. it may seem somewhat surprising that the winter wheat crop was still capable of taking up a maxi-150 kg mineral N ha−1to a depth of 100 cm (H.S.
Østergaard, pers. commun.). This was also mum 38% (in early July) of the autumn applied slurry ammonium-N. Sørensen and Jensen (1996) reflected in the unusually high grain yield of more
than 9000 kg ha−1in all treatments, including the found a cumulated recovery of 52–62% of 15N labelled urine applied before sowing in three cuts unfertilized, unmanured treatment (H.S.
Østergaard, pers. commun.). However, this should of italian rye grass on different soil types. However, Thomsen et al. (1997) found that cattle slurry also have reduced the risk of leaching of slurry
ammonium-N once this was nitrified [within selectively15N-labelled in the urine fraction applied to a coarse sand and a sandy loam soil in spring 3 weeks, see Fig. 2(a)], but the contrary was
indi-cated by the disappearance from the plough layer before sowing of barley resulted in only 32 and 36%, respectively, of the applied 15N to be reco-[Fig. 2(b)] and the appearance in the soil solution
at 60 cm depth of slurry-derived 15N already in vered in the crop, a figure similar to our findings with autumn application. Powlson et al. (1986), late November [Fig. 4(b)], c. 2 months after slurry
four soils. However, Jackson and Smith (1997) 5. Conclusions
evaluated autumn, winter and spring applications
It is concluded that the application of cattle of animal slurries in England on seven sites in
slurry increased microbial activity temporarily and 4 years and found that apparent N recovery rates
thereby promoted very rapid MIT and significant (difference method) were halved by autumn
com-immobilization of slurry NH
4-N into the microbial pared to spring application. In the current study,
biomass. However, rapid microbial turnover the major proportion of the 15N was taken up
depleted the microbial biomass 15N before next between 7 May and 5 June, corresponding well
spring and leaching of slurry-derived N was also with the difference in N uptake between the
rapid, even in the experimental year with a low amended and non-amended treatments [Fig. 5(b)
leaching risk. Due to the lower-than-normal winter and (c)]. One explanation for the relatively high
precipitation and probably also due to a high recovery in our study could be that the winter
rooting depth of the winter wheat crop, a relatively wheat rooting depth was sufficiently large to catch
high recovery of slurry-derived N in the plant the leached slurry-derived N. At soil sampling
biomass was found. Post-harvest residual N after harvest, a relatively high wheat root density,
derived from the slurry NH
4-N could mainly be even at a depth of 100 cm, was observed visually,
found in organic form in the topsoil, as also indicating a rooting depth of somewhat more than
commonly found with fertilizer N, indicating the 100 cm, which is unexpected on this loamy sand
importance of microbial activity in N cycling soil normally classified in Denmark as having a
through MIT. maximum rooting depth of 75 cm.
After harvest, very little slurry-derived15N was found in the soil profile as mineral N, less than
5 kg N ha−1 [Fig. 6(b) and Table 2]. The major Acknowledgements proportion of slurry-derived15N in the top 25 cm
was now present as organic N (82%), which was We thank farmer Niels Ottosen, ‘Nordkær’ for an increase from the 64% organic15N in the top the use of the field site, and the Danish Agricultural 20 cm in the spring (calculated from Table 1). Advisory Centre, who were responsible for the Furthermore, the majority of the slurry-derived N main field experiment in which this study was was present in the top 25 cm, with less than 20% carried out.
in the 25–100 cm depth. This is similar to the findings from a lysimeter study, where a grass sward received15NH
4-N labelled pig slurry (Carey References et al., 1997), and indicates the importance of
biological activity for the transformation of
Beckwith, C.P., Cooper, J., Smith, K.A., Shepherd, M.A., 1998. applied mineral N into organic forms. Although
Nitrate leaching loss following application of organic the level of total microbial biomass N is relatively
manures to sandy soils in arable cropping. I. Effects of appli-stable over time [Fig. 3(a)], the rapid turnover of cation time, manure type, overwinter crop cover and nitrifi-the microbial biomass caused microbial biomass cation inhibition. Soil Use Manage. 14, 123–130.
Brookes, P.C., Landman, A., Pruden, G., Jenkinson, D.S., N derived from the slurry to decrease more or less
1985. Chloroform fumigation and the release of soil nitro-exponentially after the initial maximum
immobili-gen: A rapid direct extraction method to measure microbial zation [17 kg Ndfs ha−1, Fig. 3(b)] in October, biomass in soil. Soil Biol. Biochem. 17, 837–842.
decreasing to only 3 kg Ndfs ha−1[Fig. 6(b)] the Cabrera, M.L., Beare, M.H., 1993. Alkaline persulfate oxida-tion for determining total nitrogen in microbial biomass following August. These observations also confirm
extracts. Soil Sci. Soc. Am. J. 57, 1007–1012. the general conclusions made by Sørensen et al.
Carey, P.L., Rate, A.W., Cameron, K.C., 1997. Fate of nitrogen (1994) that the residual N value does not differ in pig slurry applied to a New Zealand pasture soil. Aust. between various sources, whether they are mineral J. Soil Res. 35, 941–959.
Fate of 15N labelled urine on four soil types. Plant Soil slurry ammonium for corn using 15N-labelled (NH
4)2SO4. Can. J. Soil Sci. 75, 35–42. 199, 195–203.
Paul, J.W., Beauchamp, E.G., 1996. Soil microbial biomass C, Gregorich, E.G., Rochette, P., McGuire, S., Liang, B.C.,
Les-N mineralization and Les-N uptake by corn in dairy cattle sard, R., 1998. Soluble organic carbon and carbon dioxide
slurry- and urea-amended soils. Can. J. Soil Sci. 76, fluxes in maize fields receiving spring-applied manure.
469–472. J. Environ. Qual. 27, 209–214.
Powlson, D.S., Hart, P.B.S., Pruden, G., Jenkinson, D.S., 1986. Jackson, D.R., Smith, K.A., 1997. Animal manure slurries as
Recovery of 15N-labelled fertilizer applied in autumn to a source of nitrogen for cereals: Effect of application time
winter wheat at four sites in eastern England. J. Agric. Sci., on efficiency. Soil Use Manage. 13, 75–81.
Cambr. 107, 611–620. Jensen, L.S., Mueller, T., Tate, K.R., Ross, D.J., Magid, J.,
Powlson, D.S., Barraclough, D., 1993. Mineralization and Nielsen, N.E., 1996. Soil surface CO
2flux as an index of assimilation in soil–plant systems. In: Knowles, R., Black-soil respiration in situ: A comparison of two chamber
meth-burn, T.H., Melillo, J.M. (Eds.), Nitrogen Isotope Tech-ods. Soil Biol. Biochem. 28, 1297–1306.
niques. Isotopic Techniques in Plant soil and Aquatic Jensen, L.S., Christensen, L., Mueller, T., Nielsen, N.E., 1997a.
Biology. Academic Press, London, pp. 209–242. Turnover and loss of residual15N-labelled fertilizer N in soil
Reicosky, D.C., 1997. Tillage-induced CO
2emission from soil. following harvest of oilseed rape (Brassica napusL.). Plant
Nutr. Cycl. Agroecosyst. 49, 273–285. Soil 190, 193–202.
SAS Institute, 1985. SAS/STAT Guide for Personal Computers Jensen, L.S., Mueller, T., Magid, J., Nielsen, N.E., 1997b.
Tem-Version 6. SAS Institute, Cary, NC. poral variation of C and N mineralization microbial biomass
Sommer, S.G., Friis, E., Bach, A., Schjorring, J.K., 1997. and extractable organic pools in soil after oilseed rape straw
Ammonia volatilization from pig slurry applied with trail incorporation in the field. Soil Biol. Biochem. 29,
hoses or broadspread to winter wheat: Effects of crop devel-1043–1055.
opmental stage microclimate and leaf ammonia absorption. Joergensen, R.G., Mueller, T., 1996. The fumigation extraction
J. Environ. Qual. 26, 1153–1160. method to estimate soil microbial biomass: Calibration of
Sørensen, P., Jensen, E.S., 1991. Sequential diffusion of ammo-thek
ENvalue. Soil Biol. Biochem. 28, 33–37. nium and nitrate from soil extracts to a polyfluoroethylene Keeney, D.R., Nelson, D.W., 1982. Nitrogen — Inorganic
trap for15N determination. Anal. Chim. Acta 252, 201–203. forms. In: Page, L. ( Ed.), Methods of Soil Analysis. ASA,
Sørensen, P., Jensen, E.S., Nielsen, N.E., 1994. The fate of Madison, WI, pp. 643–698.
15N labelled organic nitrogen in sheep manure applied to Kirchmann, H., Lundvall, A., 1993. Relationship between N
soils of different texture under field conditions. Plant Soil immobilization and volatile fatty acids in soil after
applica-162, 39–47.
tion of pig and cattle slurry. Biol. Fertil. Soils 15, 161–164. Sørensen, P., Jensen, E.S., 1995. Mineralization–immobilization Kirchmann, H., Esala, M., Morken, J., Ferm, M., Bussink, W., and plant uptake of nitrogen as influenced by the spatial Gustavsson, J., Jakobsson, C., 1998. Ammonia emissions distribution of cattle slurry in soils of different texture. Plant from agriculture — Summary of the Nordic seminar on Soil 173, 283–291.
ammonia emission, science and policy. Nutr. Cycl. Agroeco- Sørensen, P., Jensen, E.S., 1996. The fate of fresh and stored syst. 51, 1–3. 15N-labelled sheep urine and urea applied to a sandy and a Morvan, T., Leterme, P., Arsene, G.G., Mary, B., 1997. Nitro- sandy loam soil using different application strategies. Plant
gen transformations after the spreading of pig slurry on bare Soil 183, 213–220.
soil and ryegrass using 15N-labelled ammonium. Eur. Sørensen, P., 1998. Carbon mineralization, nitrogen immobili-J. Agron. 7, 181–188. zation and pH change in soil after adding volatile fatty acids. Mueller, T., Jensen, L.S., Magid, J., Nielsen, N.E., 1998. Turn- Eur. J. Soil Sci. 49, 457–462.
over of carbon and nitrogen in a sandy loam soil following Sørensen, P., Jensen, E.S., 1998. The use of15N labelling to incorporation of chopped maize plants, barley straw and study the turnover and utilization of ruminant manure N. bluegrass in the field. Soil Biol. Biochem. 30, 561–571. Biol. Fertil. Soils 28, 56–63.
Nielsen, N.E., Jensen, H.E., 1990. Nitrate leaching from loamy Thomsen, I.K., Kjellerup, V., Jensen, B., 1997. Crop uptake soils as affected by crop rotation and nitrogen fertilizer and leaching of15N applied in ruminant slurry with selec-application. Fert. Res. 26, 197–207. tively labelled faeces and urine fractions. Plant Soil 197, Ocio, J.A., Brookes, P.C., 1990. Soil microbial biomass meas- 233–239.
urements in sieved and unsieved soils. Soil Biol. Biochem. Trehan, S., Wild, A., 1993. Effects of an organic manure on the 22, 999–1000. transformations of ammonium nitrogen in planted and