* Corresponding author.
STRUCTURE ELUCIDATION OF BIOACTIVE ALKALOID COMPOUNDS ISOLATED
FROM SPONGE
Petrosia sp
COLLECTED FROM BUNAKEN BAY MENADO
Gemini Alam
1,Puji Astuti
2,*, Dinar Sari
3,Subagus Wahyuono
2,and Mark T. Hamman
41
Department of Pharmacy, Faculty of Mathematic and Natural Sciences, Hasanuddin University, Makassar 2
Pharmaceutical Biology Department, Faculty of Pharmacy, Gadjah Mada University, Yogyakarta 3
Biology Department, Faculty of Mathematic and Natural Sciences, Sebelas Maret University, Surakarta 4
Department of Pharmacognosy, Faculty of Pharmacy, Mississippi University, USA
Received 27 April 2005; Accepted 1 May 2005
ABSTRACT
Two alkaloid compounds have been isolated from sponge Petrosia sp collected from Bunaken Bay Menado. These compounds have been found to inhibit several human cancer cell proliferation in vitro. Structure elucidation is needed to further characterize these bioactive compounds. The structure is determined by analyzing Ultra Violet (UV), Infra Red (IR), Mass Spectra (MS) and Nuclear Magnetic Resonance (NMR) spectra. Based on spectroscopic data, Thin Layer Chromatography (TLC) co-chromatograph with authentic samples and comparison with reported data the two compounds were identified as Manzamine A and 8-OH Manzamine A, respectively.
Keywords:Manzamine A, 8-OH Manzamine A, Petrosia sp, stucture elucidation
INTRODUCTION
Cancer remains a major public health problem around the world. In the United States one in four deaths is caused by cancer. In Indonesia, Department of Health estimates that 100 new cancer cases per 100,000 people are diagnosed each year. The number of people die due to cancer increase from 4,5 per 1000 in 1989 to 4,9 per 1000 in 1995 [1]. A number of researches have been conducted to search anticancer with renewed vigor. One of the alternatives is finding lead compounds from natural products. Natural products are the major source of lead compounds for drugs against cancer with sponges as one of the examples.
Sponges are marine invertebrates, the simplest form of multi-cellular animals. A sponge is a sedentary, filter-feeding metazoan which utilizes a single layer of flagellated cells (choanocytes) to pump a unidirectional water current through its body [2]. It is a bottom-dwelling creature which attaches itself to something solid in a place where it can find enough food to grow. The scientific name for sponges is "Porifera," which translates into "pore-bearing."
The compounds isolated from sponges have exhibited a diverse range of bioactivities including cytotoxicity, insecticidal, antibacterial, antimalarial and anti inflammation [3-7]. Whilst manzamines, unique marine alkaloids, are widely explored, other type of active compounds such as triterpenes are also reported [8].
Preliminary study has been conducted by Alam and his co-workers for the screening of toxic compounds using Brine Shrimp Lethality Test [9]. From the samples studied, two compounds were found to be active with LC50of 7.23 and 5.69g/mL and considered potential for the screening of anticancer drug leads. Compound1 is then found to selectively inhibit the growth of several human cancer cell lines, whilst compound 2 also shows cytotoxicity against HeLa, myeloma and Raji cells [10-12]. Structure elucidation of these active compounds are needed for further development.
EXPERIMENTAL SECTION
Material
SponsPetrosia spwas collected from Bunaken Bay Menado on October 22nd, 2002, silica gel 60 PF254, n-hexane, ethyl acetate, chloroform, methanol, acetone.
Procedure
identified for its molecular structure by analyzing UV, IR, and NMR spectroscopy data.
RESULT AND DISCUSSION
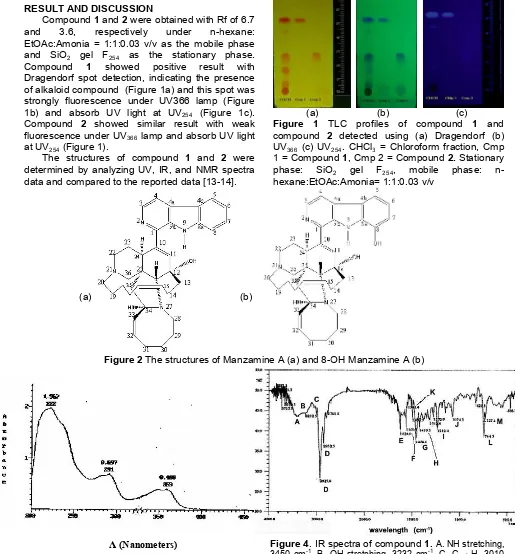
Compound1and2were obtained with Rf of 6.7
and 3.6, respectively under n-hexane:
EtOAc:Amonia = 1:1:0.03 v/v as the mobile phase and SiO2 gel F254 as the stationary phase.
Compound 1 showed positive result with
Dragendorf spot detection, indicating the presence of alkaloid compound (Figure 1a) and this spot was strongly fluorescence under UV366 lamp (Figure 1b) and absorb UV light at UV254 (Figure 1c). Compound 2 showed similar result with weak fluorescence under UV366lamp and absorb UV light at UV254(Figure 1).
The structures of compound 1 and 2 were determined by analyzing UV, IR, and NMR spectra data and compared to the reported data [13-14].
(a) (b) (c)
Figure 1 TLC profiles of compound 1 and compound 2 detected using (a) Dragendorf (b) UV366 (c) UV254. CHCl3 = Chloroform fraction, Cmp 1 = Compound1, Cmp 2 = Compound2. Stationary phase: SiO2 gel F254, mobile phase: n-hexane:EtOAc:Amonia= 1:1:0.03 v/v
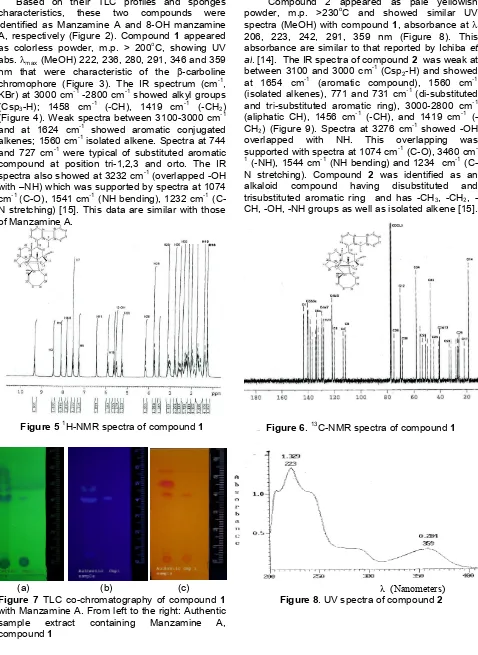
(a) (b)
Figure 2The structures of Manzamine A (a) and 8-OH Manzamine A (b)
Figure 3. UV spectra of compound1
Figure 4. IR spectra of compound1.A. NH stretching, 3450 cm-1. B. OH stretching, 3232 cm-1. C. Csp2-H, 3010
cm-1. D. Csp3-H, 2925 dan 2852 cm-1. E. conjugated
alkene, 1624 cm-1. F. isolated alkene, 1560 cm-1. G.-CH bending, 1458 cm-1. H. -CH2 bending, 1419 cm-1. I. C-N stretching, 1232 cm-1.J. C-O stretching, 1074 cm-1. K. NH bending, 1541 cm-1. L. substituted 1,2,3; 744 cm-1. M. substituted orto, 727 cm-1.
λ (Nanometers) Based on their TLC profiles and sponges
characteristics, these two compounds were identified as Manzamine A and 8-OH manzamine A, respectively (Figure 2). Compound 1 appeared as colorless powder, m.p. > 200oC, showing UV abs.max(MeOH) 222, 236, 280, 291, 346 and 359 nm that were characteristic of the -carboline chromophore (Figure 3). The IR spectrum (cm-1, KBr) at 3000 cm-1-2800 cm-1showed alkyl groups (Csp3-H); 1458 cm
-1
(-CH), 1419 cm-1 (-CH2) (Figure 4). Weak spectra between 3100-3000 cm-1 and at 1624 cm-1 showed aromatic conjugated alkenes; 1560 cm-1isolated alkene. Spectra at 744 and 727 cm-1were typical of substituted aromatic compound at position tri-1,2,3 and orto. The IR spectra also showed at 3232 cm-1(overlapped -OH with –NH) which was supported by spectra at 1074 cm-1(C-O), 1541 cm-1(NH bending), 1232 cm-1 (C-N stretching) [15]. This data are similar with those of Manzamine A.
Figure 51H-NMR spectra of compound1
(a) (b) (c)
Figure 7 TLC co-chromatography of compound 1 with Manzamine A. From left to the right: Authentic
sample extract containing Manzamine A,
compound1
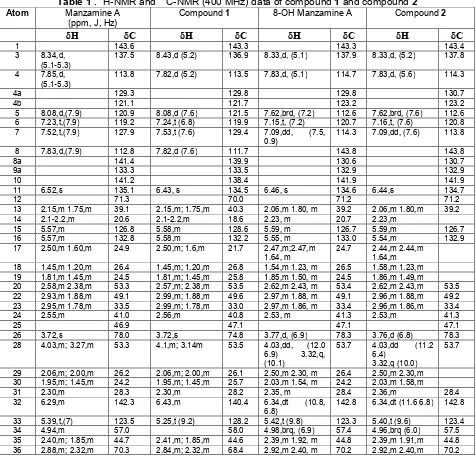
Compound 2 appeared as pale yellowish powder, m.p. >230oC and showed similar UV spectra (MeOH) with compound 1, absorbance at 206, 223, 242, 291, 359 nm (Figure 8). This absorbance are similar to that reported by Ichibaet al. [14]. The IR spectra of compound2 was weak at between 3100 and 3000 cm-1(Csp2-H) and showed at 1654 cm-1 (aromatic compound), 1560 cm-1 (isolated alkenes), 771 and 731 cm-1(di-substituted and tri-substituted aromatic ring), 3000-2800 cm-1 (aliphatic CH), 1456 cm-1 (-CH), and 1419 cm-1 (-CH2) (Figure 9). Spectra at 3276 cm
-1
showed -OH overlapped with NH. This overlapping was supported with spectra at 1074 cm-1(C-O), 3460 cm -1
(-NH), 1544 cm-1(NH bending) and 1234 cm-1 (C-N stretching). Compound 2 was identified as an alkaloid compound having disubstituted and trisubstituted aromatic ring and has -CH3, -CH2, -CH, -OH, -NH groups as well as isolated alkene [15].
Figure 6.13C-NMR spectra of compound1
The 1H-NMR and 13C-NMR spectral data (400MHz, CDCl3,, ppm) (Table 1) of compound1 display 36 carbon signals with six characteristic signals in the aromatic region, indicating the presence of a 1-substituted -carboline, the features of manzamine A (C36H44N4O, MW:548). The olefinic signals at 6.43 (s), 5.58 (m), 5.58 (m), 6.43 (m), 5.25 (t, 9.2) reveals the presence of three (one tri- and two disubstituted) double bonds. These data together with the unsaturation requirement (17) showed that this compound contains five additional rings with two nitrogen atoms and a tertiary hydroxy group (1074 cm-1, 70.03s) (Figure 5 and 6). TLC co-chromatograph with authentic samples shows similarity with Manzamine A (Figure 7).
The 1H-NMR and 13C-NMR spectral data (400MHz, CDCl3, , ppm) (Table 1) of compound 2 also display 36 carbon signals with tertiary hydroxyl group (1074 cm-1,71.2s). The presence of another hydroxy group which is located at C (8) is shown by the presence of five aromatic proton signals instead of six in compound1. This hydroxyl group position is confirmed by the resonance 7.82, d (5.2) for H (4) which indicates the absence of substituent at C (5) and this is characteristic for 8-OH manzamine A (C36H44N4O2, MW:564).The signals at 6.44 (s), 5.59 (m), 5.54 (m), 6.34 (dt,11.6, 6.8), 5.40 (t, 9.6) reveals the presence of olefinic with one tri- and two disubstituted double bonds (Figure 10 and 11).
Table 1.1H-NMR and13C-NMR (400 MHz) data of compound1and compound2 Atom Manzamine A
(ppm, J, Hz)
Compound1 8-OH Manzamine A Compound2
H C H C H C H C
1 143.6 143.3 143.3 143.4
3 8.34,d, (5.1-5.3)
137.5 8.43,d (5.2) 136.9 8.33,d, (5.1) 137.9 8.33,d, (5.2) 137.8 4 7.85,d,
(5.1-5.3)
113.8 7.82,d (5.2) 113.5 7.83,d, (5.1) 114.7 7.83,d, (5.6) 114.3
4a 129.3 129.8 129.8 130.7
4b 121.1 121.7 123.2 123.2
5 8.08,d,(7.9) 120.9 8.08,d (7.6) 121.5 7.62,brd, (7.2) 112.6 7.62,brd, (7.6) 112.6 6 7.23,t,(7.9) 119.2 7.24,t (6.8) 119.9 7.15,t, (7.2) 120.7 7.16,t, (7.6) 120.8 7 7.52,t,(7.9) 127.9 7.53,t (7.6) 129.4 7.09,dd, (7.5,
0.9)
114.3 7.09,dd, (7.6) 113.8
8 7.83,d,(7.9) 112.8 7.82,d (7.6) 111.7 143.8 143.8
8a 141.4 139.9 130.6 130.7
9a 133.3 133.5 132.9 132.9
10 141.2 138.4 141.9 141.9
11 6.52,s 135.1 6.43, s 134.5 6.46, s 134.6 6.44,s 134.7
12 71.3 70.0 71.2 71.2
13 2.15,m 1.75,m 39.1 2.15,m; 1.75,m 40.3 2.06,m 1.80, m 39.2 2.06,m 1.80,m 39.2
14 2.1-2.2,m 20.6 2.1-2.2,m 18.6 2.23, m 20.7 2.23,m
15 5.57,m 126.8 5.58,m 128.6 5.59, m 126.7 5.59,m 126.7
16 5.57,m 132.8 5.58,m 132.2 5.55, m 133.0 5.54,m 132.9
17 2.50,m 1.60,m 24.9 2.50,m; 1.6,m 21.7 2.47,m;2.47,m 1.64, m
24.7 2.44,m 2.44,m 1.64,m 18 1.45,m 1.20,m 26.4 1.45,m; 1.20,m 26.8 1.54,m 1.23, m 26.5 1.58,m 1.23,m 19 1.81,m 1.45,m 24.5 1.81,m; 1.45,m 25.8 1.85,m 1.50, m 24.5 1.86,m 1.49,m
20 2.58,m 2.38,m 53.3 2.57,m; 2.38,m 53.5 2.62,m 2.43, m 53.4 2.62,m 2.43,m 53.5 22 2.93,m 1.88,m 49.1 2.99,m; 1.88,m 49.6 2.97,m 1.88, m 49.1 2.96,m 1.88,m 49.2 23 2.95,m 1.78,m 33.5 2.99,m; 1.78,m 33.0 2.97,m 1.86, m 33.4 2.96,m 1.86,m 33.4
24 2.55,m 41.0 2.56,m 40.8 2.53, m 41.3 2.53,m 41.3
25 46.9 47.1 47.1 47.1
26 3.72,s 78.0 3.72,s 74.8 3.77,d, (6.9) 78.3 3.76,d (6.8) 78.3
28 4.03,m; 3.27,m 53.3 4.1,m; 3.14m 53.5 4.03,dd, (12.0 6.9) 3.32,q,
29 2.06,m; 2.00,m 26.2 2.06,m; 2.00,m 26.1 2.50,m 2.30, m 26.4 2.50,m 2.30,m 30 1.95,m; 1.45,m 24.2 1.95,m; 1.45,m 25.7 2.03,m 1.54, m 24.2 2.03,m 1.58,m
31 2.30,m 28.3 2.30,m 28.2 2.35, m 28.4 2.36,m 28.4
32 6.29,m 142.3 6.43,m 140.4 6.34,dt (10.8,
6.8)
142.8 6.34,dt (11.6 6.8) 142.8 33 5.39,t,(7) 123.5 5.25,t (9.2) 128.2 5.42,t (9.8) 123.3 5.40,t (9.6) 123.4
34 4.94,m 57.0 58.0 4.98,brq, (6.9) 57.4 4.96,brq (6.0) 57.5
Figure 9 IR spectra of compound 2. A. NH stretching, 3460 cm-1. B. OH stretching, 3276 cm-1. C. Csp2-H, 3005 cm-1. D. Csp3-H, 2927 and 2854 cm
-1
. E. conjugated alkene, 1654 cm-1. F. Isolated alkene, 1560 cm-1. G.-CH bending, 1456 cm-1. H.-CH2 bending, 1419 cm-1. I. C-N stretching, 1234 cm-1. J. C-O stretching, 1074 cm-1. K. NH bending, 1544 cm-1. L. substituted aromatic ring, 771 and 731 cm-1.
Figure 1113C-NMR of compound2
Based on data above and the reported spectroscopic data the two compounds were confirmed as Manzamine A and 8-OH Manzamine A [13-14].
CONCLUSION
Two bioactive compounds were obtained from chloroform fractions of spongesPetrosia sp. Based on spectroscopic data, TLC co-chromatography with authentic samples and comparison with reported data, compound 1 and 2 were identified
as Manzamine A and 8-OH Manzamine A,
respectively.
ACKNOWLEDGEMENT
Indonesia Toray Science Foundation 2003 for providing the grant
Figure 10.1H-NMR spectra of compound2
REFFERENCES
1. Anonim, 2004,Bidi, 2, 4
2. Bergquist, P.R., 1978,Sponges, Hutchinson and Company, London, p.268
3. Edrada, R.U., Proksch, P., Wray, V., Witte, L., Muller, W.E.G., and Van Soest, R.W.M., 1996, J.Nat.Prod., 59, 1056-1060
4. Ang, K.K.H., Holmes, M.J., Higa, T., Hamann, M.T., and Kara, U.A.K., 2000, Antimicrob. Agents Chemother., 1645-1649
5. El Sayed, K.A., Kelly, M., Kara, U.A.K., Ang, K.K.H., Dunbar, D.C., Khan, A.A., and Hamann, M.T., 2001, ,J.Am. Chem.Soc., 123,1804-1808 6. Breton, J.J., and Chabot-Fletcher, M.C., 1997,J.
Pharmacol. Exp. Ther., 282, 459
7. Nakamura, H., Deng, S., Kobayashi, J., Ohizumi, Y., Tomotake, Y., Matsuzaki, T., Hirata, Y., 1987,Tetrahed. Lett., 28, 621
8. Tasdemir D., Mangalindan, G.C., Concepcion, G.P., Verbitski, S.M., Rabindran, S., Miranda, M., Greenstein, M., Hooper, J.N., Harper, M.K., and Ireland, C.M., 2002, , J. Nat. Prod., 65 (2), 210-214
9. Alam, G., Sari, D., dan Astuti, P., 2003,Majalah Obat Tradisional, 8, 25, 20-24
10. Astuti, P., Alam, G., Wahyuningsih, M.S.H., Sari, D., and Wahyuono, S., 2005a, Majalah Farmasi Indonesia, 16(1), 58-62
11. Astuti, P., Alam, G., Junaedi, S., Ikawati, M., and
Wahyuono, S., 2005b., Media Farmasi,
submitted
12. Astuti, P., Alam, G., Junaedi, S., Ikawati, M., and Wahyuono, S., 2005c, Indonesian Journal of Biotechnology, submitted
13. Ichiba, T., Sakai, R., Kohmoto, S., and Saucy, G., 1988, ,Tetrahed. Lett., 29, 25, 3083-3086 14. Ichiba, T., Corgiat, J.M., and Scheuer, P.J.,
1994, ,J. Nat.Prod., 57, 1, 168-170