Liquidity Analysis And Information Component Of Frequently-Traded Stocks During Bullish And
Bearish Market In Indonesia Stock Exchange (Idx)
Josephine Sudiman David Allen
School of Accounting, Finance, and Economic, Edith Cowan University, Joondalup, 6027 WA Australia
Abstract
This paper studies the liquidity pattern and information component cost of 10 stocks which are traded in Indonesia Stock Exchange during 2007 -2008. Liquidity analysis is particularly focused on net order imbalance between 2 tick sizes while the information component cost is calculated using the difference of buyers and sellers’ valuation at various hypothetical trade size. During the bearish market, it is shown that the frequency of smaller order size is greater in as traders are more cautious in their order placement. Although, buyer-initiated trades seem to be slightly higher in the bullish market, there are more shares available to sell during this period. Except for large order size (>10,000 shares), the influence of net trading frequency at different order size on net order imbalance does not show convincing result. However, for large order size, it indicates that the same amount of net trading frequency will create higher order imbalance in bullish market rather than in bearish market which further imply that the degree of heterogeneous belief among traders are bigger in the bullish market. From information component cost, 3 stocks (ANTM, TLKM and UNTR) have consistent and small information component cost and 1 stock (AALI) appears to have the highest information component cost. In addition, there is evidence of significant difference in the mean of information component between these 2 periods of observation.
Keywords:Liquidity, Information component, Bearish and Bullish market
1. Introduction
This paper will be arranged as follows. First, it will present the literature review for liquidity and information component followed by general description of IDX trading mechanism and performance. After that, the methodology and data used for this study will be portrayed. Finally, the result will be communicated. The first part of the result will provide descriptive statistics of trade price, spread, bid and ask size at different level market depth, proportion of trading frequency under different trade size, buyer-initiated and seller-initiated, net order imbalance and price duration. The second section will inform about OLS estimation of net order imbalance on frequency of different order size (500,501- 2500, 2501-10000 and >10000 shares) with the purpose to examine the impact of different order size on net order imbalance. Finally, the calculation of information component at six hypothetical trade size (2500,5000,7500,10000,12500 and 15000 shares) will be shown.
2. Literature Review
2.1 Liquidity
In a nutshell, liquidity is the ability to buy and sell a particular amount of an asset during the trading period without having significant impact on the asset price. It is an important issue in market microstructure theory and concerns issuers, market traders and regulators due to its close relationship with asset pricing and traders’ behaviour. It is crucial for equity issuers because traders take account of the cost of trading when valuing financial assets. The rationale is straightforward; when traders want to sell their stocks at the same time, illiquid stocks cost them more so they discount their value. Amihud, Mendelson, & Pedersen (2005) show that a reduction in liquidity will result in price reduction. Thus the cost of capital for companies with illiquid stocks is higher than for companies with frequently-traded stocks. Market traders also prefer to participate in liquid markets since they have lower trading costs and subsequently achieve better actual returns for their portfolios. Liquidity is important for regulators because it can encourage the efficient flow of funds among capital suppliers and demanders, leading to higher trading activity and immediate price discovery.
Liquidity is certainly a subtle and complex concept which can be interpreted into different ways. For these reasons, there are various quantification methods which can usually be categorized into order-based and trading-based measurements (Aitken & Comerton-Forde, 2003). They argue that the latter does not signal future liquidity but only indicates past liquidity because it only employs measures of previous trading activity such as volume, value, frequency, and turnover. Therefore, it is not sufficient to assess incoming liquidity based solely on trading-based proxies. However, these proxies were popular among researchers in the 1990’s because the data is readily available and easily observable over the long-run. Lhabitant & Gregoriou (2007) define liquidity as the change in the observed price corresponding to the change in the observed volume. In this context, liquidity is seen as a dynamic and elastic process which is influenced by trading activity. According to Harris (2003), liquidity presents in three dimensions, time, price and size. Time dimension (immediacy) is about the possibility of buying and selling whenever the traders are willing to do so. The less time needed to sell or to buy stocks, the more liquid the stocks are. Price dimension (spread) means the difference between bid and ask prices; liquid stocks will have narrow spread indicating that the trading cost for such stocks is relatively low. Spread is useful for measuring the immediate trading cost for a certain number of orders which are readily tradeable at best prices. It is usually relevant for small and medium orders as it can misrepresent trading cost for large orders if there is insufficient depth in the order book. Size dimension (depth) can be interpreted as the midpoint quantity of the best bid and ask price or the number of orders waiting to be executed for different trading prices and generally useful for predicting the price impact of trades. Liquid stocks will have a high volume of units available for trading at a given price, so a large block of trading does not have significant price impact. Thus the appropriate proxy for measurement of liquidity proxy has to include dimensions of immediacy, spread and depth.
the price change per share of excess demand over a fixed interval of time. However, as stated by Engle & Lange (2001), this approach should not be followed for these reasons: (1) excess volume of demand can be positive or negative, (2) the price discreteness problems arise at numerator, (3) the time internal should be long while using long intervals which will reduce the statistical ability to capture the short-run dynamics and (4) the possibility that demand change is zero is high.
2.2 Information Component
Rakowski & Beardsley (2008) have another approach to decompose information and non-information component in pure order driven market INET ECN. Their method of using spread and depth of limit order book enriches the existing decomposition model which is mainly designed for quote-driven market. Their work is motivated by illiquidity measurement model of Domowitz, Hansch, & Wang (2005) and the concept is as follows. Market liquidity is defined as the difference between seller’s posted price and buyers’ posted price or the order imbalance between supply and demand at particular time. In other words, they measure liquidity from the closeness of supply to demand, which is written as follow:
l(Q) = , where the smaller value indicates a tighter relationship between supply and demand, and thus the greater the liquidity.
Rakowski & Beardsley made several assumptions, i.e (1) the difference between buyer’s and seller’s valuation (information asymmetry component) is always positive (2) the difference in valuation is large at the top of the book and converges later, (3) the buyers always posted a price which is lower than their valuation and the sellers always posted a price which is higher than their valuation; the difference between sellers’ (buyers’) valuation and sellers’ (buyers’) posted price is called non-information component of sellers (buyers) and (4) the average net order processing cost for buyers and sellers is alike.
Using this model, they found that asymmetric information component of liquidity is large near the inside quotes and converges towards zero beyond it. This pattern is noticeable for low-volume and high-priced stocks. They also found that asymmetric information is dispersed throughout the order book for active stocks while for inactive stocks it is clustered which is the result of inability to “hide” orders amongst liquidity providers of inactive stocks since there is no sufficient number of orders present and result in the aggressively priced and marketable limit orders. For transaction cost per share, the most actively traded stocks experience rapid decrease until 1000 shares before it gradually decrease, and for the most inactive stocks, it also decrease rapidly until 600 shares but then it slowly increase before reaching a constant level about 4200 shares and higher.
The critical point of the article of Rakowski & Beardsley is the way they determine the expected valuation of sellers and buyers at time 0 is based on the order book information after 30 transactions for all data. They do not provide further justification/reasoning for this. Since stock characteristics and trading rules might affect the expected valuation of sellers and buyers at a particular time, this procedure can be misleading. Thus, it is necessary to examine the speed of adjustment to information for an individual stock. Husodo & Henker (2007) using the speed of adjustment model of Theobald & Yallup (2004) found that generally 50 most liquid stocks in Jakarta stock exchange during 2000 – 2004 adjust fairly to new information between 90 – 120 minutes. Theobald & Yallup extend the work of Amihud & Mendelson (1987) to determine the coefficient of speed of adjustment of price converging to the intrinsic value.
If ; this means price is fully adjusted to its intrinsic value . If ; this means that price underreact to new information.
Add :
Since = , thus:
Given the assumption that ; where is the mean of expected rate of return plus the disturbance error, the following equation will be derived by Theobald & Yallup:
This modelling structure are reflected as ARMA (1,1) process. When there is full adjustment, the process will be MA (1) process or the noise that derives the return process. The stationarity assumption will be satisfied if ; the condition which is also imposed by Amihud & Mendelson to ensure that prices were finite.
3.Institutional Details
3.1 IDX Trading Mechanism
Similar to many stock markets, the IDX trading rules require potential investors to be a member of a securities company before they can trade in the market. At present, the Indonesian government allows foreign and domestic investors to own up to 100% of shares with the exception for foreign investors who can only hold listed stocks in the banking industry to a maximum of 99%. After the administration process and submission of the initial deposit, an investor will obtain approval to make their first trade. The minimum unit for selling and buying in the regular and cash market is 1 lot which consists of 500 shares. Orders can be submitted by contacting brokers or online. After investors contact their brokers to give instruction to buy and sell shares, they need to inform their clients within 24 hours if the order has been fulfilled. In the regular market, every matched transaction should be settled within 3 days, a process which is known as T+3. In the cash market, the settlement is conducted on the same day while for the negotiated market, the settlement process depends on the agreement between brokers and the transaction will not be guaranteed by the Indonesian Clearing and Guarantee Corporation (KPEI in Indonesian acronym). In regular and cash markets, KPEI ensures that all trades have a proper settlement process. IDX also has a custodian agency which is called the Indonesian Central Securities Depository (KSEI in Indonesian acronym). The transaction cost for buying orders varies from 0.25% to 0.35% depending on the facilities provided by the securities companies. The cost of a selling order is higher because the government applies 0.1% of income taxation which is deducted directly from the seller account.
Following the Circular Letter No. SE-001/BEJ/06-2007, the minimum price for stock traded in the regular board of IDX has increased from IDR-25 on January 3, 2005 to IDR-50 per share on 18 June 2007. In regard to block trading, IDX applies the following rules from December 22, 2006; the maximum quantity for order submission for both regular and cash market is limited to maximum 5,000,000 shares (10,000 lots) or 5% of shares outstanding for particular stocks. Similar to odd lot orders, traders who submit orders exceeding these size limits have to use a negotiated market with a non-continuous auction execution system.
The pre-opening price will be the opening price at the beginning of the trading session for the regular and the cash markets. The pre-opening system began on February 3, 2004 for LQ 45 stocks and by February 1, 2008 there are already 81 stocks included. The auto rejections limit which is applied in the pre-opening session and the percentage is based on the previous price or the offering price (Table 1). For the stocks without a pre-opening price, the following options exist: a previous, a theoretical, an initial or a fair price based on valuations by independent stock market experts. All unmatched bids and asks orders will be kept in the order book for first session trading provided they do not reach the auto rejection limit and the auto rejection for the first and second sessions of the regular market is based on the opening price.
Table 1. Auto rejections limit
Previous Price of Regular Market Share Price (P) - IDR Auto Rejection Percentage
P <= 100 50 %
100< P < = 500 35 %
500 < P < = 2500 30 %
2500 < P <= 5000 25 %
P > 5000 20 %
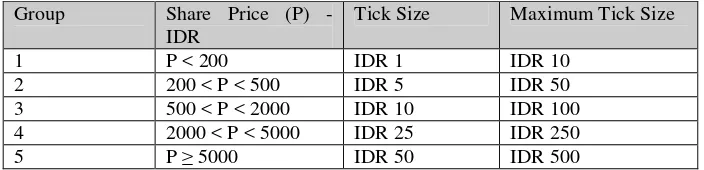
The order book records the number of market orders in descending prices for bids and in ascending prices for asks. JATS will continue to process all bids and asks orders based on price priority which means that higher bids and lower asks will be given priority. Moreover, if there is more than one bid or ask at the same price, the one that was submitted first will be given priority because of the time precedence rule. Tick size and maximum price step for trading in the regular market is shown in Table 2 below.
Table 2. Tick Size and Maximum Tick Size
Group Share Price (P)
-IDR
Tick Size Maximum Tick Size
1 P < 200 IDR 1 IDR 10
2 200 < P < 500 IDR 5 IDR 50
3 500 < P < 2000 IDR 10 IDR 100
4 2000 < P < 5000 IDR 25 IDR 250
5 P≥5000 IDR 50 IDR 500
3.2 IDX Performance in 2007- 2008
Based on the Minister of Law Decree Number C-04552 HT TH 2007, Indonesia has one stock exchange arising from a merger between the Jakarta Stock Exchange (JSX) and Surabaya Stock Exchange (SSX). JSX was established in colonial times and was reactivated in 1977 to serve customers for equities market while SSX was formed in 1989 mostly for bonds and derivative products. SSX ceased to exist by November 30, 2007 and all the activities were moved to the JSX. The merger was concluded on December 3, 2007 and the name changed to Indonesia Stock Exchange on January 1, 2008. Although originally proposed during trading declines in the Asian crisis, the main purpose of the merger as indicated in the 2006 Financial Sector Policy Package was to create more synergy and efficiency in the Indonesian capital market.
shows the changes of closing composite index at IDX during period 2007 – 2008 which picture the bullish market for 2007 and bearish market for 2008.
Figure 1. Closing Composite Index 2007 - 2008
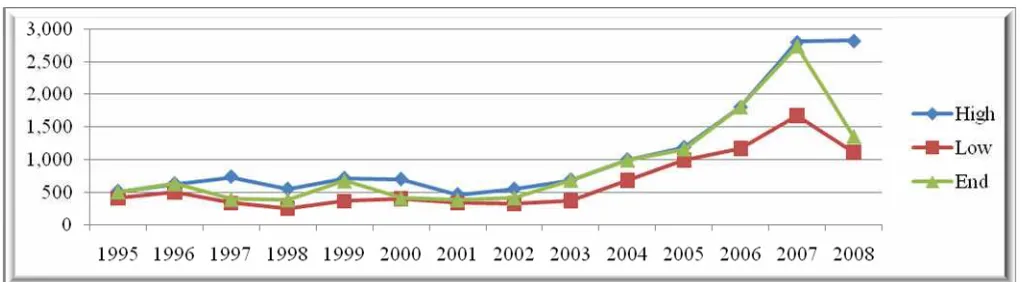
During 2008, there were 6 delisted companies, 13 new listing companies and 1 relisting company with total market capitalization of IDR 1,076,491 billion for 398 listed companies with 1,374,412 million shares (Figure 2). By the end of 2008, there have been 383 active stocks and 121 active brokerage houses. Figure 3 illustrates that the IDX share index ended 2008 is much lower than in 2006 and 2007. The top 20 losing stocks in 2008 lost more than 80% of their price, ranging from 82.86% to 96.48% and the increase range for top 20 gaining stocks was 34% to 197.38%.
Figure3. Market Capitalization (in Millions) and Listed Shares (in Thousands) 1995 - 2008
4. Methodology
Engle’s model of net order imbalance is formally written as: , the summation of (the direction of trade indicator) and (the number of shares traded) within a given price duration. This study will use the amount of net order imbalances measured in volume and frequency over the changes of midpoint as much as 2 tick sizes as the measurement of price increment. For example, the initial midpoint is IDR 4925 and the tick size for price ranging from IDR 2000 – 5000 is IDR 25, thus if next midpoint is IDR 4975, the volume bought minus sold from the initial of IDR 4925 to IDR 4975 is calculated as VNet. If the continuing midpoint is IDR 5000 and the tick size for price is greater or equal to IDR 5000 is IDR 50, the tick size that will take into account now is IDR 50. Thus, VNet will be calculated if next midpoint is IDR 4900 or IDR 5100. Beside VNet, the duration between the changes of 2 tick size (PDUR) and standard deviation of trade price over the changes of 2 tick size midpoint (PSDEV) is also calculated. Since trading hours in Indonesia stock exchange is divided into morning and afternoon session and the trading hours is different on Friday, we exclude data if the price duration (PDUR) is greater or equal to 1.5 hours (5400 seconds). The purpose of having the value of VNet, Price Duration and Standard deviation of trade price is to further examine whether informed traders prefer particular trading size to “hide” their information.
For measuring information component during bearish and bullish market, this paper employs the method of Rakowski & Beardsley with is the liquidity measurement, as the non-information component, is the information component, and is the hypothetical size is intended to measure, k and k” are the last step at the ask side and the bid side up to when hypothetical size Q accumulated, A (B) is the ask (bid) price up to step k (k”), the model can be written as:
5. Data
during the period of analysis (January 2007 – December 2008). Eventually, we also eliminate 2 other companies for relatively insufficient trading activities and corporate action, i.e KLBF – Kalbe Farma, Tbk and BLTA – Berlian Laju Tanker, Tbk.
Table 3. Brief summary of the sample company
No. Ticker Symbol
Stock Name Industry Classification Listing Date
1 AALI Astra Agro Lestari, Tbk Agriculture/ Plantation Dec 9, 1997
2 ANTM Aneka Tambang, Tbk Mining/ Metal & Mineral Mining Nov 27, 1997 3 ASII Astra International, Tbk Machinery & Heavy Equipment/
Automotive and Components.
April 4, 1990
4 INDF Indofood Sukses Makmur, Tbk Consumer Goods/ Food & Beverages July 14, 1994 5 INKP Indah Kiat Pulp & Paper Corp, Tbk Basic Industry & Chemicals/ Pulp & Paper July 16, 1990 6 ISAT Indosat, Tbk Infrastructure, Utilities & Transportation/
Telecommunication
Oct 19, 1994
7 MEDC Medco Energi International, Tbk Mining/ Crude Petroleum & Natural Gas Production
Oct 12, 1994
8 SMCB Holcim Indonesia, Tbk Basic Industry & Chemicals/ Cement Aug 10, 1997 9 TLKM Telekomunikasi Indonesia, Tbk Infrastructure, Utilities & Transportation/
Telecommunication
Nov 14, 1995
10 UNTR United Tractors, Tbk Trade, Services & Investment/ Wholesale (Durable & Non-Durable Goods)
Sept 19, 1989
The data from this paper is obtained from Reuters Database Tickscope History (RDTH). For trading details, RDTH provides with ticker symbol of share, date and time of trading, bid size and price, ask size and price, trade price, trade volume and volume weighted average price (VWAP). Meanwhile, for market depth, RDTH gives ticker symbol of a share, date and time of each new quote, bid size and price for up to 5 levels and ask size and price for up to 5 levels.
Period of observation: 86trading days Time of observation :9.30 – 16.00local time
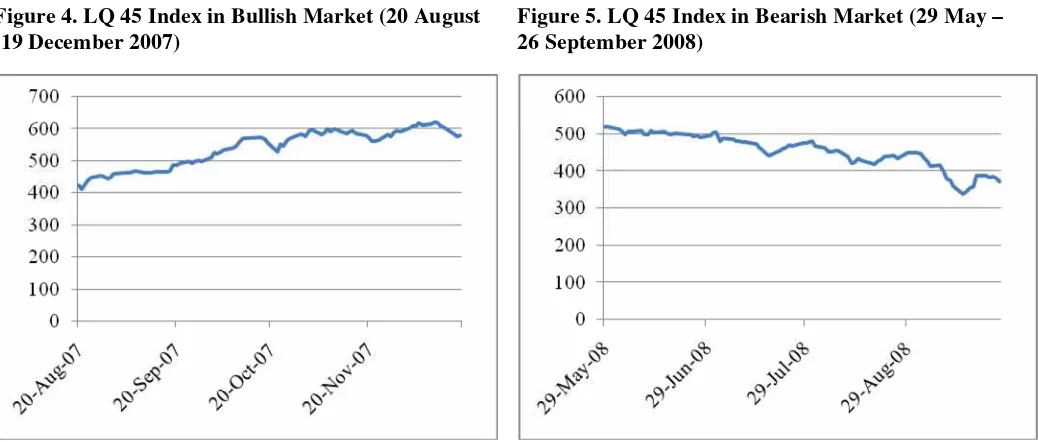
The price movement for all stocks included in LQ 45 Index during bullish and bearish market can be seen in Figure 4 and 5.
Figure 4. LQ 45 Index in Bullish Market (20 August -19 December 2007)
6. Result
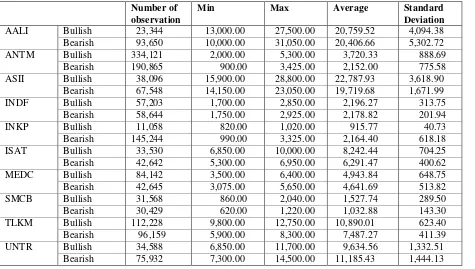
During period of observation, each of stocks has different price movement. Generally, all stocks show the strong pattern of upward price movement during bullish market except for INKP and TLKM. Meanwhile the pattern for downward price movement is obvious for AALI and ANTM, while most of stocks indicated moderate downward of price movement with the exception of ISAT and TLKM. Descriptive statistics of trade price during the period of observation can be seen in the table 4.
Table 4. Descriptive statistics of trade price
Number of observation
Min Max Average Standard
Deviation
Bullish 23,344 13,000.00 27,500.00 20,759.52 4,094.38
AALI
Bearish 93,650 10,000.00 31,050.00 20,406.66 5,302.72
Bullish 334,121 2,000.00 5,300.00 3,720.33 888.69
ANTM
Bearish 190,865 900.00 3,425.00 2,152.00 775.58
Bullish 38,096 15,900.00 28,800.00 22,787.93 3,618.90
ASII
Bearish 67,548 14,150.00 23,050.00 19,719.68 1,671.99
Bullish 57,203 1,700.00 2,850.00 2,196.27 313.75
INDF
Bearish 58,644 1,750.00 2,925.00 2,178.82 201.94
Bullish 11,058 820.00 1,020.00 915.77 40.73
INKP
Bearish 145,244 990.00 3,325.00 2,164.40 618.18
Bullish 33,530 6,850.00 10,000.00 8,242.44 704.25
ISAT
Bearish 42,642 5,300.00 6,950.00 6,291.47 400.62
Bullish 84,142 3,500.00 6,400.00 4,943.84 648.75
MEDC
Bearish 42,645 3,075.00 5,650.00 4,641.69 513.82
Bullish 31,568 860.00 2,040.00 1,527.74 289.50
SMCB
Bearish 30,429 620.00 1,220.00 1,032.88 143.30
Bullish 112,228 9,800.00 12,750.00 10,890.01 623.40
TLKM
Bearish 96,159 5,900.00 8,300.00 7,487.27 411.39
Bullish 34,588 6,850.00 11,700.00 9,634.56 1,332.51
UNTR
Bearish 75,932 7,300.00 14,500.00 11,185.43 1,444.13
Spread seems to be low during bearish market because the average stock price is lower and thus the allowable difference between bid and ask price (tick size) is also small. However, when the spread is compared to the trade price, it is found that the proportion is higher during bearish market for 5 stocks (ANTM, INDF, ISAT, SMCB and TLKM), similar for 2 stocks (ASII and AALI) and smaller for 3 stocks (INKP, MEDC, UNTR) which is shown in Table 6. INDF and INKP seems to be the most expensive stocks to trade frequently as the proportion is about 1% followed by ANTM, ISAT, MEDC, and SMCB. While UNTR and TLKM are traded at relatively low cost, ASII and AALI have the lowest trading cost among these 10 companies.
Table 5. Percentage of spread to trade price
% of spread to trade
price AALI ANTM ASII INDF INKP ISAT MEDC SMCB TLKM
UNT R
Bullish 0.35% 0.69% 0.29% 0.90% 1.13% 0.63% 0.75% 0.68% 0.46% 0.55%
Bearish 0.30% 0.81% 0.30% 1.03% 0.88% 0.81% 0.73% 0.99% 0.68% 0.47%
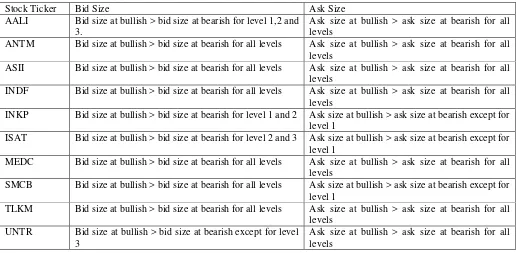
The average of ask size and bid size are compared during bullish and bearish market for each level of market depth and the result is shown in Table 6.
Table 6. Comparison of ask size and bid size at different level of market depth
AALI Ask size > bid size for all levels Bid size > ask size for all levels
ANTM Ask size > bid size for all levels Bid size > ask size, except for level 1,2, and 5 ASII Ask size > bid size for all levels Bid size > ask size, except for level 4 and 5 INDF Ask size > bid size for all levels Bid size > ask size for level 1 only
INKP Ask size > bid size for level 5 only Bid size > ask size for level 1, 2 only ISAT Ask size > bid size for all levels Bid size > ask size for level 1 only MEDC Ask size > bid size for all levels Ask size > bid size for all levels SMCB Ask size > bid size except for level 1 Ask size > bid size for all levels TLKM Ask size < bid size for all levels Ask size > bid size for all levels UNTR Ask size > bid size for all levels Bid size > ask size for level 1 only
Given more shares available to sell during bullish market might indicate two things. First, traders believe that true price of these stocks is already overvalued during bullish market. Therefore, traders who have these stocks are willing to offer their shares to sell. Similarly, traders who do not have these stocks but expect their price to decrease will do short sell as it is allowed. Second, this profit-taking activity might be caused by the disposition effect where traders are willing to sell their stocks as long as they already make some profit out of it. During bearish market, the condition is not as convincing as the bullish market. In general, bid size is bigger than ask size for lower level of depth for 7 companies while for the rests show the opposite.
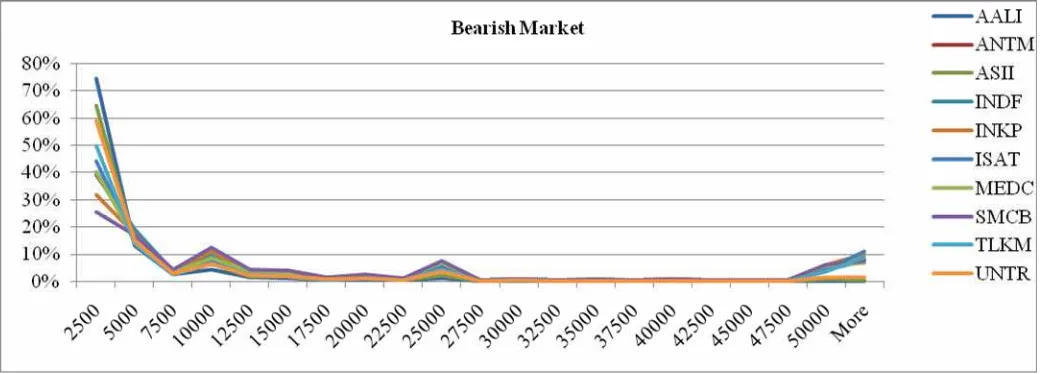
When the bid size during bullish market is compared to that of bearish market, most shares show that the bid size in the former is bigger than the later, as shown in Table 7. The result is fairly similar when ask size of bullish market is compared to that of bearish market. As the result, shares which are traded in bigger size are more frequent in bullish market rather than bearish market, as shown in Figure 6 and 7. This fact can also be interpreted as the caution as traders are relatively vigilant during bearish market because lack of confidence about future price of shares and the placement of large order size might create bigger market sentiment in bearish market condition. Table 7. Comparison of bid size ( and ask size) at different level during bullish and bearish market
Stock Ticker Bid Size Ask Size
AALI Bid size at bullish > bid size at bearish for level 1,2 and 3.
Ask size at bullish > ask size at bearish for all levels
ANTM Bid size at bullish > bid size at bearish for all levels Ask size at bullish > ask size at bearish for all levels
ASII Bid size at bullish > bid size at bearish for all levels Ask size at bullish > ask size at bearish for all levels
INDF Bid size at bullish > bid size at bearish for all levels Ask size at bullish > ask size at bearish for all levels
INKP Bid size at bullish > bid size at bearish for level 1 and 2 Ask size at bullish > ask size at bearish except for level 1
ISAT Bid size at bullish > bid size at bearish for level 2 and 3 Ask size at bullish > ask size at bearish except for level 1
MEDC Bid size at bullish > bid size at bearish for all levels Ask size at bullish > ask size at bearish for all levels
SMCB Bid size at bullish > bid size at bearish for all levels Ask size at bullish > ask size at bearish except for level 1
TLKM Bid size at bullish > bid size at bearish for all levels Ask size at bullish > ask size at bearish for all levels
UNTR Bid size at bullish > bid size at bearish except for level 3
Figure 6. Proportion of trade frequency under different trade size in bullish market
Figure 7. Proportion of trade frequency under different trade size in bearish market
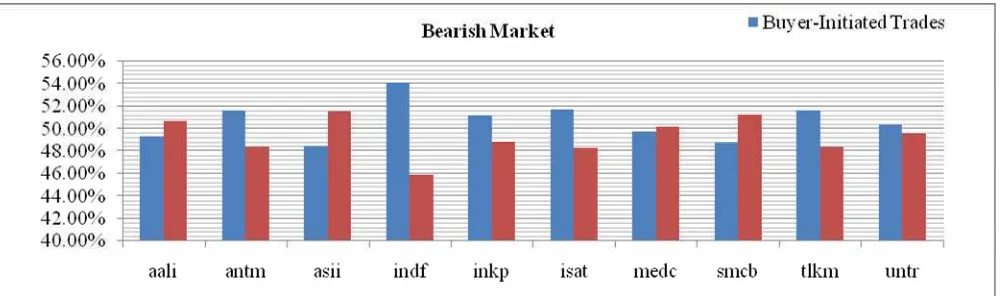
Figure 8. Proportion of buyer initiated and seller initiated trades in bullish market
Figure 9. Proportion of buyer initiated and seller initiated trades in bearish market
The average VNET (net order imbalance in absolute value of volume over 2 tick size changes), average PDUR (price duration – in seconds) and average PSDEV (standard deviation of trade price over 2 tick size changes) for each stock can be seen in the table 8. ANTM, INDF, ISAT and MEDC have noticeable net order imbalance during bullish and bearish market and it is higher during bullish market for ANTM, INDF and MEDC. The duration that takes place for midpoint quote to change is from the lowest of 496 seconds for AALI to the highest of 1743 seconds for INKP with strong difference is visible for INKP. The standard deviation of trade price during the changes of midpoint quote of 2 tick sizes are half for ANTM and MEDC, while for other stocks are qualitatively similar.
Table 8. Mean of VNET, PDUR and PSDEV
Number of observation
VNET PDUR PSDEV
Bullish 1116 38,665 652 30.89
AALI
Bearish 2119 44,354 496 31.96
Bullish 367 5,495,015 1061 14.02
ANTM
Bearish 395 2,011,684 935 7.39
Bullish 1504 78,928 540 28.71
ASII
Bearish 1286 71,895 616 29.88
Bullish 181 2,013,597 1383 9.11
INDF
Bearish 226 605,157 1022 7.63
Bullish 53 1,117,311 1743 5.52
INKP
Bearish 992 989,376 661 8.32
Bullish 293 463,208 1196 27.94
ISAT
Bearish 149 1,260,154 1513 27.55
Bullish 413 1,069,350 1014 19.6
MEDC
Bullish 407 662,913 976 5.76 SMCB
Bearish 160 596,338 1510 5.92
Bullish 270 1,267,320 1400 27.91
TLKM
Bearish 211 1,499,820 1495 27.05
Bullish 377 246,035 1318 28.60
UNTR
Bearish 721 166,310 877 30.39
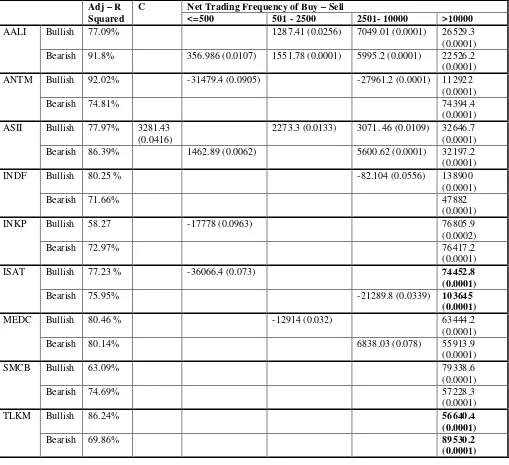
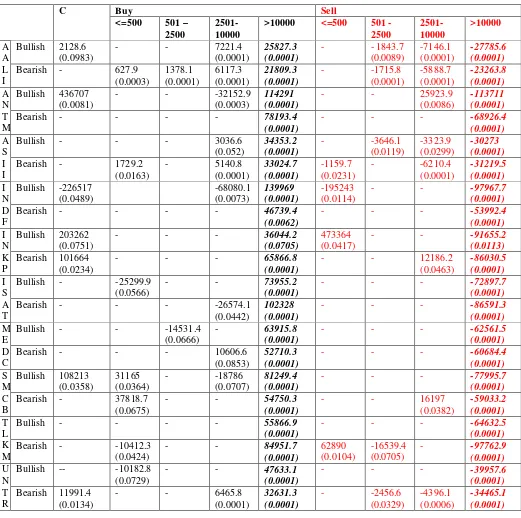
To examine further whether the trading frequency at different order size can explain the VNET, PDUR, PSDEV. Trading frequency is classified into 4 categories of trade size (<=500, 501-2500, 2501- 10000 and more than 10000). Then, the value of each trading frequency during one interval of midpoint quote changes is regressed toward the value of VNET, PDUR and PSDEV. The result as shown in Table 9 suggests that trading frequency can only explain the VNET but not for PDUR and PSDEV and for this reason, we only show the regression coefficient of VNET. As shown in Table 10, the regression coefficient of net trading frequency of buy over sell is less during bearish market except for ISAT and TLKM (both are telecommunication companies). This indicates that the same amount of net trading frequency will create higher order imbalance in bullish market rather than in bearish market. This might indicate the degree of heterogeneous belief among traders seems to be bigger in the bullish market. Table 9. OLS Result of VNet on Different Net Trading Frequency
Net Trading Frequency of Buy – Sell Adj – R
Squared C
<=500 501 - 2500 2501- 10000 >10000
Bullish 77.09% 1287.41 (0.0256) 7049.01 (0.0001) 26529.3
(0.0001) AALI
Bearish 91.8% 356.986 (0.0107) 1551.78 (0.0001) 5995.2 (0.0001) 22526.2 (0.0001)
Bullish 92.02% -31479.4 (0.0905) -27961.2 (0.0001) 112922
(0.0001)
2273.3 (0.0133) 3071. 46 (0.0109) 32646.7 (0.0001) ASII
Bearish 86.39% 1462.89 (0.0062) 5600.62 (0.0001) 32197.2
(0.0001)
Bullish 80.25 % -82.104 (0.0556) 138900
(0.0001) INDF
Bearish 71.66% 47882
(0.0001)
Bullish 58.27 -17778 (0.0963) 76805.9
(0.0002) INKP
Bearish 72.97% 76417.2
(0.0001)
Bullish 77.23 % -36066.4 (0.073) 74452.8
(0.0001) ISAT
Bearish 75.95% -21289.8 (0.0339) 103645
(0.0001)
Bullish 80.46 % -12914 (0.032) 63444.2
(0.0001) MEDC
Bearish 80.14% 6838.03 (0.078) 55913.9
Bullish 78.61 % -8391. 73 (0.0055)
45005.3 (0.0001) UNTR
Bearish 86.65% 5546.85 (0.0001) 34598.6
(0.0001)
When the value of VNET is regressed on different trading frequency of buy and sell, similar result is found, as shown in Table 11, that is trading frequency at higher order size can explain the net order imbalance better with consistent sign and relatively comparable coefficient between buy and sell side. In addition, the coefficient regression of trading frequency with order size more than 10,000 shares is generally lower under bearish market for most stocks except for ISAT and TLKM.
Table 11. OLS Result of VNet on Different Types of Trading Frequency
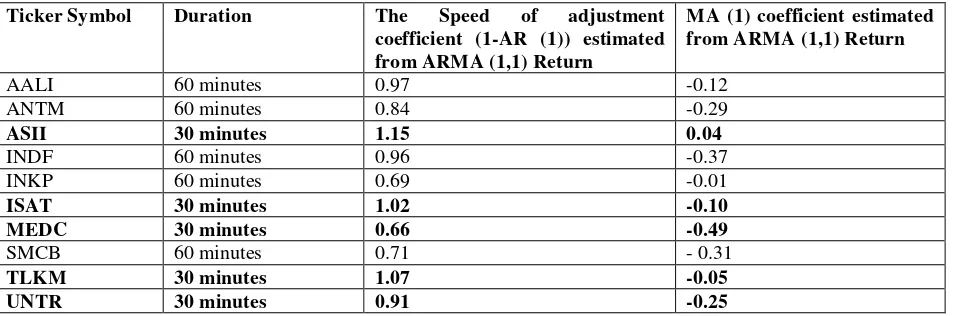
This paper use the speed of adjustment coefficients from Husodo & Henker (2007) for 8 of 10 companies and the rest (INKP and SMCB) is calculated using the data from the period of observation. The calculation of informational component for these companies will use 30 minutes and 60 minutes interval, as shown as Table 12.The choice of 30 and 60 minutes depend on the result of ARMA (1,1) estimation. Briefly, the speed of adjustment which is close to 1 and higher negative MA (1) coefficient is the benchmark. Stocks with higher trading activity seem to have shorter duration for compounding news into price.
Table 12. ARMA (1,1) Coefficient
Ticker Symbol Duration The Speed of adjustment
coefficient (1-AR (1)) estimated from ARMA (1,1) Return
MA (1) coefficient estimated from ARMA (1,1) Return
AALI 60 minutes 0.97 -0.12
ANTM 60 minutes 0.84 -0.29
ASII 30 minutes 1.15 0.04
INDF 60 minutes 0.96 -0.37
INKP 60 minutes 0.69 -0.01
ISAT 30 minutes 1.02 -0.10
MEDC 30 minutes 0.66 -0.49
SMCB 60 minutes 0.71 - 0.31
TLKM 30 minutes 1.07 -0.05
UNTR 30 minutes 0.91 -0.25
This paper uses six hypothetical trading sizes, i.e 2500, 5000, 7500, 10000, 12500 and 15000 shares which approximately cover about 60-80% of all trade sizes occurred in the period of observation. As can be seen from Table 13. ANTM, TLKM and UNTR have consistent and small information component cost whilst AALI appears to have the highest information component cost. In addition, T-test of paired two sample means indicate that information component cost is significantly different between these 2 different periods of observation, as shown in Table 14.
Table 13. Adjusted information component cost at 15,000 shares *
AALI ANTM ASII INDF INKP ISAT MEDC SMCB TLKM UNTR
Bearish 1.273 1.027 1.091 1.101 1.124 1.106 1.089 1.157 1.026 1.076
Bullish 1.616 1.039 1.305 1.050 1.040 1.028 1.049 1.043 1.017 1.083
*) Information component cost at 2500 shares = 1
Table 14. T-test for Mean Comparison of Information component cost
Description Bullish Bearish
Mean 40.739 46.561
Variance 884.215 858.579
Observations * 60 60
df 59 59
t Stat -3.812065783
P(T<=t) one-tail 0.000165783
t Critical one-tail 1.671093033
P(T<=t) two-tail 0.000331565
t Critical two-tail 2.000995361
References
Aitken, M., & Comerton-Forde, C. (2003). How should liquidity be measured? Pacific-Basin Finance Journal, 11(1), 45-59.
Amihud, Y., & Mendelson, H. (1987). Trading mechanisms and stock returns: an empirical investigation.Journal of Finance, 42(3), 533 - 553.
Amihud, Y., Mendelson, H., & Pedersen, L. H. (2005). Liquidity and asset prices. Foundations and Trends in Finance, 1(4), 269-364.
Domowitz, I., Hansch, O., & Wang, X. (2005). Liquidity commonality and return co-movement. Journal of Financial Markets, 8(4), 351-376.
Engle, R. F., & Lange, J. (2001). Predicting VNet: A model of dynamics of market depth. Journal of Financial Markets, 4(2), 113-142.
Harris, L. (2003).Trading and Exchanges. New York: Oxford University Press, Inc.
Husodo, Z. A., & Henker, T. (2007). Short-run behaviour of stock returns: Speed of adjustment and its contributing factors in the Jakarta stock exchange. fromhttp://papers.ssrn.com/sol3/papers.cfm?abstract_id=1010498 Lhabitant, F.-S., & Gregoriou, G. N. (2007).Stock Market Liquidity: John Wiley and Sons.
Rakowski, D., & Wang Beardsley, X. (2008). Decomposing liquidity along the limit order book. Journal of Banking & Finance, 32(8), 1687-1698.