Long-term record of atmospheric CO
2and stable isotopic ratios at
Waliguan Observatory: Seasonally averaged 1991–2002 source/sink
signals, and a comparison of 1998–2002 record to the 11 selected sites
in the Northern Hemisphere
Lingxi Zhou,1James W. C. White,2 Thomas J. Conway,3Hitoshi Mukai,4
Kenneth MacClune,2 Xiaochun Zhang,1 Yupu Wen,1and Jinlong Li5
Received 11 December 2004; revised 4 December 2005; accepted 16 January 2006; published 5 April 2006.
[1] This paper investigates seasonally averaged atmospheric CO2source or sink signals
observed at Waliguan Baseline Observatory (WLG, 36170N, 100540E, 3816 m asl) in
western China from 1991 to 2002. Both linear and geometric mean regressions as
well as statistical significance test were performed between detrended CO2 and stable
isotope monthly data by means of Keeling Model and Miller-Tans Model. The estimated
slopeDd13C/
DCO2due to the seasonality in CO2andd13C is (0.050 ± 0.004)%ppm1,
the mean source/sink isotopic signaturesds(i.e., d13Csandd18Os) are (26.159 ±
1.924)% and (7.662 ± 2.113)%, respectively, and the mean atmospheric d13C
discriminationddis(i.e.,dsminusdbg) where thedbgis the isotopic value of the background
atmosphere was (18.174 ± 1.959)% by the Keeling Model, in agreement with results
from other continental background sites in the Northern Hemisphere. We suggest that
exchange with terrestrial biosphere dominates the observed CO2,d13C andd18O seasonal
cycles at WLG. In addition, atmospheric CO2andd13C data from 11 selected NH sites in
the NOAA ESRL air sampling network from 1998 to 2002 were analyzed and compared to the WLG data for the same period to better address common and specific features observed in this region. The annual cycle amplitude differences, secular and seasonal Dd13C/
DCO2discrepancies among sites will be useful to better understand carbon uptake
and release especially on the Eurasian continent. The estimateddsduring certain times at
each specific site could possibly provide useful information on CO2 fluxes.
Citation: Zhou, L., J. W. C. White, T. J. Conway, H. Mukai, K. MacClune, X. Zhang, Y. Wen, and J. Li (2006), Long-term record of atmospheric CO2and stable isotopic ratios at Waliguan Observatory: Seasonally averaged 1991 – 2002 source/sink signals, and a
comparison of 1998 – 2002 record to the 11 selected sites in the Northern Hemisphere,Global Biogeochem. Cycles,20, GB2001, doi:10.1029/2004GB002431.
1. Introduction
[2] Stable CO2 isotope measurements combined with CO2 mixing ratio measurements in the atmosphere, can potentially be used to discriminate between different CO2 source and sink mechanisms [Bakwin et al., 1998; Miller
and Tans, 2003;Nakazawa et al., 1993, 1997a, 1997b]. The
Keeling Model (i.e., ‘‘Keeling Plot’’ approach) [Keeling, 1958, 1961], based on conservation of mass, is a method for relating changes in CO2andd13C to the isotopic signature of a source or sink adding or removing CO2 from the background CO2 mixing ratio and isotopic ratio. When analyzing atmospheric CO2 and d
13
C measurements, the most prominent feature is the negative correlation of d13
C with the CO2mixing ratio. This feature is often called the ‘‘Keeling relationship’’ and is commonly used to determine the13C signature of the source or sink (ds) causing the CO2 variability [Inoue and Sugimura, 1985;Pataki et al., 2003;
Trolier et al., 1996].
[3] As recorded in the literature [Friedli et al., 1987;
Miller et al., 2003;Miller and Tans, 2003;Randerson et al.,
2002], in the Keeling Model linear regression approach known traditionally as Keeling Model-I, the independent variable, x, (in this case the inverse of the atmospheric CO2 mixing ratio) is assumed to have no error and the errors in the dependent variable, y, (in this cased13
C of atmospheric
1Key Laboratory for Atmospheric Chemistry, Centre for Atmosphere
Watch and Services, Chinese Academy of Meteorological Sciences, China Meteorological Administration, Beijing, China.
2
Institute for Arctic and Alpine Research, University of Colorado, Boulder, Colorado, USA.
3
Global Monitoring Division, Earth System Research Laboratory, National Oceanic and Atmospheric Administration, Boulder, Colorado, USA.
4
Center for Global Environmental Research, National Institute for Environmental Studies, Tsukuba, Japan.
5
School for Environmental Sciences, Peking University, Beijing, China.
CO2) are unrelated to the independent variable. This stands in contrast to the Keeling Model-II approach (geometric mean regression) which does account for errors in both x and y parameters [Pataki et al., 2003]. The Keeling Model-I generally gives smaller slope values and more positive y intercepts than does Keeling II. In a Keeling Model-II regression the intercept is that of a Keeling Model-I regression divided by the correlation coefficient (R) of both the x and y variables. As the R value of the x and y variables declines, the Keeling Model-II intercept is systematically more negative than the Keeling Model-I intercept.
[4] A Miller-Tans Model, i.e., the ‘‘New Model’’ de-scribed in [Miller and Tans, 2003] for calculating isotopic discrimination from atmospheric measurements of CO2and d13C allows for variable background values of both CO2and d13
C and is particularly well suited for evaluating a long time series. The Miller-Tans Model, also based on the conservation of mass, plots the detrended CO2 versus d13C*CO2 data sets, with an equation derived from mass balances for atmospheric CO2 andd13C*CO2 [Miller and
Tans, 2003],
dobsCobs¼dsCobsþCbg dbgds
: ð1Þ
Here, C anddrefer to atmospheric CO2andd13C, and the subscripts obs, bg and s refer to observed, background and source values. The background values used in equation (1) can take different forms and could be constant or vary with time. Thus the ds is determined by the slope of the curve derived from the linear regression fitting technique, as opposed to the y intercept of the Keeling Model. For background values, dbg, the Miller-Tans model uses the secular (5 years in this paper) trend curve to obtain isotopic discriminations by source or sink (ddis, equals tods minus dbg). Since a Keeling Model requires a nonvarying back-ground value for both CO2andd
13
C, a requirement that is commonly violated in time series studies, the Miller-Tans Model could be used for an improved examination of the correlation between CO2andd13C.
[5] Several laboratories operate sampling networks to monitor the trace-gas and stable isotopes composition of the global atmosphere. Among them, the NOAA ESRL (formerly CMDL) Cooperative Global Air Sampling Net-work is the largest. In all the netNet-works, however, the sampling site locations are heavily biased toward windy marine locations, which minimize the influence of local anthropogenic and terrestrial biospheric emissions [Conway
et al., 1994; Francey et al., 1998; Keeling et al., 1995;
Nakazawa et al., 1993, 1997a; World Meteorological
Organization (WMO), 2003a, 2003b].
[6] Waliguan Baseline Observatory (WLG, 36170N, 100540E, 3816m asl), situated in remote western China, is one of the WMO’s 23 Global Atmosphere Watch (GAW) baseline stations scattered around the globe. This site provides essential information on sources and sinks from within the Eurasian continent [Zhou et al., 2003, 2004, 2005]. In this study, seasonally averaged atmospheric CO2 source or sink signals observed at WLG for the period 1991 to 2002 are investigated by the Keeling Model and the Miller-Tans Model approaches. We also present a
compar-ison of WLG to atmospheric CO2andd13C data sets for the period 1998 – 2002 from 11 ESRL network sites in the Northern Hemisphere (NH). The main purpose is to provide a basic understanding of the CO2andd13C common features in Eurasian continental regions as well as provide additional constraints for the carbon budget of the Asian inland plateau, and to supply a long-term and accurate observa-tional record for use in carbon cycle and global climate research.
2. Methods
2.1. Measurement Scale and WLG Data
[7] In this paper, the CO2mixing ratios are reported on the NOAA ESRL measurement scale [Climate Monitoring
and Diagnostics Laboratory (CMDL), 2004;
Globalview-CO2, 2004] in units of mmol mol1 (parts per million
abbreviated ppm, 106mol CO2 per mol of dry air). The isotopic ratios are expressed in per mil (%) relative to the
standard isotopic ratio Vienna Pee Dee belemnite
(VPDB)-CO2[Trolier et al., 1996] for both thed13C andd18O. A total
of 118 monthly CO2 versus d13C and 110 monthly CO2 versus d18
O data points simultaneously available from NOAA ESRL discrete measurements over the entire period May 1991 to December 2002 at WLG were used in the Keeling Model and the Miller-Tans Model regression analysis.
2.2. Detrended Monthly Mean Data Sets and Background Atmospheric Values at WLG
[8] The secular (5 years in this paper) trends in the atmospheric CO2andd13C monthly mean time series could seriously affect the seasonal Keeling Model results [Miller
and Tans, 2003;Pataki et al., 2003;Randerson et al., 2002;
Trolier et al., 1996]. To examine the relationship between
CO2mixing ratio and d13C through the seasonal cycle, we constructed time series of ‘‘detrended’’ monthly data sets by first subtracting a linear secular trend from each of the time series; then a single mean value for each time series, obtained from the average value of its linear fitting curve, was added back to each data point in the time series for use with regression analysis [seeRanderson et al., 2002]. There are several choices of the relative dbg, and this choice determines relevant value of theds. In this paper, we simply employdbgthe mean values of each data set of atmospheric CO2mixing ratio andd13C time series. We calculate here the Keeling Model slopes (dd13C/d[CO2]1) and intercepts (ds) and the Miller-Tans Model slopes (ds). We use the detrended monthly data sets for the entire time span as well as for the different seasons in this period, and also calculate theddisat the site.
[9] To investigate potential differences of the source or sink signal among seasons, the detrended monthly mean CO2mixing ratio andd13C data sets were then partitioned according to season with the months of March, April and May as spring, June, July and August as summer, Septem-ber, October and November as autumn and DecemSeptem-ber, January and February as winter. An alternative approach is to separate the data sets into the ‘‘winter-half-year’’ (November through April) and ‘‘summer-half-year’’ (May
through October) according to typical climatic and environ-mental features observed at WLG [Zhou et al., 2003, 2004]. Both approaches are tested in our analysis.
2.3. Selected NH Sites and Time Span of the Data [10] Details for the 12 selected NH sites (WLG included) in the NOAA ESRL Flask Air Sampling Network are given later in the results and discussion section of this paper. These sites range in latitude from 19.52N to 82.45N and in altitude from 3 to 3810 m asl, and are generally defined as inland, coastal or island locations in this study, with a focus on the 35N – 45N Eurasia inland region. Besides latitudinal and geographical effects, we also use 2000 m as the dividing line to test whether there is a difference in the CO2andd13C between the high- and low-altitude sites. The comparison of WLG to other NH sites has been restricted to the period between January 1998 and December 2002 because the monthly mean atmospheric CO2andd13C data were simultaneously available from the 12 stations (except for IZO, missing a few monthly data in 1998 and 2002). The CO2andd13C monthly mean time series, data detrend-ing, annual cycle amplitudes, annual means and growth rates, Keeling Model and Miller-Tans Model, and theds, the ddis from each the other NOAA ESRL sites are derived using the same methodology as performed on the WLG 1991 – 2002 data sets.
3. Results and Discussion
3.1. Seasonal Relationship Between the CO2Mixing
Ratio and Isotopes at WLG
3.1.1. Test Keeling Model and Miller-Tans Model Approach Using WLG Data Sets
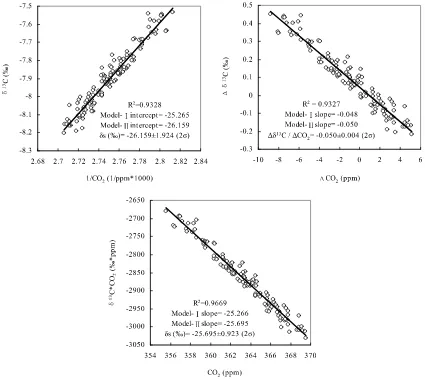
[11] To test and discuss effect of different regression methods on the Miller-Tans Model and the Keeling Model we calculated ds and slopes of the WLG 1991 – 2002 data sets using both Model-I (linear regression) and Model-II (geometric mean regression) techniques. We found that the Keeling Model-I produced similar ds values (e.g., 25.265%, R2 = 0.9328 for the entire period) to the
Miller-Tans Model-I (25.266%, R2= 0.9669), even when
their R2values are quite different. With the Model-II results, however, thedsvalues, which tend to be more negative than Model-I results, are quite different (26.159%by the
Keel-ing Model-II and25.695%by the Miller-Tans Model-II) if
R2values are different (in this study, the Miller-Tans Model generated higher R2values than that of Keeling Model for both the annual and seasonal analyses. This information is presented in following paragraphs). TheDd13
C/DCO2in the Keeling Model-II approach (0.050%ppm1) tends to be
lower than that found using Keeling Model-I (0.048%
ppm1), whereDd13C is equal todobsminusdbg, andDCO2is equal to Cobsminus Cbg. Thedsvalues shift significantly in both methods if the R2< 0.90 thus they are hard to interpret and have limited usage. We use the standard error estimate from the Model-I regression parameters (in this case slope and y intercept) to approximate the error estimate for the Model-II regression parameters as suggested byPataki et al.
[2003]. In this study, the Miller-Tans Model approach gives higher ‘‘Student T’’ statistical significances and lower
uncer-tainties than that of the Keeling Model. While the Miller-Tans Model approach is more flexible and thus applicable to more situations, the most common approach within the community remains the Keeling Model. To make our study comparable with others, both model results are displayed, however, only the Keeling Model results are discussed in the following sections.
3.1.2. Relationship Between Atmospheric CO2Mixing
Ratio andD13C in the Seasonal Cycle
[12] The relationship between the detrended atmospheric CO2mixing ratios andd13C monthly means (118 data sets) at WLG for the entire period May 1991 to December 2002 are shown in Figure 1 for the Keeling Model and Miller-Tans Model approaches. The good fit of the least squares method to the Keeling Model (R2= 0.9328) indicates that the relationship between the seasonal variations of CO2and d13C at WLG can be approximated well using a linear function. Theddisis estimated to be (18.174 ± 1.959)%by the Keeling Model-II and (17.710 ± 0.958)% by the
Miller-Tans Model-II, where we simply employ the dbg (7.985 ± 0.035)% the mean values of atmospheric d13C
time series at WLG from May 1991 to December 2002. [13] To examine the seasonality of the ds, relevant detrended data sets are partitioned and calculated by season, and also by winter-half-year and summer-half-year. Listed in Table 1 are the Keeling Model-II slopes (dd13C/d[CO
2]1), Keeling Model-II y-intercepts and Miller-Tans Model-II slopes (ds), dbg, ddis at WLG for the period May 1991 to December 2002. In addition, Table 1 lists the statistical significant test results for both models (‘‘Student T’’, T =
ffiffiffiffiffiffiffiffiffiffiffiffiffiffiffiffiffiffiffiffiffiffiffiffiffiffiffiffiffiffiffiffiffiffiffiffiffiffiffiffi
N2
ð ÞR2=ð1R2Þ
p
, where R is correlation coefficient of the regressions between detrended monthly means of atmo-spheric CO2andd13C, N is number of the data pairs).
[14] Using Keeling Model-II, we found that CO2andd13C showed higher correlation in summer-half-year (R2 = 0.9604) than in winter-half-year (R2 = 0.9174). Among seasons, the greatest correlation between CO2 and d13C occurred during summer (R2= 0.9362) and the least corre-lation during spring (R2= 0.5636). The high correlation in the summer can be attributed to anthropogenic sources and sinks that are less complicated during the summer months at WLG and thus provide relatively simplified fluxes. The poor correlation during spring is likely due to the mixing of local air masses with transported remote air masses since spring at the sampling site has the greatest range of surface winds and long-range transport among the seasons. Winter (R2 = 0.8498) has relatively uniform surface winds and long-range air mass transport patterns. These winds come mainly from the western (desert) direction. Autumn (R2 = 0.8133) has less uniform winds than winter [Zhou et al., 2003, 2004]. Moreover, since the change in CO2andd13C is not as great in the other seasons relative to summer, any analytical error will have a greater effect on the spring, winter and autumn data sets.
[15] The slope Dd13C/DCO2in the seasonal cycle varies in range from0.050 to0.045%ppm1, thedsvaries in range from 26.354 to 24.636%, and the ddis varies in
range from 18.283 to 16.854% by Keeling Model-II
In general, the estimated ds as well as the ddis are more negative in summer-half-year (dominant surface winds and long-range transport from the eastern direction, with rela-tively more population and vegetation) than that in winter-half-year, with the least negative values during autumn. However, the estimatedds especially during spring is very uncertain owing to the relatively low correlation coefficients (R2 < 0.90) in the relationship of CO2 and d13C (for instance, Rspring
2
= 0.5636, Rautumn 2
= 0.8133, Rwinter 2
= 0.8498). Furthermore, researchers [Miller and Tans, 2003;
Pataki et al., 2003;Randerson et al., 2002;Zondervan and
Meijer, 1996] have indicated thatdsalmost never represents
the isotopic signature of a single source but rather the flux-weighted average of more than one source/sink.
[16] According to literature [Ciais et al., 1995a, 1995b;
Denning et al., 1995;Francey et al., 1990, 1995;Mook et
al., 1983;Nakazawa et al., 1993, 1997a, 1997b; Trolier et al., 1996], by assuming the respective values of 365.0 ppm, 8.0% and 25.0% for the present levels of the
atmo-spheric CO2mixing ratio, thed 13
C in atmospheric CO2and thed13
C in the biosphere, respectively, the resultantDd13 C/ DCO2is0.047%ppm
1
for the CO2exchange between the atmosphere and the biosphere. Complicating this rela-tionship would be fossil fuel CO2 which typically shows d13
C 28.5% but with regard to a detrended
season-to-season comparison its influence can be neglected. Other deviations from the Keeling relationship can come from air-sea CO2 exchange. CO2 release from and uptake to the oceans account for0.002%ppm1and0.005%ppm1,
respectively. The observed seasonality of theDd13C/DCO2 of 0.050 to 0.045 % ppm1 at WLG is in good
agreement with the value calculated by assuming that the exchange of CO2between the atmosphere and the biosphere is the dominant process. We thus suggest that seasonally varying CO2exchange between the atmosphere and terres-trial biosphere is primarily responsible for the observed seasonal variations in atmospheric CO2andd13C at WLG. The variation of the CO2source or sink signature between
Figure 1. Correlations between atmospheric CO2mixing ratios andd13C detrended monthly means (n = 118) at WLG for the period May 1991 to December 2002. (top) Keeling Model results (d13
C versus inverse of CO2mixing ratio, andDd13C versusDCO2) with least squares fitting passed through each of the data sets. (bottom) Miller-Tans Model results, i.e.,d13
C* CO2versus CO2mixing ratio with a least squares fitting.
seasons as well as between the winter-half-year and sum-mer-half-year are likely due to the existence of numerous sources and sinks with different isotopic signatures, such as C3 versus C4 plants. Different air mass transport during these time periods, bringing in air from different regions, may also contribute. To better understand and address a specific source or sink and its exchanging processes in the WLG region, more intensive observational and modeling studies are needed.
3.1.3. Relationship Between Atmospheric CO2Mixing
Ratio andD18O in the Seasonal Cycle
[17] As cited [Flanagan et al., 1997;Friedli et al., 1987;
Ishizawa et al., 2002; Keeling, 1961; Mook et al., 1983;
Nakazawa et al., 1997b;Trolier et al., 1996] and discussed
above,d18O in atmospheric CO2is determined by exchange with vegetation, leafwater, soils and the ocean. It is the exchange of CO2 with the terrestrial biosphere (through ecosystem photosynthesis and respiration) that drives much of the seasonal variation in the d18O of atmospheric CO2, especially over the continental NH. In general, CO2that is in equilibrium with leafwater generates ad18O signature that varies between +2 to +6%, and CO2that is in equilibrium
with soil water generates a d18O signature that varies between 9 to 2%. CO2 exchange with the oceans
generates a minord18O signature.
[18] The d18O monthly mean time series observed at WLG varies seasonally but with relatively large scatter. However, it is expected there might be a relationship between d18O and CO2that is similar to that of d13C and CO2found in a ‘‘Keeling-Plot’’. We constructed a Keeling Model-I relationship (by substituting d18O for d13C in the Keeling-Plot) between the detrended atmospheric CO2 mix-ing ratios andd18O monthly means (110 data sets) at WLG for the entire period of May 1991 to December 2002. Although a negative linear relationship is found, the CO2 mixing ratios and d18
O are not strongly correlated, partic-ularly when compared with the good correlation found between the CO2 mixing ratios and d13C for the same period, and thus we do no show the plots here. The estimated ds for 18O is 8.853% (110 data sets, R2 = 0.19, P < 0.01), for summer-half-year it is 7.574% (55
data sets, R2= 0.11, P < 0.02) and for winter-half-year it is 6.558%(55 data sets, R2= 0.18, P < 0.01). The estimated
dsfor18O (7.662 ± 2.113)%at WLG is in agreement with a mean source or sink where the 18O of CO2 is in equilibrium with soil water (varying from 9 to 2%)
[Ishizawa et al., 2002]. Thus, though subject to a large
degree of uncertainty due to relatively poor linear relation-ship (R2 < 0.2) compared to that of the d13C and CO2 relationship, the observedd18
O seasonal cycle is most likely a result of the exchange of atmospheric CO2with soil water throughout the year. It is clear that we have much to learn about 18O values of atmospheric CO2, but it is also clear that there are large signals and great potential in the data, as demonstrated by thed18O data at WLG.
3.2. Annual Cycle and Interannual Variation at WLG and the 11 Selected NH Sites
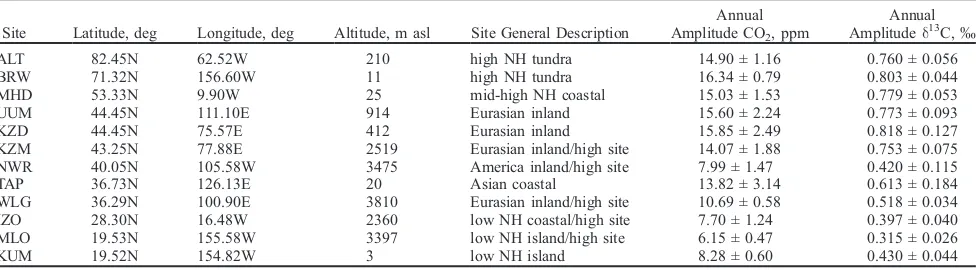
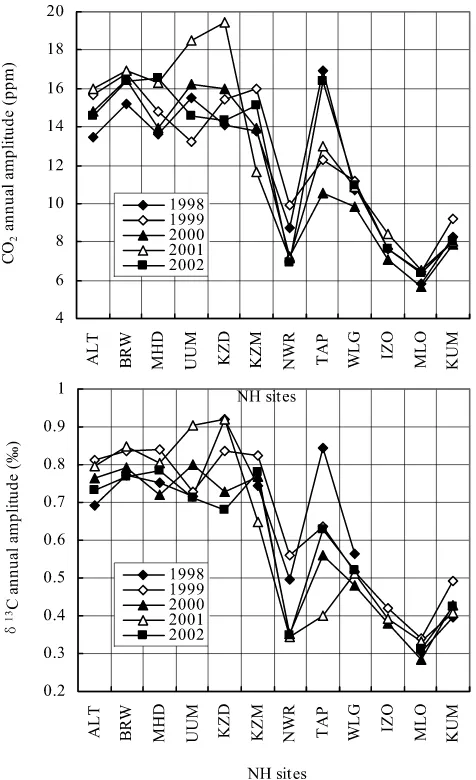
[19] We now compare the WLG results with those from other middle- to high-latitude NH sites in the NOAA ESRL
Air Sampling Network. Station information and 5-year-average (±2s) annual cycle amplitudes for CO2and d13C for the 12 sites (WLG included) are listed in Table 2. Figure 2 shows the geographic location of the five Eurasian sites. The CO2andd13C annual cycle amplitudes for each year for the 12 NH sites are plotted in Figure 3. Sites are plotted by site code and are ranked by latitude (ALT is the highest latitude and KUM is the lowest) to avoid data overlap and to make the ranking clear. The mean CO2 amplitudes vary from 6.15 ppm at MLO to 16.34 ppm at BRW. The mean d13
C amplitudes vary from 0.315% at
MLO to 0.818%at KZD. In general, CO2andd13C mean annual amplitudes at the sites located at latitudes >40N are systematically larger (CO2 amplitude >14 ppm and d
13 C amplitude >0.7%, respectively) than those at the
low-latitude sites, reflecting the importance of the seasonal cycle of photosynthesis and respiration at higher latitudes. There are two apparent exceptions. The Asian coastal site TAP has high amplitudes for its latitude, presumably because it is downwind from China. The North America high-altitude site NWR has low amplitude for its latitude, presumably as it is a high-altitude site and plant productivity upwind in the western United States is low. Comparison of two sets of sites (1) Eurasian inland sites KZD, UUM, and KZM and (2) low-latitude island sites MLO and KUM showed that CO2 and d
13
C mean annual amplitudes are negatively correlated with altitude. This is because most of the fossil fuel source and biospheric CO2sources and sinks are near the surface. The CO2 and d13C mean annual amplitudes (10.69 ± 0.58) ppm and (0.518 ± 0.034)%at WLG are in
accord with its latitude and altitude. However, they are lower than the amplitudes obtained from the other Eurasian inland sites (including the high-altitude site KZM) located between 35N and 45N suggesting less proximal biospheric influence.
[20] The phases of the CO2(maximum in April, minimum in August) and d13
C (maximum in August, minimum in April) seasonal cycles at WLG are similar to the other sites located between 82.45N and 36.29N. The phases observed at middle- to high-latitude NH sites are about 1 month earlier than at the lower latitude sites IZO, MLO and KUM. According to the literature [CMDL, 2004;Conway et
al., 1994; Denning et al., 1995;Mook et al., 1983;WMO, 2003a], the phase delay of the CO2andd13C seasonal cycles at low latitudes results from the transport of air from higher latitudes, as well as the enhanced seasonality of CO2 sources and sinks at high latitudes relative to low latitudes. [21] Among the 12 sites, those located between 35N and 45N have consistently larger interannual fluctuations; how-ever, no obvious altitude effect or temporal trend was detected. At WLG the CO2 annual amplitude varies from 9.84 ppm (in 2000) to 11.8 ppm (in 1999), and the d13
C amplitude varies from 0.479% (in 2000) to 0.562% (in
1998). The CO2andd 13
C interannual amplitude fluctuations were least at WLG and greatest at TAP among the sites in between 35N and 45N. We attribute this difference to the specific sources/sinks and transport at each site: WLG is far removed from large fossil fuel sources and vegetation, while TAP, downwind from China, is affected by large local and regional fossil fuel sources and biospheric sources and sinks.
3.3. Annual Means and Growth Rates at WLG and the 11 Selected NH Sites
[22] The CO2andd13C annual means for each year for the 12 sites are shown in Figure 4. At WLG the CO2 annual
Table 2. Station Information and 5-Year-Average (±2s) Mean Annual Cycle Amplitudes of the Atmospheric CO2Mixing Ratios and
d13
C Derived From Detrended CO2andd13C Monthly Mean Time Series Obtained From Each of the Selected Northern Hemisphere Sites, 1998 – 2002a
Site Latitude, deg Longitude, deg Altitude, m asl Site General Description
Annual Amplitude CO2, ppm
Annual Amplituded13C,%
ALT 82.45N 62.52W 210 high NH tundra 14.90 ± 1.16 0.760 ± 0.056
BRW 71.32N 156.60W 11 high NH tundra 16.34 ± 0.79 0.803 ± 0.044
MHD 53.33N 9.90W 25 mid-high NH coastal 15.03 ± 1.53 0.779 ± 0.053
UUM 44.45N 111.10E 914 Eurasian inland 15.60 ± 2.24 0.773 ± 0.093
KZD 44.45N 75.57E 412 Eurasian inland 15.85 ± 2.49 0.818 ± 0.127
KZM 43.25N 77.88E 2519 Eurasian inland/high site 14.07 ± 1.88 0.753 ± 0.075 NWR 40.05N 105.58W 3475 America inland/high site 7.99 ± 1.47 0.420 ± 0.115
TAP 36.73N 126.13E 20 Asian coastal 13.82 ± 3.14 0.613 ± 0.184
WLG 36.29N 100.90E 3810 Eurasian inland/high site 10.69 ± 0.58 0.518 ± 0.034 IZO 28.30N 16.48W 2360 low NH coastal/high site 7.70 ± 1.24 0.397 ± 0.040 MLO 19.53N 155.58W 3397 low NH island/high site 6.15 ± 0.47 0.315 ± 0.026
KUM 19.52N 154.82W 3 low NH island 8.28 ± 0.60 0.430 ± 0.044
aExcept using 3-year average, 1999 – 2001, for IZO.
Figure 2. Geographic location of the selected Eurasian sites WLG, KZD, KZM, UUM, and TAP of the NOAA ESRL Flask Air Sampling Network.
means vary from 365.7 ppm in 1998 to 372.7 ppm in 2002. The d13
C at WLG varies from 8.115% in 2000 to
8.009% in 1998. The interannual variations in the CO2
annual data at the 12 sites are slightly different from each other. Thed13C annual data at the 12 sites however, showed more complicated interannual fluctuations among the years and sites. The differences among sites, especially among Eurasian inland sites, reflect variations in carbon uptake and release on the Eurasian Continent.
[23] In general, the sites located at high altitudes (>2000 m asl) as well as at low latitudes (<35N) or high latitudes (>45N) are lower in CO2 and heavier in d13C. Among the sites, TAP (Asian costal) and KZD (Eurasian inland) are relatively high in CO2 and more negative in
d13C, likely owing to strong anthropogenic and biogenic sources from the Asian continent and Eurasian inland, respectively. The CO2 and d13C mean annual values at WLG are among the lowest CO2 and heaviest d13C, but are comparable to the measurements obtained from the high-altitude sites KZM and MLO.
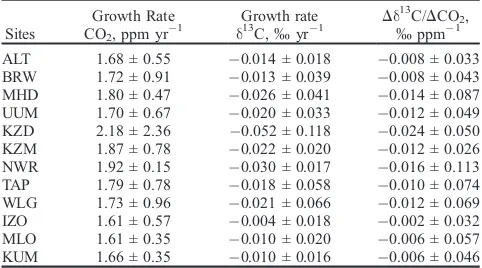
[24] The CO2mean growth rates at the 12 sites (displayed in Table 3) range from 1.61 to 2.18 ppm yr1and thed13
C range from0.052 to0.010%yr1(except for IZO). The
CO2 mean growth rates are similar at all sites except for KZD. The d13C mean growth rates however, show more variability among sites, with the largest decreases at KZD and NWR, and the smallest decreases at KUM, MLO, BRW and ALT. Thed13
C mean decrease rate at WLG was close to those at UUM and KZM as expected (within ±0.002%yr1),
also located in the Eurasian inland. The (Dd13
C/DCO2)
Figure 3. Annual cycle amplitudes of atmospheric CO2 mixing ratio andd13
C derived from detrended monthly data for each year (1998 – 2002) at each of the selected Northern Hemisphere sites (WLG included) from the NOAA ESRL flask air sampling program. Sites are plotted by site code and are ranked by latitude (ALT is the highest latitude and KUM is the lowest) to avoid data overlap and to make the ranking clear.
Figure 4. Annual mean atmospheric CO2 mixing ratios andd13
ratio in the secular trends at the 11 sites (except for IZO) vary from (0.006 ± 0.046) to (0.024 ± 0.050)%ppm1.
The ratio at WLG is in good agreement with UUM and KZM, probably because these three sites typically sample well mixed air masses over the Eurasian inland.
3.4. Seasonally Averaged Isotopic Signature of the CO2Source or Sink at WLG and the 11 Selected NH
Sites
[25] For the period 1998 to 2002, for all 12 NH sites, we calculate the seasonalDd13C/DCO2,ds,dbgandddisas well as the ‘‘Student T’’ test by both Keeling Model and Miller-Tans Model in the same manner as performed on the 1991 – 2002 WLG data. The results are given in Table 4. The Keeling Model results illustrates that the relationship be-tween seasonal variation of CO2andd13C at the 12 sites can be approximated using a linear function. Among the sites, TAP, NWR, WLG, KUM and IZO showed seasonal corre-lation coefficients lower than R2= 0.95 between CO2and d13
C than the other sites. Thus estimatedDd13
C/DCO2and ds from these sites are subject to larger uncertainties and should be carefully interpreted. On the other hand, ALT, KZM, MHD and BRW show the highest degree of correlation in seasonally averaged CO2 and d13C data among the sites (R2 > 0.98). By Keeling Model-II, the seasonalDd13
C/DCO2ratios for the period of 1998 – 2002 at the 12 sites ranged from 0.056 (KUM and NWR) to 0.049%ppm1(TAP) with most sites having ratios in the to site. This is becausedsobtained at each site represents the mean isotopic composition of all sources, biogenic and anthropogenic, contributing to the CO2seasonal variation on a regional as well as on a continental scale over the entire period. Overall, the seasonalDd13
C/DCO2ratio of (0.050 ± 0.003)%ppm1, thedsof (26.578 ± 1.674)%and the
ddisof (18.505 ± 1.718)%by Keeling Model-II at WLG
are comparable to the values found at other 11 sites in this study. The seasonaldsobserved at WLG also compares well with values observed and modeled at other background sites
[Francey et al., 1998;Levin et al., 1995;Randerson et al.,
2002].
4. Conclusions
[27] For the period 1991 to 2002, the relationship between the seasonal change of CO2andd13C at WLG is approxi-mated well with a linear function. TheDd13
C/DCO2ratio in the seasonal cycle is (0.050 ± 0.004)%ppm1, the ds is (26.159 ± 1.924)%, and theddisis (18.174 ± 1.959)% by the Keeling Model-II, averaged over the entire period. The CO2andd13C showed higher correlation in the sum-mer-half-year than in the winter-half-year. The strongest correlation occurred in summer, and the least correlation in spring. TheDd13
C/DCO2calculated by seasons varied from 0.050 to 0.045% ppm1 in good agreement with the
value expected from CO2exchange between the atmosphere and biosphere. We thus suggest that the seasonally depen-dent CO2exchange between the atmosphere and the terres-trial biosphere is primarily responsible for the observed CO2 and d13
C seasonal variations at WLG. The ds range from 26.354 to24.636%, and theddisvary from18.283 to 16.854%, calculated by seasons. Thedsandddisare more negative in the summer-half-year because the dominant surface winds and long-range transport are from the eastern direction where there are highly populated and vegetated areas. Though subject to a large degree of uncertainty due to the relatively poor linear relationship between atmospheric CO2andd18O, the observedd18O seasonal cycle at WLG is most likely a result of the exchange of atmospheric CO2 with soil water throughout the year.
[28] A comparison of WLG to 11 NH sites in the NOAA ESRL network for the period 1998 to 2002 indicates that the CO2 and d13C mean annual amplitudes are negatively correlated with altitude. This is because most of the anthro-pogenic and biospheric CO2 sources are located at lower elevations. The temporal phases of CO2andd13C at WLG are similar to records from the other sites located at 36.29N – 82.45N. The CO2andd13C mean annual ampli-tudes at WLG are much lower than records from the other Eurasian inland sites located between 35N and 45N. The primary reason for the comparably small seasonal amplitude at WLG is due to its high altitude. WLG is in line with most other sites in showing a decreasing trend of seasonality with latitude while NWR and TAP are at odds likely owing to the special conditions of those sites as described earlier. The CO2 and d13C amplitude interannual fluctuations were lowest at WLG and the highest at TAP among the sites between 35N and 45N.
[29] CO2 and d13C mean annual values from the sites located at high altitudes (>2000 m asl) and those located at low-NH (<35N) or high-NH (>45N) latitudes are lower in CO2and higher in d13C. The CO2 andd13C mean annual values at WLG are among the lowest CO2and the highest d13
C obtained from the high-altitude/low-latitude sites KZM, MLO and KUM. The CO2 mean growth rate at
Table 3. Five-Year-Average (±2s) Mean Growth Rates of the Atmospheric CO2 Mixing Ratios and d13C as Well as Rate of Secular Changes ind13C With Respect to the CO2Mixing Ratios (Dd13
C/DCO2) at Each of the Selected Northern Hemisphere Sites, 1998 – 2002a
Except using 3-year average, 1999 – 2001, for IZO.
WLG was comparable to the other sites. The d13C mean decrease rate at WLG was close to the measurements at the Eurasian inland sites UUM and KZM. The Dd13C/DCO2 changing ratio of the secular trends at WLG are in good agreement with UUM and KZM, probably because they typically sample well mixed air masses over the Eurasian inland.
[30] The estimated seasonally Dd13C/DCO2, ds and ddis vary among the 12 NH sites. Theds derived for each site represents the mean isotopic composition of all sources contributing to the CO2seasonal variation on regional and continental scales. The seasonallyDd13
C/DCO2,ds andddis at WLG are comparable to the values at the 11 sites. Theds at WLG also compares well with values observed and modeled at other background sites. The estimateddsduring certain times at each specific site could possibly provide useful information on CO2fluxes. However, interpretation of the ds is more complicated when fluxes of opposing isotopic sign are involved.
[31] Very useful information on the fluxes of CO2could be provided by the estimateddsin the relevant time span at each specific site. However, as we cited and discussed above, more attention should be paid to the decomposition and interpretation of thedswhen fluxes of opposing isotopic sign are involved. At large spatial scales, such as with the remote flask sampling sites, variation in the isotopic com-position of CO2 will always have contributions from both photosynthesis and ecosystem respiration regardless of the season, along with contributions from ocean exchanges
[Randerson et al., 2002; Tans et al., 1993]. Other
approaches may be used to help isolate multiple isotopic sources, including the use of the additional isotopic con-straint ofd18O to separate biogenic fluxes [Yakir and Wang, 1996], the use of CO [Bakwin et al., 1998; Miller et al., 2003] and theD14C of CO2[Levin et al., 1995;Zondervan
and Meijer, 1996] to estimate the impact of fossil fuel
combustion, and radon (222Rn) [Schmidt et al., 1996] to distinguish between air masses with an oceanic versus a terrestrial origin.
[32] Acknowledgments. This work is supported by a Key Project Sponsored by the Scientific Research Foundation for the Returned Overseas Chinese Scholars (State Personnel Ministry [2004]99), a key project sponsored by the Climate Change Science Foundation (China Meteorological Administration CCSF-2006-4), a Japan Society for Pro-motion of Science Post-doctoral Fellowship (PB01736), and a United Nation’s GEF Fund (GLO/91/G32). We thank the staff of Waliguan Station for their efforts in collecting the flask air samples. We appreciate NOAA ESRL and CU-INSTAAR for cooperation on the Waliguan NDIR and flask air sampling programs. Helpful comments and suggestions of two anonymous reviewers are gratefully acknowledged. The authors would like to especially thank one of the reviewers: the annotated manuscript has contributed to a significant improvement in the resub-mission and the further revised version of this paper.
References
Bakwin, P. S., P. P. Tans, J. W. C. White, and R. J. Andres (1998), Deter-mination of the isotopic (13C/12C) discrimination by terrestrial biology from a global network of observations, Global Biogeochem. Cycles,
12(3), 555 – 562.
Ciais, P., P. P. Tans, J. W. C. White, M. Trolier, R. J. Francey, J. A. Berry, D. R. Randall, P. J. Sellers, J. G. Collatz, and D. S. Schimel (1995a), Partitioning of ocean and land uptake of CO2as inferred byd13C
Ciais, P., P. P. Tans, M. Trolier, J. W. C. White, and R. J. Francey (1995b), A large Northern Hemisphere terrestrial CO2sink indicated by13C/12C of
atmospheric CO2,Science,269, 1098 – 1102.
Climate Monitoring and Diagnostic Laboratory (2004), CMDL Summary Report 27, report, pp. 32 – 57, Boulder, Colo.
Conway, T. J., P. P. Tans, L. S. Waterman, K. W. Thoning, D. R. Kitzis, K. A. Masarie, and N. Zhang (1994), Evidence for international varia-bility of the carbon cycle from the NOAA/CMDL global air sampling network,J. Geophys. Res.,99(D11), 22,831 – 22,855.
Denning, A. S., I. Y. Fung, and D. Randall (1995), Latitudinal gradient of atmospheric CO2due to seasonal exchange with land biota,Nature,376,
240 – 243.
Flanagan, L. B., J. R. Brooks, G. T. Varney, and J. R. Ehleringer (1997), Discrimination against C18O16O during photosynthesis and the oxygen isotope ratio of respired CO2in boreal forest ecosystems,Global
Biogeo-chem. Cycles,11(1), 83 – 98.
Francey, R. J., F. J. Robbins, C. E. Allison, and N. G. Richards (1990), The CSIRO global survey of CO2stable isotopes, inBaseline Atmospheric
Program (Australia) 1988, edited by S. R. Wilson and G. P. Ayers, pp. 16 – 27, Bur. of Meteorol., Hobart, Tasmania, Australia.
Francey, R. J., P. P. Tans, C. E. Allison, I. G. Enting, J. W. C. White, and M. Trolier (1995), Changes in oceanic and terrestrial carbon uptake since 1982,Nature,373, 326 – 330.
Francey, R. J., et al. (1998), Atmospheric carbon dioxide and its stable isotope ratios, methane, carbon monoxide, nitrous oxide and hydrogen from Shetland Isles,Atmos. Environ.,32(19), 3331 – 3338.
Friedli, H., U. Siegenthaler, D. Rauber, and H. Oeschger (1987), Measure-ments of concentration,13C/12C and18O/16O ratios of tropospheric car-bon dioxide over Switzerland,Tellus, Ser. B,39, 80 – 88.
Globalview-CO2(2004), Cooperative Atmospheric Data Integration
Pro-ject—Carbon dioxide, report, NOAA Clim. Monit. and Diagn. Lab., Boulder, Colo. (Available at http://www.cmdl.noaa.gov/ccgg/globalview) Inoue, H., and Y. Sugimura (1985), The carbon isotopic ratio of atmo-spheric carbon dioxide at Tsukuba, Japan,J. Atmos. Chem.,2, 331 – 344. Ishizawa, M., T. Nakazawa, and K. Higuchi (2002), A multi-box model study of the role of the biospheric metabolism in the recent decline of d18
O in atmospheric CO2,Tellus, Ser. B,54, 307 – 324.
Keeling, C. D. (1958), The concentration and isotopic abundances of car-bon dioxide in rural areas,Geochim. Cosmochim. Acta,13, 322 – 334. Keeling, C. D. (1961), The concentration and isotopic abundance of carbon
dioxide in rural and marine air,Geochim. Cosmochim. Acta,24, 277 – 298.
Keeling, C. D., T. P. Wholf, M. Wahlen, and J. Plicht (1995), Interannual extremes in the rate of rise of atmospheric carbon dioxide since 1980,
Nature,375, 666 – 670.
Levin, I., R. Graul, and N. B. A. Trivett (1995), Long-term observations of atmospheric CO2and carbon isotopes at continental sites in Germany,
Tellus, Ser. B,47, 23 – 34.
Miller, J. B., and P. P. Tans (2003), Calculating isotopic fractionation from atmospheric measurements at various scales,Tellus, Ser. B,55, 207 – 214. Miller, J. B., P. P. Tans, J. W. C. White, T. J. Conway, and B. Vaughn (2003), The atmospheric signal of terrestrial carbon isotopic discrimina-tion and its implicadiscrimina-tion for partidiscrimina-tioning carbon fluxes,Tellus, Ser. B,55, 197 – 206.
Mook, W. G., M. Koopmans, A. F. Carter, and C. D. Keeling (1983), Seasonal, latitudinal, and secular variations in the abundance and isotopic ratios of atmospheric carbon dioxide: 1. Results from land stations,
J. Geophys. Res.,88(C15), 10,915 – 10,933.
Nakazawa, T., S. Morimoto, S. Aoki, and M. Tanaka (1993), Time and space variations of the carbon isotopic ratio of tropospheric carbon diox-ide over Japan,Tellus, Ser. B,45, 258 – 274.
Nakazawa, T., S. Morimoto, S. Aoki, and M. Tanaka (1997a), Temporal and spatial variations of the carbon isotopic ratio of atmospheric CO2in the
western Pacific region,J. Geophys. Res.,102(D1), 1271 – 1285. Nakazawa, T., S. Murayama, M. Toi, M. Ishizawa, K. Otonashi, S. Aoki,
and S. Yamamoto (1997b), Temporal variations of the CO2concentration
and its carbon and oxygen isotopic ratios in a temperate forest in the central part of the main island of Japan,Tellus, Ser. B,49, 364 – 381. Pataki, D. E., J. R. Ehleringer, L. B. Flanagan, D. Yakir, D. R. Bowling,
C. J. Still, N. Buchmann, J. O. Kaplan, and J. A. Berry (2003), The application and interpretation of Keeling Plots in terrestrial carbon cycle research, Global Biogeochem. Cycles, 17(1), 1022, doi:10.1029/ 2001GB001850.
Randerson, J. T., et al. (2002), Carbon isotope discrimination of arctic and boreal biomes inferred from remote atmospheric measurements and a biosphere-atmosphere model,Global Biogeochem. Cycles,16(3), 1028, doi:10.1029/2001GB001435.
Schmidt, M., R. Graul, H. Sartorius, and I. Levin (1996), Carbon dioxide and methane in continental Europe: A climatology, and 222Rn-based
emission estimates,Tellus, Ser. B,48, 457 – 473.
Tans, P. P., J. A. Berry, and R. F. Keeling (1993), Oceanic13C/12C observa-tions: A new window on oceanic CO2uptake,Global Biogeochem.
Cy-cles,7(2), 353 – 368.
Trolier, M., J. W. C. White, P. P. Tans, K. A. Masarie, and P. A. Gemery (1996), Monitoring the isotopic composition of atmospheric CO2:
Mea-surements from the NOAA global air sampling network,J. Geophys. Res.,101(D20), 25,897 – 25,916.
World Meteorological Organization (2003a), Report of the 11th WMO/ IAEA meeting of experts on CO2concentration and related tracer
mea-surement techniques,TD- 1138, Tokyo.
World Meteorological Organization (2003b), World Data Center for Green-house Gases (WDCGG) data summary,WDCGG 27, Tokyo.
Yakir, D., and X. F. Wang (1996), Fluxes of CO2 and water between
terrestrial vegetation and the atmosphere estimated from isotopic mea-surements,Nature,380, 515 – 517.
Zhou, L. X., J. Tang, Y. P. Wen, J. L. Li, P. Yan, and X. C. Zhang (2003), The impact of local winds and long-range transport on the continuous carbon dioxide record at Mount Waliguan, China,Tellus, Ser. B,55, 145 – 158.
Zhou, L. X., D. E. J. Worthy, P. M. Lang, M. K. Ernst, X. C. Zhang, Y. P. Wen, and J. L. Li (2004), Ten years of atmospheric methane observations at a high elevation site in Western China,Atmos. Environ.,38(40), 7041 – 7054.
Zhou, L. X., T. J. Conway, J. W. C. White, H. Mukai, X. Zhang, Y. Wen, J. Li, and K. MacClune (2005), Long-term record of atmospheric CO2
and stable isotopic ratios at Waliguan Observatory: Background features and possible drivers, 1991 – 2002, Global Biogeochem. Cycles, 19, GB3021, doi:10.1029/2004GB002430.
Zondervan, A., and H. A. J. Meijer (1996), Isotopic characterization of CO2
sources during regional pollution events using isotopic and radiocarbon analysis,Tellus, Ser. B,48, 601 – 612.
T. J. Conway, Global Monitoring Division, Earth System Research Laboratory, National Oceanic and Atmospheric Administration (NOAA/ ESRL/GMD), Boulder, CO 80305, USA.
J. Li, School for Environmental Sciences, Peking University, Beijing 100871, China.
K. MacClune and J. W. C. White, Institute for Arctic and Alpine Research, University of Colorado (CU/INSTAAR), Boulder, CO 80309, USA.
H. Mukai, Center for Global Environmental Research, National Institute for Environmental Studies (NIES/CGER), Tsukuba, Ibaraki 305-8506, Japan.
Y. Wen, X. Zhang, and L. Zhou, Key Laboratory for Atmospheric Chemistry (LAC), Centre for Atmosphere Watch and Services (CAWAS), Chinese Academy of Meteorological Sciences (CAMS), China Meteor-ological Administration (CMA), 46 Zhong-guan-cun South Street, Beijing 100081, China. ([email protected])