Impact of Exotic Earthworms
on Organic Carbon Sorption
on Mineral Surfaces and Soil Carbon
Inventories in a Northern Hardwood
Forest
Amy Lyttle,
1Kyungsoo Yoo,
1* Cindy Hale,
2Anthony Aufdenkampe,
3Stephen D. Sebestyen,
4Kathryn Resner,
1and Alex Blum
51
Department of Soil Water, and Climate, University of Minnesota, 439 Borlaug Hall, 1991 Upper Buford Circle, St. Paul, Minnesota 55108, USA;2The Natural Resources Research Institute, University of Minnesota-Duluth, 5013 Miller Trunk Hwy, Duluth, Minnesota 55811, USA;3Stroud Water Research Center, 970 Spencer Road, Avondale, Pennsylvania 19311, USA;4Northern Research Station, USDA Forest Service, 1831 Hwy 169E, Grand Rapids, Minnesota 55744, USA;5US Geological Survey, 3215 Marine St., Boulder,
Colorado 80303, USA
ABSTRACT
Exotic earthworms are invading forests in North America where native earthworms have been ab-sent since the last glaciation. These earthworms bioturbate soils and may enhance physical interac-tions between minerals and organic matter (OM), thus affecting mineral sorption of carbon (C) which may affect C cycling. We quantitatively show how OM-mineral sorption and soil C inventories respond to exotic earthworms along an earthworm invasion chronosequence in a sugar maple forest in northern Minnesota. We hypothesized that mineral surface area in A horizons would increase as burrowing earthworms incorporated clay minerals from the B
horizons and that enhanced contacts between OM and minerals would increase the OM sorption on mineral surfaces and mineral-associated C invento-ries in A horizons. Contrary to our hypotheses, mineral surface areas within A horizons were low-ered because earthworm burrows only extended into the silt-rich loess that separated the A and clay-rich B horizons. Furthermore, where endogeic earthworms were present, a smaller fraction of mineral surface area was covered with OM. OM sorption on minerals in the A horizons shifted from a limitation of mineral surface availability to a lim-itation of OM availability within a decade after the arrival of endogeic earthworms. C-mineral sorption depends on earthworm consumption of OM as well as the composition and vertical distribution of minerals. This finding may thus explain the con-tradictory results reported in earlier investigations. Our results highlight the rapid and drastic effects of exotic earthworms on key ecosystem processes in deciduous forests in post-glacial settings.
Key words: biological invasion; earthworms; bioturbation; soil carbon; organic matter; minerals; exotic species; sorption; mineral surface area.
Received 11 March 2014; accepted 28 July 2014; published online 20 September 2014
Electronic supplementary material:The online version of this article (doi:10.1007/s10021-014-9809-x) contains supplementary material, which is available to authorized users.
Author contributions A. Lyttle conducted part of laboratory analysis, analyzed data, and wrote the first draft. K. Yoo conceived and designed the study, led collaborative field and laboratory research, analyzed data, and wrote the paper. C. Hale supervised earthworm collection and identification. A. Aufdenkampe contributed to designing BET surface area analysis, study design, and sample collection. S. D. Sebestyen contributed to study design and writing. K. Resner contributed to laboratory analysis. A. Blum conducted quantitative mineralogical analysis.
*Corresponding author; e-mail:[email protected]
Ó2014 Springer Science+Business Media New York
INTRODUCTION
Earthworms are common in temperate and tropical ecosystems (Hendrix and others 2008) and among the best-known ecosystem engineers (Crooks
2002). Although they are not native species, exotic earthworms have invaded previously glaciated forests in North America (Hendrix and others
2008). Over past centuries, human activities such as agriculture, dumping of unused fishing bait, logging, recreation, transport of earthworm, and cocoon-infested soils have dramatically accelerated the areal expansion of exotic earthworms into post-glacial soils (for example, Hendrix and Bohlen
2002). Once introduced, exotic earthworms have substantially modified soil morphology and nutri-ent cycling (Alban and Berry 1994; Scheu and Parkinson 1994a, b; Bohlen and others 2004a, c; Frelich and others2006; Hale and others2008). In northern hardwood forests in North America, exotic earthworms have had effects on soil carbon (C) and nitrogen cycling (Hale and others 2005a; Frelich and others2006; Bohlen and others2004b,
c; Hale and others2008) and caused the decline of native understory plant communities (Alban and Berry 1994; Scheu and Parkinson 1994b; Gundale
2002; Bohlen and others 2004c; Hale and others
2005a,b,2006).
Studies generally find that exotic earthworms cause a loss of the leaf litter layer in post-invasion forests. Nonetheless there are contrasting effects of exotic earthworms on C inventories within mineral soils that may arise from differences among loca-tions and stages of earthworm invasion, highlight-ing a need for a process-based understandhighlight-ing of the effects of exotic earthworms on soil C turnover. Decades of research have converged on a consensus that long-term retention of OM in soils is primarily controlled by OM-mineral interactions (for exam-ple, Torn and others 1997; Schmidt and others
2011). Minerals protect C by occluding OM and together they cohere to form mineral aggregates (Baldock and Skjemstad 2000; von Lutzow and others 2006).
Here we focus on OM sorption on minerals sur-face as a key ecosystem process that may be strongly affected by exotic earthworms. To sorb organic matter onto mineral surfaces, minerals and organic matter must have physical contact, which requires turbation. Nonetheless, little is known about how this process is altered by bioturbation. Plant C inputs and C concentrations are typically high in surface soils, whereas secondary clay min-erals presumably with high specific surface area (SSA) tend to be more abundant in illuvial
horizons at deeper depths. Therefore we concep-tualize that many soils have a capacity for OM-mineral sorption that is limited by physical contact and that bioturbation may mix OM in the forest floor and clay minerals in subsoils, facilitating OM-mineral sorption. This basic premise underlies our approach to scale up nano-scale C-mineral sorption (for example, Remusat and others2012) to whole-ecosystem processes that determine soil C cycling and budgets.
We studied an earthworm invasion chronoseqe-unce in a sugar maple forest of northern Minne-sota. Along this chronosequence, different functional groups of earthworms have longitudi-nally progressed at different rates, and systematic responses of soil C contents and N and P availability to arrivals of different earthworm functional groups have been well established (Hale and others2005a,
b, Hale and others 2006). In exploring effects of earthworm bioturbation on C-mineral sorption, this detailed background information allowed us to systematically develop a soil sampling scheme that would balance:
Existing knowledge of the distribution of earth-worm functional groups and invasion sequence,
Labor-intensive deep soil sampling, which se-verely limited sample size, and,
Multi-faceted laboratory analyses, which were labor and time consuming.
We attempted to better understand the mecha-nisms and changes in magnitudes of OM sorption to mineral surface along an earthworm invasion chronosequence. We tested two specific hypothe-ses: (1) Burrowing earthworms increase mineral SSA in the A horizon by incorporating clay min-erals from the underlying clay-rich B horizons; (2) earthworms that actively mix the A horizon in-crease OM sorption on mineral surfaces and thus increase mineral-sorbed soil C inventories.
METHODS
Study Site
glacial till overlain by a silt loam loess layer of varying depths (Adams and others2004). The land surface is gently rolling and seasonal wetlands are present in some depressions.
Earthworm-free soils had an O horizon and a thin A horizon. The forest litter layer was over 5 cm thick in earthworm-free areas. The A horizons, rarely exceeding 5 cm in thickness in earthworm-free areas, had many fine roots. Prior to earthworm invasion, the A horizon materials had a weak very fine granular structure and very fine sandy loam texture. The A horizon was underlain by a thick (30 cm) silty layer with uniform thickness, min-eralogy, texture, and pH which we refer to as loess. Between the loess layer and the underlying cal-careous glacial till, we found a clay-rich B horizon. The loess materials had a very fine sandy loam texture and fine roots were present. Depths to carbonate rich glacial till ranged from 90 to 160 cm. The 200-m long transect extended from an earth-worm-infested area located 145 m away from a secondary road into the forest where earthworms were nearly absent (Figure 1).
Soil Sampling
Large soil pits (1.5 91.591.5 m) were excavated in 2009 to 20–30 cm below soil-glacial till bound-aries (100 to 150-cm depths) at 0, 50,100, 150, 160, and 190 m along a transect (Figure 1). Soil samples were collected from the excavated pits in 2.5-cm increments in the A horizon, 5-cm incre-ments in the loess layer, and 10-cm increincre-ments in
the B horizon. Bulk densities were determined for core samples from each horizon that were collected using a sliding hammer corer, dried, and weighed. In 2011, soil cores with internal diameters of 3.2 cm and lengths of 30 cm were collected adja-cent to all plots along transect B (Figure1) to measure thicknesses of A horizons and loess layers.
Earthworm Sampling and Identification
Earthworm biomass and speciation were quantified at 10-m intervals along transect B (Figure1) in 2009. Earthworms were collected from 0.3-m2 subplots using liquid mustard extraction (Lawrence and Bowers 2002; Hale and others 2005a). We sampled earthworms during September when earthworms were sexually mature and easier to identify. Collected earthworms were euthanized in 70 % isopropyl and preserved in 10 % formalin. Earthworm taxonomy was determined following Schwert (1990), Reynolds (1977), and Hale (2007). Ash-free dry (AFD) earthworm biomasses were calculated from the regression model developed by Hale and others (2004).
Earthworms were classified into three functional groups based upon feeding and dwelling habits. The epigeic group fed and dwelled in leaf litter without burrowing into mineral soils. Earthworms that dwelled within shallow mineral soils were in the endogeic functional group. These earthworms ingested mineral soil and digested organic matter. The endogeic group also created a system of con-nected non-permanent burrows in the mineral soil.
Figure 1. Earthworm invasion chronosequence.Grey circles show the soil pits that were excavated in 2009. Of all the
locations shown with black circles and studied by Hale and others (2005b), 19 points along transect B were used for
Finally, anecic earthworms fed on surface litter and pulled litter into their deep permanent burrows in mineral soils. Various earthworm species and their biomasses within each functional group at this site were described in Hale and others (2005b).
Carbon Content Measurements and
Density Fractionation
To quantify mineral-associated C inventories—in addition to total C inventories—in A horizons, eighteen soil samples (3 samples within the A horizons at each pit) across the invasion gradient were selected for density fractionation. Samples were wet sieved (2 mm), which may disintegrate macroaggregates. This process, however, would not interfere with our focus on mineral sorption of C instead of C occlusion in aggregates. Regardless, the coarse fraction (>2 mm) was less than 5 % (by mass) of samples. Approximately 10 g of the fine fraction (<2 mm) samples were air-dried, lightly ground using a rolling pin for 3 min, and dry sieved (250lm) to selectively remove fine roots. Soil samples were then mixed with 2.0 g cm-3sodium polytungstate (Torresan 1987) and placed on a shaker for 2–3 h at room temperature. Based on Sollins and others (2009), a density of 2.0 g cm-3 was used to remove organic debris and to focus on OM associated with mineral surfaces. Settled materials were retrieved and rinsed with deionized water until electrical conductivity of the solution was £50lS cm-1 (Eusterhues and others 2005). The samples were then oven dried at 60°C.
Oven-dried soil samples were treated with hydrochloric acid to remove carbonate prior to analysis. Soil organic C contents for bulk and density fractionated soil samples were determined by a VarioMax CN Elemental Analyzer at the Agricultural Research Station (USDA-ARS) facility at the University of Minnesota. Carbon contents in soil and leaf litter were measured on duplicate 0.5 g samples.
Specific Surface Area Measurements
Specific mineral surface area (SSA) was measured for fine fraction (<2 mm) soil samples using a TriStar 3020 Surface Area and Porosity Analyzer in the Department of Soil, Water, and Climate at the University of Minnesota. Based on the Brunauer– Emmett–Teller (BET) theory (Webb and Orr1997), isotherm data were collected at 11 different pres-sure points at the boiling temperature of liquid nitrogen (that is, 77 K), using N2 as an adsorbent
gas. Each sample weighed approximately 1.5 g. Samples were degassed prior to analysis to remove any excess water and contaminants on the surfaces: samples were heated at 150°C and purged by N2 gas for 4–6 h.
After initial SSA analysis of untreated soil, OM was removed from the same samples to reveal the mineral surface covered by OM. The OM-removed samples were then subject to the same SSA ana-lysis. For removing OM from soil or sediment samples, we adopted the procedures used in Wagai and others (2009) where OM is removed by muf-fling samples at 350°C for 12 h.
Iron and Aluminum Oxides Extractions
Because pedogenic crystalline and amorphous Fe/ Al oxides have large specific surface areas (Eus-terhues and others2005; Kaiser and Guggenberger
2007) and affect carbon turnover (Torn and others
1997), we measured extractable Fe and Al on se-lected soil samples from heavily invaded (0 and 50 m) and minimally invaded (160 and 190 m) soils. Samples from three depths in the A horizons were analyzed. Soil samples of 0.75 g were mixed with sodium dithionite, sodium citrate, and sodium bicarbonate to remove both crystalline and non-crystalline Fe/Al oxides in the soil (Holmgren
1967). Extracts were then analyzed with an Inductively Coupled Plasma Atomic Emission Spectrometer (ICP-AES) at the Research Analytical Laboratory at the University of Minnesota (http:// ral.cfans.umn.edu/). The non-crystalline Fe oxide pool was estimated by ammonium oxalate dark extraction (McKeague and Day1966). Soil samples of 0.5 g were mixed with 50 mL of ammonium oxalate at pH 3 in dark bottles and were placed on shaker for 4 h. Later, samples were centrifuged and aliquots of the extracts were analyzed by ICP-AES.
Quantitative XRD
To constrain the mineralogical source of surface area, 1-g soil samples were ground with a zinc oxide standard. Using a Siemens D500 instrument at the United States Geological Survey, Boulder, CO, XRD spectra were collected from 5°to 65°2h
with Cu and Ka radiation. Using the RockJock
CALCULATIONS
Mass Equivalent Depths (MED)
Because exotic earthworms affect soil bulk density (Hale and others 2005a), different masses of over-lying soil materials may be found at identical soil depths. To eliminate this effect, we adopted mass equivalent depth (MED). The MED represents the overlying soil mass. For example, MED of 1.9 g cm-2
represents a soil depth where the overlying soil mass per cm2 is 1.9 g which was equivalent to the thickness of pre-existing A hori-zons (6 cm) prior to the arrival of epi-endogeic or endogeic species. An MED of 18.2 g cm-2 corre-sponded to the lower boundaries of the loess layer (35-cm depths) and thus included A horizons thickened by endogeic mixing. The MED, in units of g cm-2, was calculated as:
MED¼X N
i¼1
ðDziBDiÞ ð1Þ
where BD was the bulk density (g cm-3), Dz was the thickness of a sampled layer (cm), i indicated the i-th layer sampled, andNwas the total number of sampled layers above the depth of interest.
Carbon Inventories
Soil C inventory for a horizon, X, was calculated as:
CIX ¼
XN
i¼1
ðciMEDiÞ ð2Þ
where CIXwas the C inventory of a soil horizon, X [kg C m-2], and c was the mass fraction of C in a sample [kg kg-1]. Coarse contents were negligible because the values were less than 5 % in all sam-ples.
Specific Surface Areas
Mineral specific surface area (SSA) can be subdi-vided as:
SSAtotal¼ SSAoccludedþSSAexposed ð3Þ
where SSAtotal equaled the total SSA of the
min-eral, SSAoccluded was the area covered by OM, and
SSAexposed represented the area not covered by
OM. Operationally, SSAtotal corresponds to the
mineral SSA determined after removing OM. SSAoccludedwas the difference between the SSA of
samples measured before and after removing OM. We then quantified the percent of mineral SSA covered by OM (%SSAoccluded) (Wagai and others
2009) as:
%SSAoccluded ¼ ½ðSSAtotalSSAuntreatedÞ=SSAtotal
100;
ð4Þ
where SSAuntreated referred to mineral SSA
deter-mined before the removal of OM. Here, SSA of OM was not included because numerous measurements have shown negligible BET SSA of organic matter in soils (for example, Chiou1990).
RESULTS
Earthworm Biomass and Species
Composition
The epigeic group contributed the least to total earthworm biomass and was found across the en-tire transect except at 160 and 180 m (Figure2). The endogeic group had a relatively large contri-bution to the earthworm biomass (Figure2). They were not found beyond 130 m. The epi-endogeic group was among the largest contributors to bio-mass (Figure2) and were found up to 190 m. The anecic group contributed to a substantial fraction of the total earthworm biomass because the individ-uals have the largest biomass. The distribution of anecic earthworms was variable, and they were only present at £60 m. Figure2also describes the biomass of each earthworm species by functional groups.
As shown below, endogeic species had the most profound impacts on the soil properties of interest in this study. Accordingly, we divided soil pits into two groups based on their presence: thefront group
without endogeic species consisted of pits at 150, 160, and 190 m, and therear groupwith endogeic species was made of pits at 0, 50, and 100 m. The invasion threshold at 150 m, which was previously termed as the leading edge of the earthworm invasion (Hale and others 2005a, b), was visually determined at the location where dramatic change in leaf litter biomass occurred from patchy or no litter layer to a thick forest floor.
Carbon Concentrations and Inventories
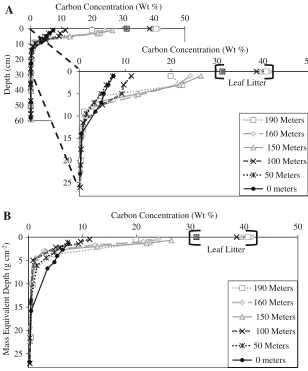
Below the MED of 16 g cm-2 (14-cm depth), C concentrations reached their minimum values and differences between each site were negligible. Soils in the rear group had substantially lower C con-centrations than soils in the front group. In the front group, C concentrations declined to 1 % at the MED of 4–6 g cm-2, whereas C concentrations in the rear group did so at 10–16 g cm-2
horizons from 190 to 150 m was juxtaposed with an abrupt reduction between 150 and 100 m pre-sumably due to the presence of endogeic earth-worms (Figure2). Vertical homogenization of C concentrations within A horizons was evident in
soils that were inhabited by endogeic species. Additionally, we observed greater C contents at the same MEDs of the lower A and E horizons at 0 m than at other distances presumably due to the borrowing of anecic earthworms (Figure3b).
Carbon inventories were calculated to the MEDs of 1.9 and 18.2 g cm-2 (Figure4). Carbon inven-tories decreased from 4.7±0.2 kg C m-2 in the front group to 3.2±0.5 kg C m-2in the rear group within the MED of 1.9 g cm-2, and the reduction in the C inventories was most evident at the en-dogeic forefront at 100 m. These inventories were only slightly smaller than the C inventories calcu-lated within the MED of 18.2 g cm-2
. As such, we focus on detailing C-mineral interactions within the MED of 1.9 g cm-2 (Figure4).
Across the entire transect, the upper A horizons (0–1.9 g cm-2 MED) had the largest fraction (35– 69 %) of the total soil C inventories (0- to 30-cm depth). The C inventories in B horizons varied from 0.68 to 3.0 kg C m-2. As the C concentra-tions and bulk densities of B horizons did not vary along the transect, the thicknesses of B horizons explained the variation in the B horizon C inventory. The four faces of excavated soil pedons (1.591.5 m2) offered large viewing areas of soil morphology and we did not find evidence of deep earthworm burrowing in the B horizons or in the lower part of the loess layers. During the vation, we searched for earthworms in the exca-vated materials but failed to find them in the B horizons. Other geochemical measures covered in the next subsections provide further evidence that OM contents in the B horizons and lower part of the loess layers were not yet affected by exotic earthworms.
Changes in the upper A horizon soil C inventory along the studied transect largely arose from changes in the light density fraction. The C inventory in the light fraction above the MED of 1.9 g cm-2 decreased from 3.4±0.2 in the front group to 1.5±0.7 kg C m-2in the rear group soils (Figure4). To the contrary, C inventory in the heavy fraction was stable and ranged from 0.6±0.2 in the front group to 1.1 ±0.4 kg C m-2 in the rear group.
Mineral Specific Surface Area (SSA)
Mineral SSA ranged from 0.6 to 4.2 m2g-1before OM removal (see the supplementary material Fig-ure S-1), and the values varied from 3.6 to 34 m2g-1 for the same samples once OM was re-moved (Figure5). In the front group soils, individ-ual values of SSAtotalranged from 5 to 37 m2g
-1
in Figure 2. Earthworm biomasses along the invasion
chronosequence in 2009 by species and functional
grouping. Thedotted lineindicates the invasion threshold.
In 2009, the invasion threshold was not documented. Therefore we used the long-term trend based on Hale
and others (2005b) and the recent observations of the
threshold in 2010 and 2011 to estimate the likely
loca-tion of threshold in 2009.L. juvenileswithin the
epi-en-dogeic group include the juveniles of the epi-enepi-en-dogeicL.
the upper A horizons. These values decreased to 6–21 m2g-1 in the rear group soils. However, the deeper A horizon (MED >1.9 g cm-2) showed greater SSAtotal in the rear group where soils were
mixed by the endogeic species than in the front group soils. We found little change in the SSAtotalin
the loess layer below MEDs of 15 g cm-2(14-cm depth).
Organic Matter Coverage of Mineral
Surface
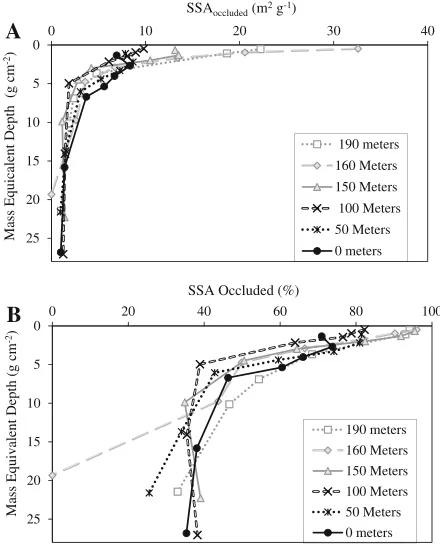
With epigeic earthworms (from 190 to 160 m), the OM-coated SSA (SSAoccluded) increased. However,
in the areas populated with epi-endogeic earth-worms (150 m), SSAoccluded abruptly decreased.
Another step decrease occurred with endogeic earthworms (100 m). In the soils at 0 and 50 m where anecic,L. terrestris was present, we found a subsoil peak of SSAoccluded, within the deepened A
horizons (Figure6a).
The percent of mineral SSA covered by OM (%SSAoccluded) clearly differed between the front
and rear group soils (Figure6b). Most (98 %) mineral surface area was covered by OM above the MED of 1.9 g cm-2of the front group soils. In the rear group soils, however, less than approximately 80 % of the mineral surface area was covered by OM within the same MED.
DISCUSSION
Representativeness of the Data
In 2001, the invasion threshold was at 110 m (Hale and others 2005a). In eight years, the invasion threshold had advanced to 150 m at the averaged rate of about 5 m y-1
, which was comparable to the 6 to 10 m y-1that was reported for the period between 1999 and 2001 (Hale and others2004). In addition to the consistent rates of invasion pro-gression along the transect, the observed spatial patterns in the biomasses of different earthworm functional groups (Figure2) agreed well with the former earthworm monitoring data at the site by Hale and others (2005b). They found that epigeic
B
A
0
10
20
30
40
50
60
0 10 20 30 40 50
Depth (cm)
Carbon Concentration (Wt %)
0
5
10
15
20
25
0 10 20 30 40 50
Mass Equivalent Depth (g cm
-2)
Carbon Concentration (Wt %)
190 Meters
160 Meters
150 Meters
100 Meters
50 Meters
0 meters Leaf Litter
0
5
10
15
20
25
0 10 20 30 40 50
Carbon Concentration (Wt %)
190 Meters 160 Meters
150 Meters
100 Meters 50 Meters
0 meters Leaf Litter
Figure 3. ADepth profiles of C
concentrations andB
mass equivalent depth profiles of C
earthworms were the group that first invaded along this transect, followed by endogeic, then by anecic earthworms. The existing earthworm biomass data, including the results from this study, consistently showed that the diversity of earthworm functional groups increased with the duration of earthworm invasion.
These observed rates of invasion and distribu-tions of earthworm functional groups were mir-rored by our soil morphology and C content data,
0
5
10
15
20
25
0 5 10 15 20 25 30 35 40
Mass Equivalent Depth (g cm
-2)
SSAtotal(m2 g-1)
190 meters
160 Meters
150 Meters
100 Meters
50 Meters
0 meters
Figure 5. Mass equivalent depth profiles of SSAtotal
(after the removal of organic matter). Note that the most
significant changes in the values of SSAtotalbetween the
frontal group (150, 160, and 190 m) and rear group (0,
50, and 100 m) occurred in the top 10 g cm-2
of MED.
A
B
05
10
15
20
25
Mass Equicalent Depth (g cm
-2)
SSAoccluded(m2g-1)
190 meters 160 Meters 150 Meters 100 Meters 50 Meters 0 meters
0
5
10
15
20
25
0 10 20 30 40
0 20 40 60 80 100
Mass Equivalent Depth (g cm
-2)
SSA Occluded (%)
190 meters 160 Meters 150 Meters 100 Meters 50 Meters 0 meters
Figure 6. Mass equivalent depth profiles ofASSAoccluded
andBthe percent fraction of SSAoccludedrelative to the
SSAtotal. Note that SSAoccludedvalues changed most in the
upper A horizon (that is,<MED of 1.9 g cm-2).
0.49 0.43
0.93 0.72
1.97
0.62
3.08 3.36
3.73
1.16 0.53
2.92
0 1 2 3 4 5 6
190 160
150 100
50 0
CInventory
(kg
C
m
-2)
Distance (m)
Heavy fraction Light fraction
Figure 4. Soil C inventory (solid lateral line) in the light (<2.0 g cm-3) and the heavy (>2.0 g cm-3) fractions to the MED
of 1.9 g cm-2
(A horizon) and soil C inventory to the MED of 18.2 g cm-2
(dotted lateral line) that includes the newly
created lower layer of A horizon by earthworm driven mixing and the loess layer. Thesolid vertical line represents the
forefront of endogeic species that divides the studied transect into the front and rear groups, and thedotted linerepresents
which supports our contention that six strategically placed soil pits in a design that balanced existing site knowledge with comprehensive laboratory analyses was a reasonable approach to decipher dynamic soil C responses to earthworm invasion.
Role of Exotic Earthworms in Controlling
Total Mineral SSA
In all examined soils, SSAtotal decreased with
increasing soil depth in the A horizon, and this depth trend was particularly pronounced in the front group soils (Figure5). The source of the
SSAtotal in A horizons may have been secondary
phyllosilicate minerals such as illite/smectite and kaolinite; SSAtotal and these secondary
phyllosili-cate minerals were similarly distributed with depth in soil profiles (see supplementary data Figure S-2. For kaolinite data, see Resner and others 2011). Kaolinite has SSA ranging from 10 to 20 m2g-1, illite has SSA of 70 to 120 m2g-1, and smectite has SSA of 600 to 800 m2g-1, with more than 80 % of that SSA associated with internal layers of smectite (Essington2004).
With the presence of epi-endogeic earthworms (150 and 100 m), the upper A horizon had declining SSAtotal. This change was further
accom-panied by increased SSAtotalin the lower A horizon
(1.9 to 6.7 g cm-2) of the soils at 0 and 50 m (Figure5). The most straightforward explanation for this shift was vertical mixing of A horizons with underlying loess layers by epi-endogeic and endo-geic species. Depth profiles of secondary phyllosi-licate minerals were more homogeneous in the rear group soils (see supplementary material Figure S-2). Likewise, silt and fine sand particles from the loess layer must have been incorporated into the expanding A horizon. The loess layer, dominated by quartz and potassium plagioclases (Resner
2013), was remarkably homogeneous along the transect in its mineralogy and had a consistently low SSA of approximately 3.36 ±0.42 m2 g-1 (Figure5).
We estimated the extent to which loess layer materials were mixed into the A horizon and its impact on decreasing the averaged SSAtotal in the
upper A horizons. Our measurements of A hori-zon thicknesses and bulk densities (data not shown) revealed that both quantities increased with greater earthworm invasion, which had been previously shown at the study site (Hale and others 2005a). Based on the increasing mass of A horizon per ground surface area, we calculated that the exotic earthworms would incorporate approximately 0.4 kg m-2 of the loess materials
into the A horizon with each meter of advance through the forest soil.
This calculation, when combined with the SSAtotal of the loess layer, suggested that the
aver-aged SSAtotal of the A horizon should have
de-creased by 2.7 m2 g-1 over the length of invasion transect, which overestimated the observed reduction (Figure7). This discrepancy may have arisen because invasive earthworms simulta-neously increased pedogenic crystalline (dithionite citrate extraction) and amorphous (ammonium oxalate extraction) Fe oxides in the soils (see sup-plementary material Figure S-3a, b). Secondary Fe oxides extractable by dithionite citrate and ammonium oxalate are known to have high SSA (Pronk and others 2011). For instance, ferrydy-drites have SSAs of 200–400 m2g-1, amorphous oxides have SSAs of 305–412 m2g-1, and crystal-line Fe oxides have SSAs of 116–184 m2 g-1 (Borggaard1982; Cornell and Schwertmann2003). Our measurements do not inform what fraction of SSAtotal is explained by the secondary iron oxides,
but both Pronk and others (2011) and Kaiser and Guggenberger (2000) found that crystalline Fe oxides were most likely the primary sources of mineral SSA in both agricultural and forested environments.
The increase in the concentrations of the two iron oxide pools from the front to rear group soils matched the furthest advance of the endogeic earthworm at 100 m and the presence of epi-en-dogeic earthworm between 150 and 100 m (Fig-ure2). Because earthworm guts are anoxic (Drake
0
averaged 1.9 g cm
-2
Figure 7. Measured, expected, and averaged mineral
to-tal surface area within upper A horizons. Thegrey colored
linerepresents the expected trend of averaged SSAtotalin A
horizons (to the MED of 1.9 g cm-2
) if changes in the
mineral SSAtotalin the A horizon was solely due to the
mixing-driven inclusion of low SSA loess materials into
the A horizon. Thedark solid linerepresents actual SSAtotal
found along the transect. Thesolid vertical linedivides the
front and rear groups, and thedotted vertical linerepresents
and Schramm 2006), Fe in soil materials ingested by geophagous endogeic earthworm (in particular,
Apporectodea) may be reduced and become soluble upon passage through the gut. The dissolved Fe may later be re-oxidized and re-precipitated as Fe oxides in the aerobic environment. For example, Fe oxides increased as soil materials passed through earthworm guts (Oyedele and others 2006). Like-wise, the increased SSAtotal of the newly created
lower A horizon (1.9 to 6.7 g cm-2) in rear group soils (Figure5) may be explained by the physical inclusion of secondary phyllosilicate minerals into the loess layer and the biogeochemical production of secondary iron oxides.
Though not shown in Figure5, the values of SSAtotalof the materials in the B horizons
immedi-ately beneath the loess layer were 11.6±0.9 m2g-1, substantially greater than those in the loess layer.
30 40 50 60 70 80 90 100
% SSAoccluded (%)
SSAtotal (m2 g-1)
190 Meters 160 Meters 150 Meters 100 Meters 50 Meters 0 Meters
30 40 50 60 70 80 90 100
0 5 10 15 20 25 30 35 40
0 5 10 15 20 25 30 35 40
% SSAoccluded (%)
SSAtotal (m2 g-1)
190 Meters 160 Meters 150 Meters 100 Meters 50 Meters 0 Meters
A
B
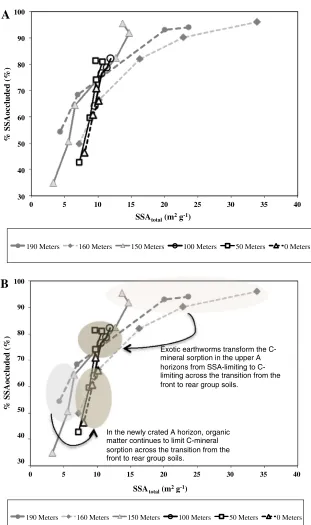
Exotic earthworms transform the C-mineral sorption in the upper A horizons from SSA-limiting to C-limiting across the transition from the front to rear group soils.
In the newly crated A horizon, organic matter continues to limit C-mineral sorption across the transition from the front to rear group soils.
Figure 8. Relationship
between theA
%SSAoccludedwith respect
to SSAtotalandBthe same
The B horizons with peak clay contents were found to have SSAtotal of 20.7±6.0 m2g
-1
. Therefore inclusion of a small amount of B horizon materials into the overlying loess layer could increase its SSAtotal significantly. However, in agreement with
the negligible presence of earthworms below the A horizon described above, there was little change in the SSAtotalof the loess layer near the boundary to
the underlying clay-rich B horizon.
Therefore, we rejected the first hypothesis that burrowing earthworms (epi-endogeic, endogeic, and anecic species) increased mineral SSA in the A horizon by incorporating clay minerals from the underlying clay-rich B horizons. Instead, earth-worm bioturbation was largely limited to mixing within A horizons and between A horizons and the underlying loess at the study site.
Limiting Factors for OM Sorption on
Mineral Surface
We hypothesized that greater mixing by earth-worms would increase the size and fraction of OM-occluded mineral surface area by enhancing phys-ical contact between OM and mineral surfaces. Our results were not consistent with this hypothesis. The soils inhabited only by epigeic earthworm species have not only larger SSAoccluded but also
generally higher percentages of SSAtotal covered
with OM in upper A horizons (Figure 6a, b). With the arrival of epi-endogeic and endogeic earth-worms, less mineral surface area was present in upper A horizons (discussed above) and smaller fractions of the surface area were covered with OM. It is also notable that the upper A horizon of the soil at 150 meter represented the transition in
SSAoccluded from the front to rear groups but
clearly belonged to the front group in terms of %SSAoccluded.
It appears that OM-mineral sorption was limited by available mineral surface area prior to the arrival of endogeic earthworms (Figure8). Within the MED of 1.9 g cm-2, no less than 97 % of the total mineral surface area, over the range from 13 to 35 m2g-1, was consistently covered by OM (Fig-ure 8b). It is reasonable to assume that the remaining approximately 3 % of the OM-free mineral surface area originated from primary minerals like quartz and plagioclase which are non-reactive for the sorption of OM. All available min-eral surface was occluded by OM where the highest contents of light-fraction carbon were also ob-served.
With the arrival of endogeic earthworms, how-ever, OM-sorption on mineral surface in the upper A
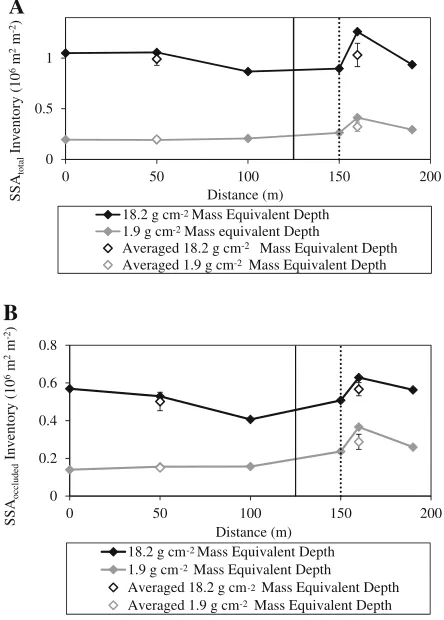
horizon appears to become limited by mineral-free or light fraction OM (Figure8b). The inventory of light fraction C in the upper A horizon was reduced by half from 3.4±0.2 kg C m-2in the front group soils to 1.5±0.7 kg C m-2 in the rear group soils (Figure4) as endogeic earthworms consumed and vertically rearranged soil OM. To examine mineral availability for OM sorption, we calculated the inventory of total mineral surface area within the same upper A horizon where MED was 0 to 1.9 g cm-2 (Figure9a). There was 0.32±0.0469 106m2of SSAtotalin the upper A horizon per ground
surface area of 1 m2 in the front group. This value decreased to (0.19±0.044)9106m2 in the rear group, a reduction by 40 % (Figure9a). A still smaller fraction of the mineral surface area was covered by OM in the rear group soils than in the front group soils. Such dramatic reductions in SSAtotal were still less than the reduction of light
fraction C (Figure4). Such disproportionate reduc-tions in mineral surface area and mineral-free OM
B
18.2 g cm Mass Equivalent Depth 1.9 g cm Mass equivalent DepthAveraged 18.2 g cm Mass Equivalent Depth Averaged 1.9 g cm Mass Equivalent Depth
-2 18.2 g cm Mass Equivalent Depth 1.9 g cm Mass Equivalent Depth
Averaged 18.2 g cm Mass Equivalent Depth Averaged 1.9 g cm Mass Equivalent Depth
-2 -2
-2 -2
Figure 9. A-horizon inventories of A SSAtotal and B
SSAoccluded. Changes in soil bulk densities and A horizon
thicknesses were considered in the calculation of
inven-tories. Thesolid lineseparates the front and rear groups,
may have caused a shift from mineral-limitation to OM-limitation in controlling OM-sorption on min-erals with the invasion of endogeic earthworms.
Regarding this transition from mineral-limitation to OM-limitation, the upper A horizon at 150 me-ter offers an opportunity to examine a transitional state. Here, epi-endogeic earthworms had incor-porated loess materials into the A horizon and re-duced SSAtotal in the upper A horizon (Figure5).
Such a reduction in SSAtotal occurred, however,
while the C content in the upper A horizon was reaching the maximum values observed over the entire transect (Figure 3b). Here, epi-endogeic mixing of litter layer into mineral soil had enriched carbon content in the upper A horizon, but the accelerated endogeic consumption of the organic matter in the upper A horizon had not yet oc-curred. The combined effect was that OM-mineral sorption in the upper A horizon continued to be limited by mineral surface area.
For the lower A horizons that were newly cre-ated by mixing of A horizons and loess layers, the slight increase in the SSAtotalin the rear group soils
occurred due to mixing of secondary phyllosilicate clay mineral and iron oxides from the pre-existing A horizons into the loess layer. Such increases in SSAtotal, however, did not result in similar increases
in SSAoccluded(Figure6a, b). We concluded that, as
the upper portion of the loess layer was mixed into lower A horizons by earthworms, this zone con-tinued to be OM-limiting in terms of OM-sorption on minerals.
Therefore, within the A horizons, there were contrasting changes in factors that limited C-min-eral sorption along the earthworm invasion tran-sect. The A horizon thickness varied along the transect. If we had considered the A horizon as one entity affected by earthworm activity, which has been typical of biogeochemical studies of invasive earthworms, we would not have identified changes in mechanisms that controlled C-mineral sorption. It should be, however, noted that the contribution of newly created lower A horizon in the soil C inventory was negligible (Figure4) relative to the upper A horizon.
Organic Matter Sorption on Mineral
Surface and Soil Carbon Inventory
Despite reductions in A horizon inventories of C across the transition from the front to rear group soils, the inventories of the heavy fraction C re-mained indistinguishable across the transition (Figure4). Although a limited number of soil sampling pits prevents generalization, it is notable
that the heavy fraction C inventory was particu-larly high at 50 m where the presence of endogeic and anecic species was strongest (Figure2). This trend, however, was not consistent with the ob-served SSAoccluded. The inventories of SSAoccluded,
within the MED of 1.9 g cm-2, decreased from 0.29±0.049106m2m-2 in the front group to 0.15±0.005 9106m2m-2 in the rear group (Figure9a, b). Two potential mechanisms may have contributed to the discrepancy. Coverage of mineral surface with OM was found to be patchy rather than continuous (Kaiser and Guggenberger
2003; Ransom and others1998), and multi-layered (Kleber and others 2007) rather than mono-lay-ered (Mayer1999). As endogeic earthworms affect OM-mineral sorption by mixing soils and ingest OM and minerals, OM sorption on mineral surface may have become more patchy resulting in re-duced %SSAoccluded.
Second, the persistent heavy fraction OM may be due to increased aggregation in soils inhabited by endogeic species. Along the studied transect, the pre-endogeic soils had A-horizon materials that were largely structureless and free of aggregates. However, A-horizon soils with endogeic species had strong medium size granular structure, which may have contributed to physically occluding OM and thus maintaining heavy fraction carbon. The way that mineral-occlusion of C responded to earthworm bioturbation may thus be distinct from that of mineral-C sorption. Although the decreases in mineral SSA and OM negatively affected C sorption onto mineral surface in this study, our field observation revealed a greater degree of mineral aggregation. Therefore, impacts of exotic earthworms on mineral-associated soil C inventory may not only be dependent upon absolute and relative abundances of soil OM and mineral surface area and sorption mechanisms but also be subject to somewhat independent formation of aggregates affected by exotic earthworms.
reconcile why findings have varied among earth-worm-invaded sites.
CONCLUSION
We rejected our hypotheses that earthworms would increase mineral SSA of A horizon materials by upwardly moving the clay rich B horizon materials into A horizons and would enhance OM sorption on mineral surfaces by mixing them. Both endogeic and anecic earthworms did not burrow below the loess layer at our site. Had the A horizon directly overlain a less dense clay rich B horizon, earthworm driven soil mixing may have increased SSAtotal in the A horizon with a potential to sorb
more OM. This scenario suggests that the effects of invasive earthworms on C-mineral sorption and thus soil C storage could be further determined by initial soil properties such as horizonation, miner-alogy, and texture and the behavioral responses of exotic earthworms to the soil properties.
Our study highlights that the limiting factor on OM-mineral sorption in the upper A horizons shifted from available mineral surface area before endogeic invasion to available OM after endogeic invasion. In other words, exotic endogeic earth-worms deplete the available OM pool at a rate faster than sorption of OM on new mineral surface. At our study site, earthworm driven mixing thick-ened A horizon. However, as our analysis showed, C-mineral sorption in this newly created zone re-mained OM-limiting and was far from negating the loss of C observed in the upper A horizon. Whether there exist systems where new OM-mineral sorp-tion balances or outweighs OM-consumpsorp-tion is an intriguing question that remains to be tested. This shift in OM-mineral interactions occurred within 10 years of the arrival of endogeic earthworms, illustrating the efficiency with which exotic earth-worms affect the key ecosystem process in formerly earthworm-free glaciated forests. We refuted our original hypotheses but determined some under-lying mechanisms, which shows a strong potential for applying this approach to other soil systems influenced by bioturbators.
A C K N O W L E D G E M E N T S
This study was financially support by a USDA NRI Grant to K. Yoo, A.K. Aufdenkampe, and C.Hale. Yoo’s effort was partly covered by Hatch funding from Agricultural Experiment Station. We thank Cristina Fernandez, Jim Barott and Becky Knowles for their help in the field. We also appreciate de-tailed and constructive comments by our colleagues:
Lee Frelich at the University of Minnesota, Don Ross at the University of Vermont and Kurt Smemo at the Holden Arboretum. We thank constructive com-ments from two anonymous reviewers.
R E F E R E N C E S
Adams MB, Loughry LH, Plaugher LP. 2004. Experimental Forests and Ranges of the USDA Forest Service. Newtown Square (PA): US Department of Agriculture.
Alban DH, Berry EC. 1994. Effects of earthworm invasion on morphology, carbon and nitrogen of a forest soil. Appl Soil Ecol 1:243–9.
Baldock JA, Skjemstad JO. 2000. Role of the soil matrix and minerals in protecting natural organic materials against bio-logical attack. Org Geochem 31(7):697–710.
Bohlen PJ, Pelletier D, Groffman PM, Fahey TJ, Fist MC. 2004a. Ecosystem consequences of exotic earthworm invasion of north temperate forests. Ecosystems 7:1–12.
Bohlen PJ, Pelletier DM, Groffman PM, Fahey TJ, Fisk MC. 2004b. Influence of earthworm invasion on redistribution and retention of soil carbon and nitrogen in northern temperate forests. Ecosystems 7:13–27.
Bohlen PJ, Scheu S, Hale CM, McLean MA, Migge S, Groffman PM, Parkinson D. 2004c. Non-native invasive earthworms as agents of change in northern temperate forests. Front Ecol Environ 2(8):427–35.
Borggaard OK. 1982. The influence of iron oxides on the surface area of soil. J Soil Sci 33:443–9.
Burtelow AE, Bohlen PJ, Groffman PM. 1998. Influence of exotic earthworm invasion on soil organic matter, microbial biomass and denitrification potential in forest soils of the northeastern United States. Appl Soil Ecol 9:197–202. Chiou CT. 1990. The surface area of soil organic matter. Environ
Sci Technol 24:1164–6.
Cornell RM, Schwertmann U. 2003. The iron oxides: structure, properties, reactions, occurrences and uses. Weinheim (DE): Wiley. p 664.
Crooks J. 2002. Characterizing ecosystem-level consequences of biological invasions: the role of ecosystem engineers. Oikos 97:153–66.
Drake HL, Schramm HMA. 2006. Earthworm gut microbial bi-omes: their importance to soil microorganisms, denitrification, and the terrestrial production of the greenhouse gas N2O. Soil Biol 6:65–87.
Eberl DD. 2003. User’s guide to Rockjock: a program for deter-mining quantitative mineralogy from powder X-ray diffraction data. US Geological Survey Open-File Report: 03-78. p. 46. Essington ME. 2004. Soil and water chemistry: an integrative
approach. Boca Raton (FL): CRC Press. p 534.
Eusterhues K, Rumpel C, Ko¨gel-Knabner I. 2005. Organo-min-eral associations in sandy acid forest soils: importance of specific surface area, iron oxides and micropores. Eur J Soil Sci 56:753–63.
Frelich LE, Hale CM, Scheu S, Holdsworth AR, Henegham L, Bohlen PJ, Reich PB. 2006. Earthworm invasion into previ-ously earthworm-free temperate and boreal forests. Biol Invasions 8:1235–45.
Hale CM, Frelich LE, Reich PB. 2004. Allometric equations for estimation of ash-free dry mass from length measurements for selected European earthworm species (Lumbricidae) in the western Great Lakes region. Am Midl Nat J 151(1):179–85. Hale CM, Frelich LE, Reich PB, Pastor J. 2005a. Effects of
Euro-pean earthworm invasion on soil characteristics in northern hardwood forests of Minnesota, USA. Ecosystems 8:911–27. Hale CM, Frelich LE, Reich PB. 2005b. Exotic European
earth-worm invasion dynamics in northern hardwood forests of Minnesota, USA. Ecol Appl 15:848–60.
Hale CM, Frelich LE, Reich PB. 2006. Changes in cold-temperate hardwood forest understory plan communities in response to invasion by European earthworms. Ecology 87:1637–49. Hale CM. 2007. Earthworms of the Great Lakes. Duluth (MN):
Kollath and Stensaas Publishing. p 36.
Hale CM, Frelich LE, Reich PB, Pastor J. 2008. Exotic earthworm effects on hardwood forest floor, nutrient availability and native plants: a mesocosm study. Oecologia 155:509–18. Hendrix PF, CallahamMA MA, Drake JM, Huang CY, James SW,
Snyder BA, Zhang W. 2008. The global problem of introduced earthworms. Ann Rev Ecol Evol Syst 39:593–613.
Hendrix PF, Bohlen PJ. 2002. Exotic earthworm invasions in North American: ecological and policy implications. BioSci-ence 52(9):801–11.
Holmgren GGS. 1967. A rapid citrate-dithionate extractable iron procedure. Soil Sci Soc Am Proc 31:210–11.
Kaiser K, Guggenberger G. 2000. The role of DOM sorption to mineral surfaces in the preservation of organic matter in soils. Org Geochem 31:711–25.
Kaiser K, Guggenberger G. 2003. Mineral surfaces and soil or-ganic matter. Eur J Soil Sci 54:219–36.
Kaiser K, Guggenberger G. 2007. Sorptive stabilization of organic matter by microporous goethite: sorption into small pores vs. surface complexation. Eur J Soil Sci 58:45–59.
Kleber M, Sollins P, Sutton R. 2007. A conceptual model of organo-mineral interactions in soils: self-assembly of organic molecular fragments into zonal structures on mineral surfaces. Biogeochemsitry 85:9–24.
Lawrence AP, Bowers MA. 2002. A test of the ‘hot’ mustard extraction method of sampling earthworms. Soil Biol Biochem 34:549–52.
Mayer LM. 1999. Extent of coverage of interal surfaces by or-ganic matter in marine sediments. Geochim Cosmochim Acta 63(2):207–15.
McKeague JA, Day JH. 1966. Dithionite and oxalate-extractable Fe and Al as aids in differentiating various classes of soils. Can J Soil Sci 46:13–22.
Minnesota State Climatology Office. 2003. Minnesota climatology working group website http://climate.umn.edu, Minnesota Department of Natural Resources and the University of Minne-sota, Department of Soil, Water and Climate, St. Paul, MN 55108. Oyedele DJ, Schjønning P, Amunsan AA. 2006. Physiochemical properties of earthworm casts and uningested parent soil from selected sites in southwestern Nigeria. Ecol Eng 28:106–13. Pronk GJ, Heister K, Ko¨gel-Knabner I. 2011. Iron oxides as
major available interface component in loamy arable topsoils. Soil Sci Soc Am J 75:2158–68.
Ransom B, Kim D, Kastner M, Wainwright S. 1998. Organic matter preservation on continental slopes: importance of
mineralogy and surface area. Geochim Cosmochim Acta 62:1329–45.
Remusat L, Hatton Pierre-Joseph, Nico Peter S, Zeller Bernd, Kleber Markus, Derrien Delphine. 2012. NanoSIMS study of organic matter associated with soil aggregates: advantages, limitations, and combination with STXM. Environ Sci Technol 46:3943–9.
Resner KE. 2013. Impacts of earthworm bioturbation on ele-mental cycles in soils: An application of a geochemical mass balance to an earthworm invasion chronosequence in a sugar maple forest in Northern Minnesota. MS thesis. University of Minnesota. p 182.
Resner KE, Yoo K, Hale C, Aufdenkampe A, Blum A, Sebestyen S. 2011. Elemental and mineralogical changes in soil due to bioturbation along an earthworm invasion chronosequence in northern Minnesota. Appl Geochem 26:S127–31.
Reynolds JW. 1977. The earthworms (Lumbricidae and Sparg-anophilidae) of Ontario. Toronto (ON): Royal Ontario Mu-seum Miscellaneous Publication.
Scheu S, Parkinson D. 1994a. Effects of earthworms on nutrient dynamics, carbon turnover and microorganisms in soil from cool temperate forests of the Canadian Rocky Mountains: laboratory studies. Appl Soil Ecol 1:113–25.
Scheu S, Parkinson D. 1994b. Effects of invasion of an aspen forest (Canada) by Dendrobaena octaedra (Lumbricidae) on plant growth. Ecology 75:2348–61.
Schmidt MWI, Torn MS, Abiven S, Dittmar T, Guggenberger G, Janssesn IA, Kleber M, Ko¨gel-Knabner I, Lehmann J, Man-ning DAC, Nannipieri P, Rasse DP, Weiner S, Trumbore SE. 2011. Persistence of soil organic matter as an ecosystem property. Nature 478:49–56.
Schwert, DP. 1990. Oligochaeta: Lumbricidae. Dindal DL, editor. Soil biology guide. New York: John Wiley and Sons. p.341-356.
Sollins P, Kramer M, Swantson C, Lajtha K, Filley T, Aufdenk-ampe A, Wagai R, Bowden R. 2009. Sequential density frac-tionation across soils of contrasting mineralogy: evidence for both microbial- and mineral-controlled soil organic matter stabilization. Biogeochemistry 96:209–31.
Torn MS, Trumbore SE, Chadwich OA, Vitousek PM, Hendricks MD. 1997. Mineral control of soil organic carbon storage and turnover. Nature 389:170–3.
Torresan M. 1987. The use of sodium polytungstate in heavy mineral separations. US Geological Survey Open-File Report. pp 87–590
von Lutzow M, Ko¨gel-Knabner I, Ekschmitt K, Matzner E, Guggenberger G, Marschner B, Flessa H. 2006. Stabilization of organic matter in temperate soils: mechanisms and their rel-evance under different soil conditions: a review. Eur J Soil Sci 57:426–45.
Wagai R, Mayer LM, Kitayama K. 2009. Extent and nature of organic coverage of soil mineral surfaces assessed by a gas sorption approach. Geoderma 149:152–60.
Webb PA, Orr C. 1997. Analytical methods in fine particle technology. Norcross (GA): Micromeritics Instrument Corp. p p301.