(VDM) derived using refracted wave data and VTI isotropy calculations, as well as iterative refinement of the VDM top portion and the complete model using model-based anisotropic tomography and well tie tomography. A conditional anisotropic VDM (Fig. 1) was developed using the serial iteration method, to perform LAD imaging.
The Effect of Full-Azimuth Local Angle Domain
(LAD) Imaging when Studying Terrigenous and
Carbonate Reservoirs under Complex In-Situ
Conditions in Eastern Siberia*
PARADIGM CUSTOMER STORY
The Challenge
Historically, Eastern Siberia has been one of the most difficult areas for seismic studies attempting to prospect for and predict reservoir properties. Complex relief and subsurface velocity heterogeneity in both vertical and lateral directions creates problems for seismic survey operations and for seismic data processing. The greatest challenges occur in depth processing, where specific complexities hinder the development of a depth/velocity model, beginning with near surface formations and the top portion of the geologic profile.
Local lithological variations in the lateral direction, accompanied by the surface exposure of rocks of various ages and lithological characteristics (from carbonates to clays, salt-bearing strata, and sometimes trapped intrusions) make it necessary to develop complex velocity models and apply full-azimuth depth surveys which traditional approaches and migrations, based on the Kirchhoff integral, cannot provide.
GazpromNeft NTC, a high-tech company that strives to incorporate the most advanced systems into its operations, opted to use the Paradigm EarthStudy 360® full-azimuth local angle domain (LAD) imaging and
analysis technology on a pilot project in Eastern Siberia.
The Solution
In order to obtain more reliable information about the environmental depth structure and estimate major hydrocarbon reservoir parameters, the EarthStudy 360 technology, used to obtain and interpret full-azimuth seismic images, including AVAZ anisotropic tomography and HTI anisotropic inversion, was successfully introduced for the first time at an oil and gas field in this region. In addition, during depth processing a complex workflow was used to perform depth velocity model building using the built-in upper part of the interval velocities obtained by the refraction statics, followed by the application of Paradigm’s new well tie tomography.
3D data was obtained based on a full-azimuth surface seismic survey with an active pattern length-to-width ratio of 2000m and an average fold of 100. A group of vibration sources was used to excite elastic fluctuations.
The velocity-depth model used new methodologies, including a 3D velocity model in the near-surface portion of the velocity-depth model
Figure 1A. The initial velocity-depth model obtained using the coherent inversion method.
Evaluation of data quality, images, attributes and properties
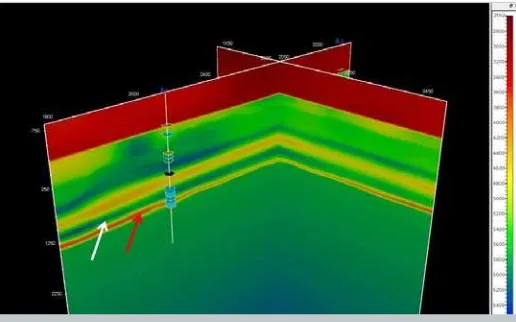
An evaluation of the quality of the data obtained using LAD imaging was conducted through a comparison of images with the Kirchhoff migration and based on various attributes for both migrations. Comparative inline sections of amplitude cubes are shown in Figure 4 for final images produced using the Kirchhoff and LAD migrations. A visual comparison reveals higher image quality in terms of seismic horizon continuity, an increase in the traceability level and reflection detail from the target reservoirs and the basement (designated with arrows). Reduced migration noise and more accurate transition zones are observed; when used together, they help obtain unambiguous resolutions for complex interference zones (marked with ovals). This, in turn, leads to a more accurate understanding of the image as a whole, and provides new, geologically important details, to clarify the basement boundary and positions of the roof and floor of terrigenous Vendian deposits, as well as more details about the prospective carbonate stratum and clarifying structural correlation. The qualitative enhancement of information is even more critical, as the LAD technology uses completely azimuthal information and correctly interpolates traces during the migration. In particular, the effect of the lower “closure” zones related to the lack of long offsets may be seen in the top portion of the seismic section in Fig. 5. Moreover, new minor discontinuities are visible in LAD results for this zone, in addition to the overall increased traceability.
Quantitative evaluations of quality improvements for the signal-to-noise ratio (SNR) show that it almost doubled in value: from 6 (Kirchhoff) to 11.5 (LAD).
Comparison
Evaluation of quality and sensitivity in the coherence cube, and in dip, azimuth, and continuity (DAC) attributes
A coherence cube is an additional tool for indirectly measuring the degree of heterogeneity (or boundary roughness) in the subsurface. It can provide valuable information about faults, cracks and other heterogeneities.
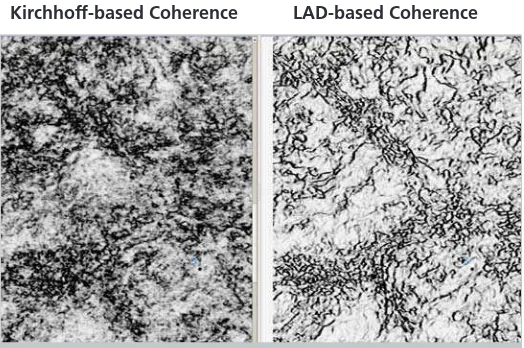
Fig. 6 shows a comparison of maps extracted from coherence cubes calculated using Kirchhoff and LAD migrations.
A comparison of coherence maps for the different migrations shows signs of individual faults, visible in maps based on a Kirchhoff cube; however, there are also visible unresolved heterogeneity clusters. A higher-resolution image in a slice of the LAD-based coherence cube clearly shows large and small faults, their combination and fractal hierarchy, as well as mega-cracks or clusters, and individual lineations of other heterogeneities.
Dip, azimuth, and continuity (DAC) are important attributes that enable us to determine and qualify, at each point, the directivity of the Normal vector to the subsurface reflecting surfaces. The continuity attribute provides a concrete understanding of reflection boundary continuity in the first Fresnel Zone, or the absence of such borders (in this case, a heterogeneity is located there and represented by previously diffracted waves). This information is extracted
automatically from seismic data by evaluating these attributes’ values. There is one fundamental difference, however: This information is extracted from stack data in the Kirchhoff migration, whereas in the LAD migration, it is extracted from directional gathers (based on the use of a beam of rays tracing at each point). To this end, DAC information extraction from LAD data is a direct method, while DAC extraction from Kirchhoff calculated by summation is an indirect method. Therefore, DAC information should be a priori more accurate and reliable in the case of LAD migrations. This difference is like that between prestack and poststack migrations in terms of image quality and reliability.
Figure 6. Comparison of data quality at the coherence map level. Reservoir floor.
Kirchhoff-based Coherence LAD-based Coherence
Figure 4. Comparison of final images. Inline section 1. Well 2 - production well. V - Vendian, F – basement
LAD Migration Kirchhoff Migration
Kirchhoff Migration LAD Migration
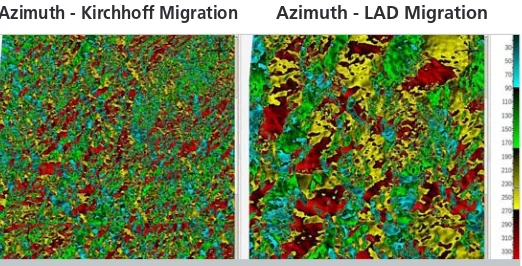
Figure 8. Data quality comparison at the dip azimuth attribute map level. Target horizon.
Integrated interpretation of LAD migration output data and conclusions
It is recommended that integrated interpretation of LAD results be conducted after analysis of the amplitude cubes and their various slices, with a joint analysis of amplitude and DAC cubes, as well as boundary coherence and curvature cubes. Examples of this analysis are shown in Figs. 9-12. Integrated interpretation of this information can be used to identify both old and new seismic objects (such as discontinuities of various scales, heterogeneities related to karsting processes, etc.) and to link them to each other in terms of understanding and clarifying the geological structure of a section per se and hydrocarbon reservoirs. Then, integrated analysis and prediction of cubes for HTI anisotropy and various parameters of a reservoir obtained after amplitude (synchronous deterministic and geostatic) inversion may commence.
The Kirchhoff continuity map displays primarily border continuity, individual faults, and fuzzy shapes found in other heterogeneities. The LAD continuity map, on the other hand, shows that a presumably continuous field of reflection borders is broken down into a series of additional faults, lineaments and annular objects. More complex relationships between new objects that were “overlooked” previously become visible when the colormap is rotated.
By comparing dip boundary maps (Fig. 7), we may estimate potential increases in dip angle estimation accuracy (and object sensitivity) if this parameter is evaluated directly using LAD directional gathers as input. The colormap is identical for both. Average estimates for maximum dip angles of boundaries (or objects) are no more than 3 degrees for the dip map obtained using a Kirchhoff cube. The maximum angle for the dip map obtained using LAD imaging is 9 degrees. To put it differently, the accuracy of measurements and respectively, dip parameter sensitivity, increase by a factor of three when using LAD imaging.
Figure 7. Data quality and accuracy comparison at dip map level. Target horizon.
Dip - LAD Migration Dip - Kirchhoff migration
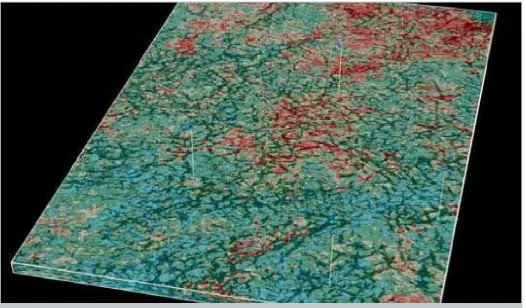
Figure 9. LAD. Integrated analysis of attribute and property cubes in a volume. Curvature + dip + azimuth, target reservoir interval. A complex relief of a horizon terrigenous subsurface is visible for this combination of attributes in 3D space relative to fault, mega-crack, and other heterogeneity zones. The overall picture looks like a 3D photo.
Figure 10. Color-coded vector map (left) of HTI anisotropy intensity (higher value - warm tone) compared to a map of reflection boundary dip angles for the terrigenous reservoir roof. Note that HTI isotropy intensity and direction are controlled by a system of faults and mega-discontinuities as well as the configuration of domed uplifts (structures) that could cause stress variations. A domed structure with maximum stress at the edges and minimum stress at the dome is circled.
Azimuth - Kirchhoff Migration Azimuth - LAD Migration
* This Customer Story is taken from an article that originally appeared in First Break, May 2017, authored by Andrey Sorokin, Gazpromneft STC; Lenar Shakirzyanov, Gazpromneft-Angara; and Alexander Inozemtsev, Vadim Soloviev and Zvi Koren, Paradigm. The authors of the article are grateful to A. I. Andronov, I. I. Kubysht, Yu. V. Pavlovskiy, E. G. Koshkarov, and the management of GazpromNeft NTC for Logistical and Technical Support of this project. A joint map of HTI intensity profiles for isotropy (warm colors) and a
system of heterogeneities (discontinuities, mega-cracks, etc.) shown in Fig. 12 demonstrates that anisotropy intensity is higher at areas located between large heterogeneities, where the intergranular porosity matrix is preserved without any significant non-elastic deformations.
Conclusions
The use of LAD technology for this project allowed us to improve the quality of the data, both in terms of quantity and sensitivity. Coherence cube slices and sections showed a clearer and more focused picture. The correlation and ranking of faults were more reliable. Using unique approaches to anisotropic VDM development during project implementation, we obtained a VDM that allowed us
pdgm.com
to improve the quality of data obtained by summation and ensure a high convergence between the seismic data and well information. The overall result of using LAD migration technology was an increase in the signal-to-noise ratio to 11.5, almost double that of a respective value of 6 for the Kirchhoff migration.
The modeling of elastic parameters based on LAD data occurred with higher correlation coefficients, indicating that a wavefield for full-azimuth depth migration was restored more correctly. There was a marked reduction in the degree of fault impact on geological body contours and the overall trend toward reducing uncertainties along faults in LAD-based maps, where reservoir sand continuity was higher. Based on the results of these efforts, the optimum locations for both appraisal and production wells scheduled for drilling were confirmed, and recommendations were made for drilling two exploration wells and one research well.
In summary, LAD imaging combines all the key approaches for studying a fault/crack system: traditional interpretation of faults, analysis of structural attributes, dissipated waves, and anisotropic properties of the environment. Pilot use of this technology under various seismic/geological conditions is of great interest to the development of seismic data processing. The twofold increase in signal-to-noise ratio using LAD technology enabled us to obtain pervasive improvements in sensitivity at each interpretation stage. Correlation in the target interval increased to 0.9, mis-ties in structure building were reduced to 3-5%, and more reliable tracing of discontinuities and correlation of reflection reservoirs was achieved. Use of RMOZ and AVAZ inversions provided novel information about HTI anisotropy intensity and direction. This was subsequently used to develop a hypothesis of the present tectonic picture and relevant oil bearing capacity.
Figure 12. LAD. Integrated analysis of attribute and property cubes in a volume. Curvature + AVAz (HTI intensity). Higher values of HTI intensity are marked with warm colors. Targeted interval of a terrigenous reservoir.
Figure 11A. A fragment of an HTI anisotropy direction and intensity map for the color-coded and vector options. Higher values of HTI intensity are designated with warm colors. Well 2 has the highest productivity, Well 5 demonstrates some oil-bearing capacity, and Well 4 is dry.