pdgm.com
particularly complex area, the correlation between the surface offset-azimuths and the actual, in situ subsurface slowness-azimuths is relatively poor, leading to significant errors in the estimation of fracture orientation. Additionally, Kirchhoff migrations do not account for multi-pathing (multi-wave path solutions between image points and surface source/receiver locations), which is essential when imaging in areas involving complex wave phenomena.
The Solution
In order to obtain more reliable information about the huge deep structure of the carbonate reef and to estimate fracture distribution at different depth levels, the Paradigm EarthStudy 360® full-azimuth seismic imaging solution was applied. This was the first time that this technology, which included anisotropic imaging and azimuthally anisotropic inversion AVAz, was used in this region.
In order to build and image the depth velocity model (DVM), a background azimuthally isotropic model (VTI with Thomsen parameters) was used, followed by an iterative refinement of the top of the DVM using grid and model-based anisotropic tomography. Using the successive iterative approach, the final anisotropic DVM was used as input for the migration, resulting in higher resolution and more detail, especially in the target reef zone (Figure 3).
Full-azimuth imaging provided a great deal of new information about the detailed structure of the large reef at depths of 6,000 to 8,500 meters (Figures 1 and 2). It showed more precise tracing of
Applying EarthStudy 360 Full-azimuth
Angle Domain Imaging to Study Carbonate
Reefs at Great Depths in Kazakhstan*
PARADIGM CUSTOMER STORY
The Challenge
The main goal of the seismic surveys conducted in the target area in Kazakhstan was to image and detect a major Devonian carbonate barrier reef and to characterize the density and orientation of its main fracture zones.
This area is unique in that the carbonate layers occur at great depths, from 5700 to 8500 meters, with a complex structure of overburden layers (interbedded clay, sandstone, salt and others). These different lithology plays and morphology rocks create strong vertical and lateral velocity variations, resulting in complex seismic wave phenomena.
In addition, the target carbonate structures contain heterogeneous objects and require high-quality processing of the recorded data. Under such conditions, it is crucial to use full-azimuth, long-offset and dense (high fold) acquisition patterns. Advanced processing sequence tools and high-end depth migrations are required to handle both strong heterogeneity and azimuthal anisotropy effects.
Traditional Kirchhoff migrations, even the most accurate (e.g. wavefront reconstruction, beam), were not able to provide the required image quality and level of detail required at the target zones. Conventional Kirchhoff migrations generate surface offset-azimuth/offset domain common image gathers (CIG). In this
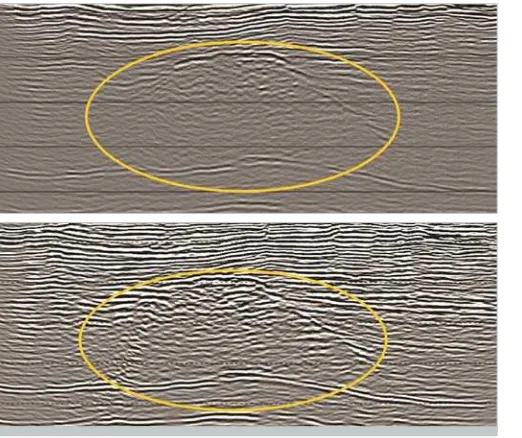
Figure 1 (top): Final depth section after PSDM Kirchhoff
Figure 2 (bottom): Final depth section after EarthStudy 360 imaging
pdgm.com
the reef contour, and of the left and right sides of the reef structures. In the reef itself, a more complex internal structure was discovered.Analysis of Geological Results
Figures 4a, 4b and 5 present the final results of EarthStudy 360 full-azimuth angle domain imaging, processing, analysis,
characterization and interpr structural carbonate reef summarized, including a recommendation for the drilling path.
pdgm.com
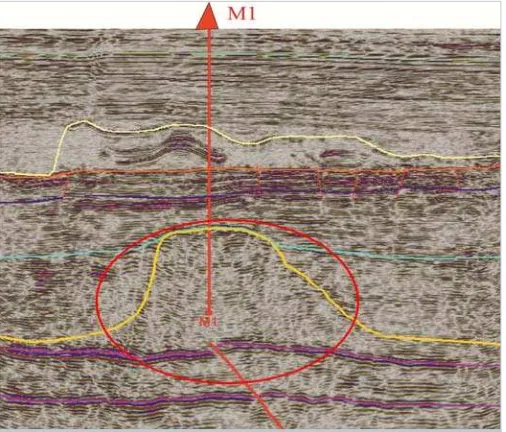
Figure 4A. Cross-section depth of the cube following EarthStudy 360 full-azimuthangle domain imaging. The red circle shows the area of the large barrier reef to a maximum of 2500 meters in thickness and width on the order of 3500 meters.
Figure 4B. Longitudinal section of a cube depth migration after EarthStudy 360 full-azimuth angle domain imaging. The red oval shows a large area of the barrier reef to a maximum of 2500 meters in thickness and a length of over 10,000 meters.
Main Results of the Structural Interpretation
A visual comparison (Figures 1 and 2) revealed a higher quality image, increasing the degree of traceability and detailed reflections from the target horizons and reef structure. Less migration noise and a more accurate focus helped to more clearly resolve a complex interference zone. This in turn, provided a more accurate representation of the object as a whole and solved two important
Figure 5. The final structural map of the top reef constructed from the EarthStudy 360 amplitude cube.
problems - clarifying the position of the top and bottom of the carbonate reef, and providing a geological interpretation of the wavefield and of potential reservoir structures.
Based on these results, we recommended an initial exploration well at a depth of 7000 meters to explore subsalt sediments, and the establishment of reserves in the Devonian part of the section in a more elevated part of the top reservoir.
The goal of exploration well M-1 was to identify the presence of carbonates of the Devonian age with good reservoir properties and profitable hydrocarbon reserves. The well should be drilled in the carbonate paleo reef of Upper Devonian Age.
Attribute and Property Analysis, and Prediction of Fractured Zones in the Reef Structure
An integrated interpretation of the results was made after analyzing the amplitude of various cubes and slices. Initially, a joint analysis was made of amplitude cubes and cubes of attributes DAC, HTI isotropic intensity and direction (after AVAz inversion), coherence and curvature.
pdgm.com
Figure 8. Use of a scattered component to clarify irregularity zones. Left: depth slice of a scattered cube at depth H = 6000 m, right: slice shows curvature attribute at the same depth.
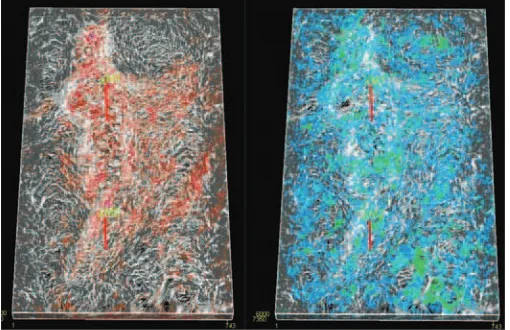
The most effective joint analysis of the cubes was the intensity and direction of HTI isotropic and volumetric curvature. Examples are shown in Figure 6.
With this combination of attributes, the complex pattern of mega-cracks in the reef is clearly visible, together with their relation to the maximum and average values of HTI intensity associated with the density of meso-fractures developed in the reef. The red vertical lines indicate the projected wells.
Another combination of attributes (Figure 7) clearly shows the zoning density distribution of meso-cracks and their relationship with mega-cracks. The trend direction of the fractures is in the range of 80-100 degrees azimuth sector of the north.
A joint analysis of the scattered components and volumetric curvature (Figures 8 and 9) shows that two independent attributes demonstrate approximately the same zones of maximum
development of mega-cracks, increasing the reliability of the prediction.
Analyzing the two different approaches to identifying irregularities of various types, it can be said that the image from the diffraction component gives more subtle and unique information about the faults and reef contours than the surface curvature attribute. This is because the diffraction component is extracted directly from the full-azimuth directional gathers, and is therefore a direct indication of irregularities. Information about the curvature of surfaces is an indirect indicator of irregularities already extracted from the stacked cube.
Figure 7. Comprehensive analysis of attribute and property cubes. Left: density of cracks + curvature; right: direction fracture + curvature. The reef body in space is shown in great detail; it is possible to lay the well with a high measure of accuracy. The colors are shown in the dominant azimuthal direction of the fractures.
Figure 9. Use of a scattered component to clarify irregularity zones. Left: A deep cut of H = 7600 m; right: A depth slice curvature attribute (MajorPrincipalCurvature_Curvate). A joint analysis of the scattered components and volumetric curvature at this depth highlights sharp heterogeneity, limiting the eastern board of the carbonate platform.
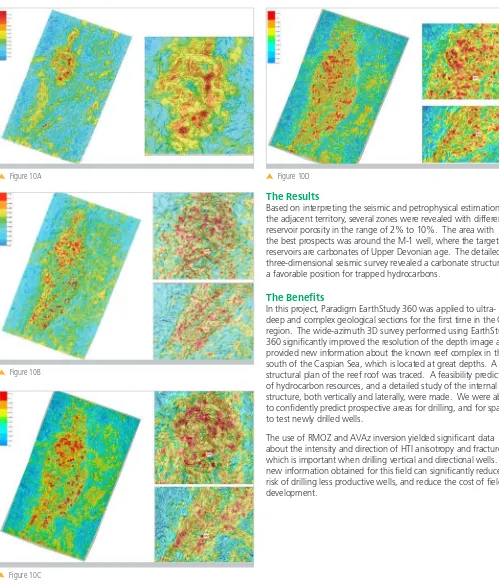
Figures 10 A, B, C and D show composite images of depth slices and fragments, curvature cubes (MajorPrincipalCurvature_ Curvate) and fracture intensity (Anisotropic_Intensity) at depths of (respectively): 5800m, 7000m, 7200m, 7400m. By comparing these figures, it can be concluded that Anisotropic_Intensity distribution (Fracture Density) in a carbonate body changes both vertically and laterally. This is important information when selecting a drilling point and the test intervals in the borehole. Attribute MajorPrincipalCurvature_Curvate, for its part, clearly delineates reef building at all depths.
pdgm.com
* This Customer Story is taken from an article that originally appeared in First Break, March 2017, authored by Bazar Eskozha and Marat Aimagambetov, ALMEX PLUS; Andrey Kondratenko and Vladimir Sementsov, Largeo; Vladimir Pankratov and Aigule Kuanysheva, Largeo Energy; and Alexander Inozemtsev, Vadim Soloviev and Zvi Koren, Paradigm. The authors of the article express their sincere gratitude to the management and specialists of LLP Company “Almex Plus” for the opportunity to perform the project in full, despite the time constraints.
Figure 10A
Figure 10B
Figure 10C
Figure 10D
The Results
Based on interpreting the seismic and petrophysical estimation in the adjacent territory, several zones were revealed with different reservoir porosity in the range of 2% to 10%. The area with the best prospects was around the M-1 well, where the target reservoirs are carbonates of Upper Devonian age. The detailed three-dimensional seismic survey revealed a carbonate structure in a favorable position for trapped hydrocarbons.
The Benefits
In this project, Paradigm EarthStudy 360 was applied to ultra-deep and complex geological sections for the first time in the CIS region. The wide-azimuth 3D survey performed using EarthStudy 360 significantly improved the resolution of the depth image and provided new information about the known reef complex in the south of the Caspian Sea, which is located at great depths. A structural plan of the reef roof was traced. A feasibility prediction of hydrocarbon resources, and a detailed study of the internal structure, both vertically and laterally, were made. We were able to confidently predict prospective areas for drilling, and for spacing to test newly drilled wells.