PROVIDING THE FIRE RISK MAP IN FOREST AREA USING A GEOGRAPHICALLY
WEIGHTED REGRESSION MODEL WITH GAUSSIN KERNEL AND MODIS IMAGES,
A CASE STUDY: GOLESTAN PROVINCE
Ali Shah-Heydari pour a, Parham Pahlavania,*, Behnaz Bigdeli b
aSchool of Surveying and Geospatial Engineering, College of Engineering, University of Tehran, Tehran, Iran b School of Civil Engineering, Shahrood University of Technology, Shahrood, Iran.
(shahheydary1372, [email protected]; [email protected])
KEYWORDS: Forest Fire, Geographically Weighted Regression, Fire Risk Map, Golestan Forest, Gaussian kernel
ABSTRACT:
According to the industrialization of cities and the apparent increase in pollutants and greenhouse gases, the importance of forests as the natural lungs of the earth is felt more than ever to clean these pollutants. Annually, a large part of the forests is destroyed due to the lack of timely action during the fire. Knowledge about areas with a high-risk of fire and equipping these areas by constructing access routes and allocating the fire-fighting equipment can help to eliminate the destruction of the forest. In this research, the fire risk of region was forecasted and the risk map of that was provided using MODIS images by applying geographically weighted regression model with Gaussian kernel and ordinary least squares over the effective parameters in forest fire including distance from residential areas, distance from the river, distance from the road, height, slope, aspect, soil type, land use, average temperature, wind speed, and rainfall. After the evaluation, it was found that the geographically weighted regression model with Gaussian kernel forecasted 93.4% of the all fire points properly, however the ordinary least squares method could forecast properly only 66% of the fire points.
1. INTRODUCTION
Forest fire is a major problem for forests across the world. The existence of geographic information about the fire occurrence is a necessary matter to deal with the fire. Fire causes the spatial pattern of vegetation and the process of human life to change as well as it can change global ecosystem due to its direct relation with carbon cycle and atmosphere composition.
To reduce the damages caused by forest fire including destruction of natural resources, environment and life of forest creatures, we should assess fire dangers. Due to the destructive nature of fire, the researches related to real fire occurrences are impractical. As an alternative, scholars use simulation models that are based on field studies to better understand the behavior and effects of fire occurrence.
The policies related to fire-fighting can be divided into two groups: preventive and operational activities. Since prevention is always better than cure, we can prevent the fire and its ruinous consequences by forecasting the areas that have a high risk of fire and performing preventive activities like access restriction and resource allocation. Due to the limited forest resources in Iran, it is very important to conserve these resources in our country.
So far, various models have been presented in the field of the fire in forest areas. In one of this researches, the risk map of fire occurrence was provided using geographic information system and remote sensing for part of the Spanish coasts (Chuvieco and Congalton, 1989). During last years, fire occurred only in 3.47%
of low-dangerous regions from the perspective of this article.In 2003, a new model was developed using artificial neural network to forecast the risk of fire occurrence in a region located at north-western Spain. This study divided regions into four regions based on fire occurrence probability (Amparo and Oscar, 2003). In a research, the fire risk map of Paveh region in Kermanshah was provided by weighting different layers like vegetation, height, and slope using Analytic Hierarchy Process (AHP) (Mohammadi et al., 2010). Another model was developed to forecast fire occurrence in Boreal forests of northern china using the fire information between 1965 and 2009. In another research, the relationship between the human and natural factors of fire occurrence was studied based on the occurrence pattern (Xiaowei et al., 2014). In this model, the risk of fire occurrence was evaluated using meta-heuristic method of artificial neural network and statistical method of logistic regression .According to the results of this study, the artificial neural network method is significantly more accurate than the statistical method and logistic regression. The accuracy of the statistical method is dependent upon the number of sampled points that the fire has been occurred (Jafari and Mohammadzadeh, 2016). In another study, a new model was developed to calculate the risk of fire occurrence in Espirito Santo region. This model was created statistically as well as for each effective parameter in the fire occurrence, a weight was considered based on the parameter effectiveness (Fernando Coelho et al., 2016).
Figure 1. The study area is Golestan province located in the northern part of Iran, the northern slopes of the Alborz mountain range and in south coastal plain of Mazandaran sea
features of spatial data, i.e. spatial non-stationary and spatial autocorrelation, it is an appropriate method to model this problem. In this regard, the effective biophysical and human parameters in fire occurrence have been used in the process of modeling.
2. MATERIAL AND METHODS
2.1. The study region
Since the largest number of forest fires during the year belong to Golestan Province, this province was chosen as the study region. Golestan forest is one of the most important forest regions of Iran that is located at eastern Golestan Province and west North-Khorasan Province. This forest is among the tourist regions of Iran and several roads pass through it, therefore human factors play a crucial role in fire occurrence in this region.
The study region of this research (Figure 1) is located in the range of 36° - 38° North and 53° - 56° East and its area is about 5 km .
2.2. Data
Different satellite and field data including the following ones was used to model the risk of fire occurrence:
Satellite data: includes the information of the fire occurrences, soil type, land use map and Digital Elevation Model (DEM) (Figure 2). Since 68% of fires have been occurred in June, July and August, the fires occurred in these three months were extracted and used in this article. 430 fire points between 2011 and 2016 were extracted from MODIS images. Ground cover map was prepared by NOAA images with resolution of km. The slope and aspect maps were created using the DEM of the region.
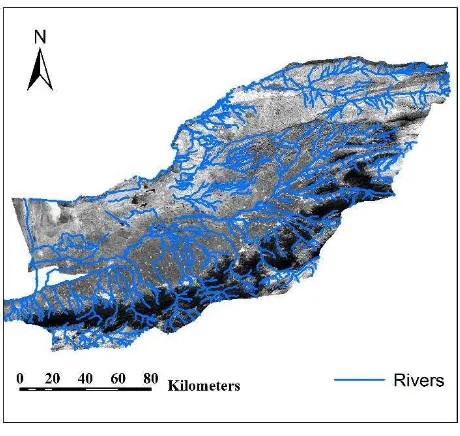
Field data: include the information of meteorology, rivers (Figure 3), roads and residential regions (Figure 4) of study region. The meteorological information namely temperature, wind, and monthly rainfall were extracted for all training and testing points through interpolating the information of the existing synoptic stations in the region. The information related to residential regions, rivers, and roads was received from organization of Golestan Province Natural Resources and the
layers of distance from residential regions, rivers, and roads were calculated using ArcGIS software.
Figure2. DEM of study area with spatial distribution of fire location
Figure3. Rivers data
Figure4. Residential region data
2.3. Geographically weighted regression
Spatial data has specific features that two of them are spatial autocorrelation and spatial non-stationary. The first is based on Tyler law and represents the inverse relationship of dependencies with distance and the second represents the variation of spatial autocorrelation in space and heterogeneous environment. The ordinary least squares (OLS) method cannot be adapted with these two features because in this method, it is assumed that the data are completely independent from each other and the environment is homogenous. Hence, OLS provides a set of answers without taking into consideration the spatial dependencies of all points of region. For this reason, GWR method was presented by Brunsdon in 1998. In this method, the temporal dependencies of observations are considered as weighted matrices and due to heterogeneous environment and the existence of spatial non-stationary, regression coefficients are calculated locally and separately for each point. The general relationship of GWR is as follows (Brunsdon, 1988):
� = � , + ∑= � , + � (1)
where � is a dependent variable, is the �ℎ independent variable, � is the number of independent variables, � is the remaining of model and � is the regression coefficients that are a function of the position of observational points , . The determination of geographical weights in GWR is very important. Hitherto, various kernels have been presented for this purpose. One of the kernels that has demonstrated high performance is Gaussian kernel that is represented in equation (2) (McMillen, 1988):
= � ��ℎ (2)
where is the geographical weight related to �ℎ observation in �ℎ point, � is the standard normal distribution function, � is the Euclidean distance of the points and , � is the standard deviation of � values for each point and ℎ is the parameter of bandwidth.
The important step in the determination of geographical weights is to choose appropriate bandwidth. Because if this parameter is too large, the results of GWR tend to OLS and if it is too small the variance of results increase significantly (Charlton et al., 2001)
There are different methods to determine optimal bandwidth. One of those is cross validation method that its function is as follows (Brunsdon, 1988):
∑ [� − �= ̌ ℎ ]� (3)
Where � is the number of observations, � is �ℎ observation and �̌� is the estimated value of �ℎ observation using other observations that itself is a function of bandwidth parameter and each bandwidth which minimizes this function is considered as optimal bandwidth.
The output of GWR includes several parameters that among them, the determination coefficient of is employed to measure the quality of model fitness (Charlton et al., 2001). This parameter is obtained using equation (4) (McMillen, 1988):
= − �
� (4)
�= ∑ [� − �= ̂]� (5)
= ∑ [� − �̅]= (6)
Where � is the number of observations, � is �ℎ observation, �̂� is the estimated value of �ℎ observation and �̅ is the average of observations.
In addition, the Root Mean Square Error (RMSE) and Normalized Root Mean Square Error (NRMSE) values of model’s residues which are obtained using following equations are used to measure the distribution of these residues.
� � = √ ∑= � − �̂ (7)
Where � is the number of data, � is the real value of dependent
variable and �̂ is the estimated value of dependent variable.
3. RESULT AND DISCUSSION
The programming environment of MATLAB has been used to implement and model the problem. To model the risk of fire occurrence, the points are divided into two groups namely training and testing points. The training points are a combination of fire points (400 points) and non-fire points (325 points) in the period of 2011-2015. In addition, the fire points of 2016 (30 points) were extracted to evaluate the model. The fire points have a value of 1 and the non-fire points have a value of zero.
The factors (Table 1) used in this article were divided into three classes namely human, climate, and field factors. The factors were selected which have more important and available.
improve the model performance. The modeling was conducted once by OLS and again by GWR with Gaussian kernel.
Field Factors Human
Factors
Climate Factors
1 Height (m) Distance from rivers (m)
Average temperature
2 Slope Distance from roads (m)
Maximum wind speed
(m/s)
3 Aspect
Distance from residential regions (m)
Rainfall (mm)
4 Soil Type
5 Land use
Table 1. Effective Factors
In the process of modeling by OLS method, first, the coefficients of used factors in the model were extracted. The parameters’ coefficients show the effectiveness of that parameter in the fire occurrence. After calculating the coefficients, the risk of fire occurrence in these points related to 2016 were calculated having the factors related to the testing points. Then, the risk value of all points were interpolated using inverse distance weighting (IDW) interpolation method that is a distance-based weighted method. Finally, the risk map was provided using the interpolated values (Figure 5). The real fire points of 2016 were also placed on the map for visual evaluation of this method. The calculated parameters of this model are listed in Table 2.
Figure5. Fire risk map provided by OLS method
Variable R2 RMSE
Value 0.6642 0.2903
Table 2. OLS parameters
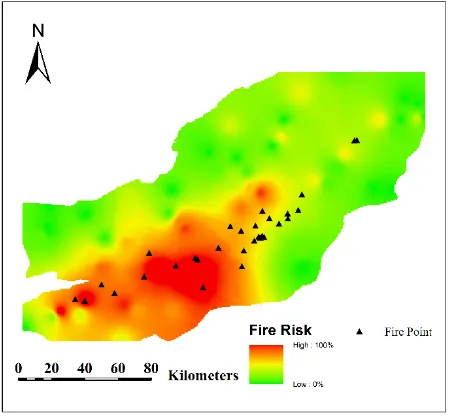
In GWR model, the general process is similar to that of OLS, however it is closer to the reality of problem by considering spatial non-stationary. In this model, we train the problem process to the model using Gaussian kernel and having the testing points. Then, we forecast the risk of fire occurrence for testing points by using coefficients and vicinities (Figure 6). The
real fire points of 2016 were also placed on the map for visual evaluation of this method.
Figure6. Fire risk map provided by GWR method
A set of parameters were calculated according to the features of model (Table 3). Bandwidth shows the used vicinities for forecasting in testing points. The value of shows the fitness of function into reality. In fact, the more the closer this value to 1, the more accurate the fitness implementation.
Variable Bandwidth R2 RMSE
Value 0.500 0.7941 0.2345
Table 3. GWR parameters
In GWR model, 28 points out of 30 fire points (in 2016) were in the range with fire-occurrence risk more than 70% (93.4% of all fire points) whereas in OLS model, only 20 points were in the range with fire-occurrence risk more than 70% (66% of all fire points). On the other hand, the resulted fitness of GWR method was more accurate than that of OLS method ( is closer to 1 in GWR method); in addition, the error of GWR was less (less RMSE in GWR method). The function of outputs shows that GWR function is approached to reality acceptably and the fires were in high-risk forecasted range mostly.
4. CONCLUSION
forecasting fire occurrence be done by using smart methods like neural network in future studies and its results be compared with regression-based methods to achieve the best forecast.
5. REFERNCES
A. Mahdavi, S. R. Fallah Shamsi, R. Nazari, 2011. Forests and rangelands’ wildfire risk zoning using GIS and AHP techniques. Caspian J. Env. Sci. 2012, Vol. 10 No.1 pp. 43~52.
Adab, H., Nokhandan, M., Miza Bayati, R. and Adabi Firouzjani, A., 2008. Mapping fire risk in forests ofMazandaran province using Molgan PrecautionaryIndex and GIS. Abstracts of 1st InternationalConference on Climate Change and Botany inCaspian Ecosystems, Iran,: 178-189.
Akbari, D., Amini, J. and Saadat Seresht, M., 2007. Presenting a rapid model for mapping forest fire. Abstracts of 2nd Disaster Management Conference, Iran, 12- 26 January 2007: 7p.
Almeida, R., 1994. Forest fire risk areas and definitionof the prevention priority planning action usingGIS. EGIS foundation, Available:
http://libraries.maine.edu/Spatial/gisweb/spatdb/egis/eg94193.h tml, Accessed 10 April 2013.
Amparo, A.B., Oscar, F.R. , 2003. An intelligent system for forest fire risk prediction and fire fighting management in Galicia, Expert Systems with Applications 25, pp. 545–554.
Chou, Y.H., Minnich, R.A., Chase, R.A., 1993. Mapping probability of fire occurrence in San Jacinto Mountains, California, USA. Environ. Manage Vol. 17, pp. 129-140.
Chuvieco, E. and Congalton, R.G., 1989. Applicationof remote sensing and geographic informationsystems to forest fire hazard mapping. RemoteSensing of Environment, Vol. 29, pp. 147– 159.
C. Brunsdon, S. Fotheringham and M. Charlton, 1998 ,“Geographically weighted regression – modelling spatial non-stationarity”, The Statistician, Vol.47, No.3, PP. 431-443,. D. P. McMillen and J. F. McDonald, 1998 ,“Locally weighted maximum likelihood estimation: Monte Carlo evidence and an application”, presented at the Regional Science Association International meetings, Santa Fe, NM,.
Díaz-Delgado, R., Lloret, F., Pons, X., 2004. Spatial patterns of fire occurrence in Catalonia, NE Spain. Landsc. Ecol. 19, pp. 731-745.
Fernando Coelho Eugenio , Alexandre Rosa dos Santos,2016. Applying GIS to develop a model for forest fire risk: A case study in Espírito Santo, Brazil. Journal of Environmental Management, Vol. 173 , pp. 65-71.
Jafari Goldarag, Y., Mohammadzadeh, A. , 2016. Fire Risk Assessment Using Neural Network and Logistic Regression. Indian Soc Remote Sens.
Liu, Z., Yang, J., Chang, Y., Weisberg, P.J., He, H.S., 2012. Spatial patterns and driversof fire occurrence and its future trend under climate change in a boreal forest ofNortheast China. Glob. Change Biol. 18, pp. 2041-2056.
M. Charlton and A. S. Fotheringham, “Geographically Weighted Regression”, White Paper. Kildare, Ireland: National Centre for Geocomputation, National University of Ireland, Maynooth, 11 , 2001.
Mohammadi, F., Shabanian, N., Pourhashemi, M. and Fatehi, P., 2010. Risk zone mapping of forest fire using GIS and AHP in a part of Paveh Forests.
Neeraj, S., & Hussin, Y.A., 1996. Spatial modeling for forest fire hazard prediction, management and control in Corbett national park, India, Remote sensing and computer technology for natural resources assessment (pp. 185– 192). University of Joensuu.
Renard, Q., Raphael, P., Ramesh, B.R., Kodandapani, N., 2012. Environmental susceptibility model for predicting forest fire occurrence in the Western Ghats of India. Int. J. Wildland Fire 21, pp. 368-379.
Salamati, H., Mostafa Lou, H., Mastoori, A., and Honardoust, F., 2011. Assessment and mapping forest fire risk using GIS in Golestan province forests Abstracts of 1st International Conference on Wildfire in Natural Resources Lands, Iran, 26-28 Oct. 2011, 10 p.
Xiaowei, L., Gang, Z., 2014. A comparison of forest fire indices for predicting fire risk in contrasting climates in China. Nat Hazards 70, pp. 1339–1356.