Numerical Modelling of Soil Moisture Profiles under Pitcher Irrigation Application
Edward Saleh
Sriwijaya University, Indonesia. Email:[email protected]
Budi I. Setiawan
Bogor Agricultural University, Indonesia. Email:[email protected]
ABSTRACT
Pitcher, a bottle-like irrigation emitter made of baked clayed soils mixed with sands has been recognized as the oldest traditional irrigation. It has high water efficiency since the water seeps directly into and concentrated in the root zones. We conducted numerical and experimental studies to investigate the water flow in the soil surrounding a pitcher and to figure out the availability of soil moisture for crops. The Darcy and Richards’ equations of water flow in a cylindrical coordinate system was applied and was solved using Finite Element Method to describe soil moisture profiles. Two soil textures were used, one was silty clay and the other was sand. The hydraulic conductivity of the pitcher was in order 10-6 cm/s which was 100 times smaller than that of the two soils. The pitcher was buried in the center axis of a soil box and water was given from Mariotte tube to maintain a constant water level inside the pitcher. The results showed the infiltration rates decreased linearly rather than exponentially even though the soil was initially dry. The advancement of wetting front was very slow and somewhat limited to a radius and depth of no more than 30 cm and 40 cm, respectively for both tested soils. The surrounding soil moisture was in a range available for plant growth. Different depths of pitcher placement in the soil produced different reaching distances of the wetting front but showed insignificant differences in water availability. Accurate placement of pitcher depth in soil is important to provide effective soil wetness in the root zone and reduce evaporation rate. The right placement of pitcher must be determined based on the hydraulic characteristics of the pitcher and the soil. In this study, 5 cm placement depth of the pitcher’s shoulder is an appropriate reference for the application of pitcher irrigation.
1. INTRODUCTION
Indonesia has approximately 13.4 million hectares of dry land (BPS, 2005) within the D and E types as categorized by Oldeman’s agro-climatic zone. In these regions the annual rainfall is less than 300 mm for three months in the rainy season (October to December), such as occurring in eastern part of Lombok Island. In this location there is about 120 ha of dry lands which has become arable, no thanks to the groundwater development project in the late 1990s. Since then many irrigation schemes have been developed to gain higher water use efficiency or reducing water loss due to high evaporation. One of them is pitcher irrigation to grow chilies and tomatoes (Setiawan
et al., 1998; Setiawan, 2000). This irrigation system could reduce evaporation and
percolation according to Mondal (1978).
Pitcher irrigation which uses bottle-like baked clayed soils mixed with sands, it has been known as the oldest traditional irrigation. Mondal (1974) classified pitcher irrigation into subsurface irrigation whereas, Stein (1990) classified it into local irrigation since water seeps slowly with low rate into the root zones resulting in partly wetted soil. Subsequently Stein (1994) submerged two types of pitcher into clay-sand soil to observe the seepage which has different saturated hydraulic conductivity of 3.9×10⁻⁷ cm/s and 3.6×10⁻⁴ cm/s. The seepage was about 1.25 l/day (0.014 cm3/s) at initial stage but declined gradually to values between 0.5 to 0.6 l/day.
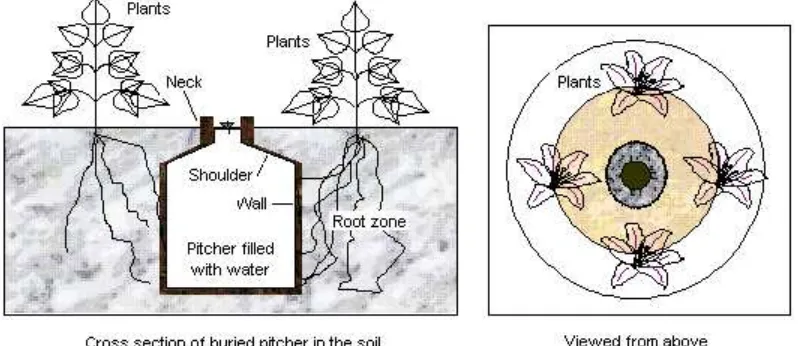
Figure 1 shows water-filled pitcher buried in soil and plants are surrounding it. Water seeps through the pitcher’s wall to the soil when the soil is drier but subsequently the water rate decreases with time and stops occasionally if there is no extraction by plant roots. This watering mechanism is known as self-regulating.
Figure 1. Scheme of pitcher irrigation and planting layout (Saleh,2000)
the soil moistures pattern followed the form of the pitcher but then the radial flow cease to some extend (16~19 cm) whilst downward flow is still moving even though in significantly slow rate (41~46 cm). The extension of soil moisture profiles affected by pitcher permeability was clearly seen when it was lower than the permeability of the soils. In contrast, when the permeability of the soil was lower than that of the pitcher, there was no sign of contrasting soil moisture profiles. From these studies then the authors suggest to use pitcher which has similar or lower permeability with the surrounding soils as a general guidance for irrigation practice.
In this study, we conducted numerical and experimental works to investigate performances of pitcher irrigation under two different soil textures and to find out water availability for crops in the surrounding soils.
2. MATERIALS AND METHODS
Pitcher and Soil Properties
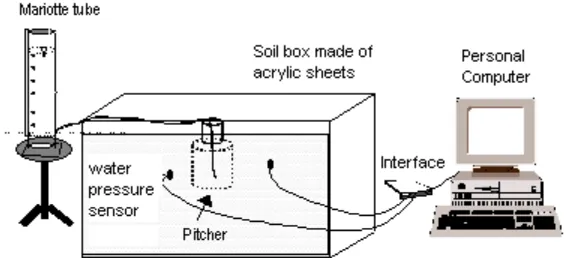
In general, the pitcher designed for this experiment is consisted of body, shoulder and neck. The body has diameter of 15 cm and height of 15 cm, whereas the neck has diameter of 5 cm and height of 10 cm. The wall thickness is 1 cm. The pitcher made from a mixture of clay and sand. The pitcher hydraulic conductivity was tested by a modified constant head permeameter and after repetitive measurements its value ranged between 4.56x10⁻⁶ to 8.78x10⁻⁶ cm/s. The pitcher was then buried in the center of soil box 30 cm having length of 100 cm and depth of 50 cm. Pressure transducers are inserted into the soil and connected to computer for real time measurements such as shown in Figure 2. Mariotte tube is used to supply water and maintained the water level inside the pitcher. Accumulative infiltration is manually measured from the Mariotte tube made of acrylic cylinder.
Two soil types were used. One was Sandy Soil and the other was Silty Clay. Water retention curves of the soils conformed to Genuchten (1980) model, modified by Setiawan (1992) to facilitate the presence of positive water head inside the pitcher. The model is written as follows:
m
maximum water head (cm), and α, n and m are best-fitted parameters.
Subsequently the hydraulic conductivity function of the soils was measured by the instantaneous profile method and the results was well represented by the following equation (Setiawan and Nakano, 1993):
b
ss a
K
K exp ...(2)
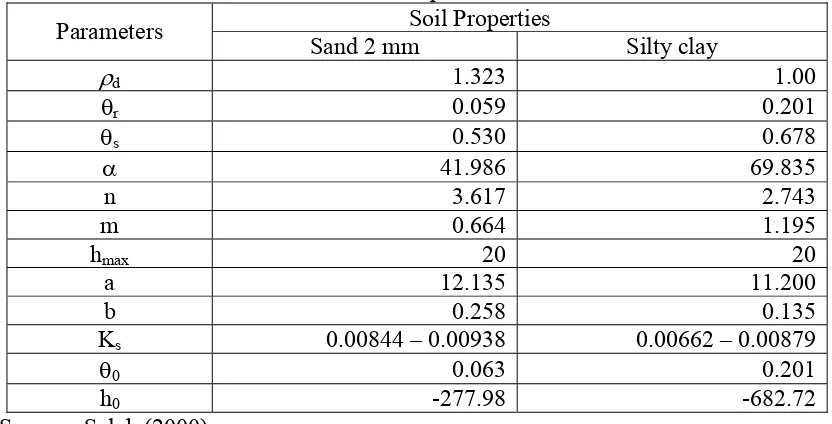
Table 1 shows parameters and constants such as stated in Equations above and the initial values of soil moisture content and water head.
Table 1. Parameters of soil properties and initial conditions of moisture content and water pressure head
Soil Properties
Ks 0.00844 – 0.00938 0.00662 – 0.00879
0 0.063 0.201
h0 -277.98 -682.72
Source : Saleh (2000)
The Water Flow Equations
coordinate system with the assumption that the soil is homogenous, isotropic and isothermal conditions can be stated as follows:
z t 0 unsaturated hydraulic conductivity (cm/s), Cw is specific water capacity (1/cm), r isradius (cm), z is depth (cm) and t is time (s).
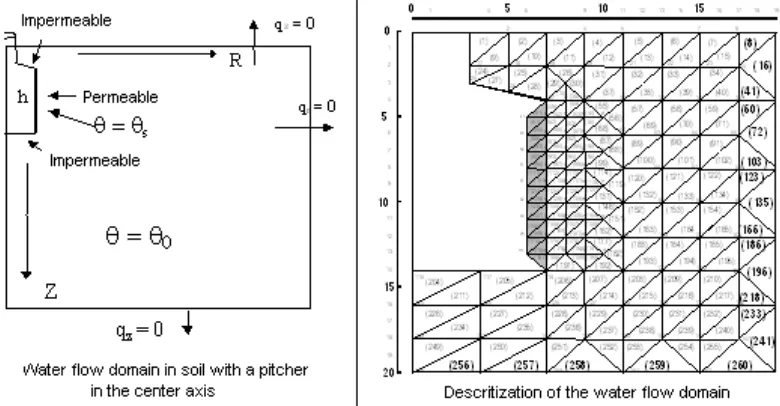
Figure 2 shows the scheme of flow domain when the pitcher is in the center of the vertical axis. The neck and the shoulder and the bottom of the pitcher are coated to make them impermeable but the wall was left permeable. Thus, water from inside the pitcher would penetrate to the soil through this wall. The soil surface was also covered with perforated plastic sheet to prevent evaporation. It is assumed that the radial and vertical wetting fronts would be restricted inside so that there would be no flow across the boundaries. The boundary conditions under such conditions can be formulated by the following equation (Bear and Verruijt, 1987).
C
h z K sin 0Initially, the soil moisture was approximately homogenous and hysteretic effects is negligible since the water flow would be very slow.
Numerical Solutions
The water flow equation subjected to the boundary and initial conditions can be solved by applying the Galerkin weighted residual of Finite Element Method, Equation 1 was transformed into non-linear system of equations:
A t P t1 F ...(5) [Kd] is the global matrix on [kd(e)] and can be written as follows:
k k
j j
i i )
e (
R c
R c
R c K 2
f ...(18)
According to Segerlind (1984), solution Equation 3 often result in oscillation and unstable computation. To prevent the oscillation and to obtain a stable computation, a precise setting of the time interval (t) to make all the Eigen values of [A]-1
[P] positive is important. In this respect, the value of t was then determined by giving minimum Eigen values so that the Equation 3 would produce minimal errors.
3. RESULTS AND DISCUSSION Infiltration Rates
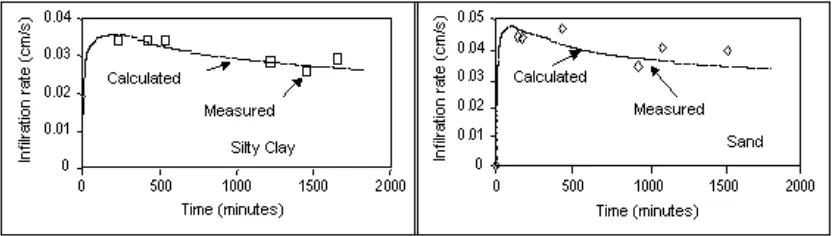
Figure 4 shows rates of water volume (infiltration rate) entering the two types of soils from the pitcher. Usually, infiltration rate decreases exponentially with time until it reaches a steady state. In this case, however, the decrease was rather gradual even though the soil was initially dry. Pattern of the curves was almost similar for both soils although the two soils have different soil properties and initial conditions. This indicates the effectiveness of the pitcher permeability which was lower than the permeability of the soil in controlling the infiltration rate. Earlier, Stein (1994, 1997) was referring it to auto regulative system to explain this infiltration phenomenon in pitcher irrigation. Figure 4 also shows calculated infiltration rates having good agreement with the measured data for Kpitcher=6.28x10⁻⁶ cm/s and Ksilt=7.70x10⁻⁴ cm/s,
and Kpitcher=7.0x10⁻⁶ cm/s and Ksand=8.95x10⁻⁴ cm/s, respectively.
Figure 4. Infiltration rates in silty clay and sandy soil. Line is calculated and dotted is measured values.
Figure 5. Comparison of calculated and measured cumulative seepage (infiltration) for silty clay (left) and sandy soil (right).
Soil Moisture Profiles
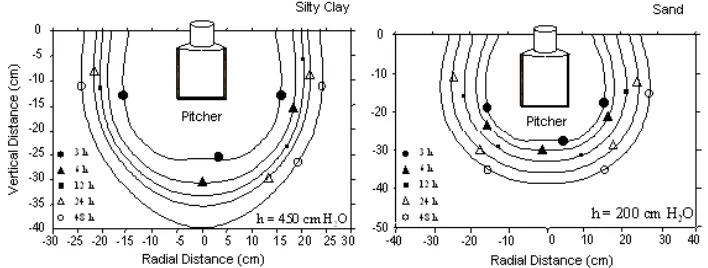
Figure 6 shows contour lines of water suction that equals to 450 and 200 cm of water for silty clay and sandy soil, respectively measured at several elapsed times. At these times, advances of wetting front for both soils were very limited and primarily to attain quasy steady states. Wetting front ceased from further advancement and it was confirmed later after slashing the soils that there was clear devision lines between wetted and remaining dry regions. The radial and vertical advancements of wetting front was up to 14 cm and 20 cm for the Silty Clay, and 20 cm and 30 cm for the sandy Soil, respectively.
Figure 6. Calculated water suction in the silty clay soil (left) and for sandy soil (right) at several elapsed times.
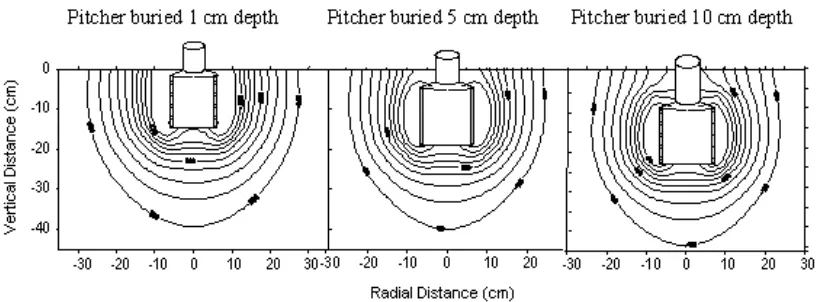
Figure 7 shows simulated soil moisture profiles in term of saturation degree, S=(-r)/(s- r), for three different depths (1, 5 and 10 cm) of pitcher’s shoulder buried in
is deeper. These differences, however, are not so significant and in general still provide available water for plant growth. The deeper pitcher placement produces drier soil surfaces and result in reduce evaporation rates because the soil mulches effect (lower unsaturated hydraulic conductivity). However, too deep placement of the pitcher which produces less moisture at the soil surface may produce undesirable effects to plant growth at the earlier stages due to their shorter rooting systems.
The advancement of wetting front in pitcher irrigation was obviously very slow and somewhat limited to form a balloon like moisture profile within a radius and depth of less than 30 cm and 40 cm, respectively for both tested soils. This depth has been recognized elsewhere as an effective zones for the extraction of soil moisture by pant roots (Igbadun, et.al., 2007). However, once there is a distortion of moisture profiles
for example due to root extraction, then water from the Mariotte tube flows immediately into the soil. This is another explanation of the self-regulating mechanism that guarantees the availability of water for plant growth at any time such as earlier reported by Setiawan (1998).
Figure 7. Contours of calculated saturation degree for the silty clay at three different depths of pitcher placement. Saturation degree at the outer line is 10%.
4. CONCLUSIONS
study it was found that 5 cm placement depth of pitcher is an appropriate reference for pitcher irrigation practices.
REFERENCES
Bear, J. and A. Verruijt. 1987. Modeling Groundwater Flow and Modeling. D. Reidel Publishing Company, Tokyo. 414 p.
BPS. 2005. Indonesia in Numbers. Central Statistical Bureau (in Indonesian).
Dent, J.B., and M.J. Blackie. 1979. System Simulation in Agriculture. Applied Science Publishers LTD, London, Page:140.
Igbadun, H.E., H.F. Mahoo, A.K.P.R. Tarimo and B. A. Salim. 2007. Simulation of Soil Moisture Dynamics of the Soil Profile of a Maize Crop under Deficit Irrigation Scheduling. Agricultural Engineering International: the CIGR Ejournal. Manuscript LW 06 015. Vol. IX. July, 2007.
Mondal, R.C. 1974. Farming with Pitcher: a technique of water conservation. World crops Vol. 26(2), 91-97.
Mondal, R.C. 1978. More Water for Arid Lands: promising technologies and research opportunities. National Academy of Sciences, Washington, D.C. Pages 153. Saleh, E. 2000. Pitcher Irrigation system performance at irrigation farm in dry land
area. Ph.D. diss., Bogor Agriculture University, Bogor. 121p.
Segerlind, L.J. 1984. Applied Finite Element Analysis. Second edition. John Wiley and Sons, Inc, New York. 427 p.
Setiawan, B.I. 1992. Studies on Infiltration in Soil Having a Macropore. Dissertation in Laboratory of Soil Physics and Hydrology, Division of Agricultural Engineering, Faculty of Agriculture, The University of Tokyo. Tokyo. 216 p. Setiawan, B.I. & M. Nakano. 1993. On the Determination of Unsaturated Hydraulic
Conductivity from Soil Moisture Profiles and from Water Retention Curves. Jur. Soil Science Vol. 156(6) 389-395.
Setiawan, B.I. 1996. Soil moisture distribution in pitcher irrigation. Proceeding of the International Agricultural Engineering Conference. Bhumata Charitable Trust. Pune, India, December 9-12. Pp.327-333.
Setiawan, B.I. 2000. On the Dissemination of Pitcher Irrigation System for Horticulture Farming in Dry Lands. Proceedings of China International Conference on Dry land and Water-Saving Farming. Beijing, November 21~23, 2000.
Stein, Th.-M. 1990. Development of Design Criteria for Pitcher Irrigation. Cranfield Institute of Technology, Silsoe College, M.Sc Tesis, August 1990.
Stein, Th.-M. 1994. Hydraulic Conductivity of Pitcher Material for Pitcher Irrigation (first result). Zeitschrft fur bewasserungswirtschaft 30(1), 72-93.
Stein, Th.-M. 1997. The Influence of Evaporation, Hydraulic Conductivity, Wall Thickness and Surface Area on the Seepage Rates of Pitcher Irrigation. Applied Irrigation Science (Zeitschrft fur bewasserungswirtschaft) 32(1), 65-83.