DEMOCRATIC REPUBLIC OF TIMOR-LESTE
MINISTRY OF FINANCE
Timor-Leste Petroleum Fund
ANNUAL REPORT
2016
Contents
Message from Minister of Finance ... 1
The Petroleum Fund at a Glance ... 2
Petroleum Fund Balance and Flows ... 5
Petroleum Revenues ... 5
Advice from the IAB and the Petroleum Fund going forward ... 13
Implications of a declining Fund balance for the investment strategy ... 13
Introduction of equity factors ... 14
The currency numeraire and currency exposure... 14
Work going forward ... 15
Annex I Statement by Director General of Treasury ... 17
Annex II Audited Financial Statements ... 21
Annex III Statement of Accounting Policies of the Petroleum Fund for the Fiscal Year 2016 ... 73
Annex IV Comparison of Income Derived from the Investment of the Petroleum Fund Assets with the Previous Three Fiscal year ... 75
Annex V Comparison of Nominal Income on the Investment of the Petroleum Fund Assets to the Real Returns ... 77
Annex VI Comparison of Nominal Income on the Investment of the Petroleum Fund Assets with the Benchmark Performance Index ... 79
Annex VII Comparison of the Estimated Sustainable Income with the Sum of Transfers from the Petroleum Fund ... 81
Annex VIII Statement of Borrowing ... 83
Annex IX A list of Persons Holding Position Relevant for the Operations andPerformance of the Petroleum Fund ... 85
Annex X Statement on Total Withdrawals versus the Approved Appropriation Amount ... 89
Annex XI Article 35 Report on the Petroleum Fund Receipts from Deloitte Touche Tohmatsu ... 91
Annex XII Advice Provided by the Investment Advisory Board ... 95
Annex XIII Implementation of the Santiago Principles ... 111
Note: Special acknowledgment is due to Sebastião Guterres “Seba” for authorising use of his photograph for the
2
The Petroleum Fund at a Glance
End of Year Balance
2016
$15,844m
Petroleum
Revenues 2016
$224m
Net Investment
Income 2016
4.1% ($648m)
Investment Income Since
2005
3.8% per annum ($3.24bn)
3
the constitutional requirement set by Article
139 of the Constitution of the Republic that
mandates a fair and equitable use of the natural
resources in accordance with national interests,
and that the income derived from the
exploitation of these resources should lead to
the establishment of a mandatory financial
reserve.
The Government therefore created the
Petroleum Fund in 2005, under the provision of
the Petroleum Fund Law No.9/2005 (3 August
2005) as amended by the Law No.12/2011 (28
September 2011).
Purpose
The preamble of the Petroleum Fund Law
clearly states that the purpose of establishing
the Petroleum Fund is to contribute to the wise
management of Timor-
Leste’s petroleum
resources for the benefit of both current and
future generations. The Fund is also a tool that
contributes to sound fiscal policy, where
appropriate consideration and weight is given
to the long-term interest of Timor-
Leste’s
citizens.
Key Features
The
Petroleum
Fund
Law
provides
mechanisms that assist Timor-Leste to
sustainably manage its petroleum revenues,
details parameters for operating and managing
the Petroleum Fund, defines asset allocation
guidelines and risk limits, governs collection
and management of the receipts, regulates
transfers to the State Budget, defines clear roles
and responsibilities of entities involved in the
management of the Fund and provides for
government accountability and oversight of
these activities.
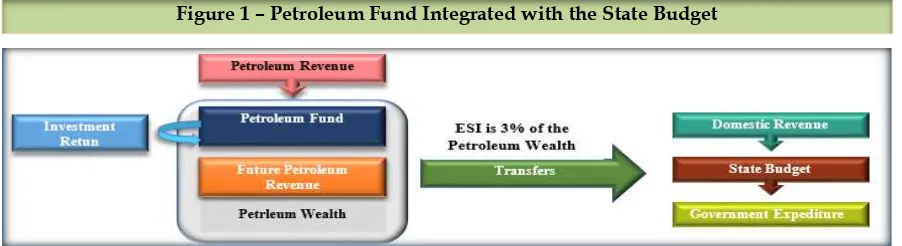
The Petroleum Fund is formed as an account of
the Ministry of Finance held in the Central Bank
of Timor-Leste (BCTL). The Fund separates the
inflow
of
petroleum
revenues
from
government spending. All petroleum income
initially enters the Fund before any transfers
are made to the State Budget. The amount of the
transfers is guided by the Estimated
Sustainable Income (ESI), set at 3% of total
Petroleum
Wealth.
Petroleum
Wealth
comprises the balance of the Petroleum Fund
and the Net Present Value of expected future
petroleum revenue. The rationale behind using
the ESI is to smooth the spending of
temporarily high petroleum income and shield
against the volatility of petroleum inflows and
safeguard the sustainable use of public
finances.
The Fund is invested only in international
financial assets. The investment objective is to
achieve a 3% real return over the long-run to
contribute to the sustainability of the fiscal
policy. The Government recognizes that
pursuing this investment return objective
involves accepting risk in terms of short-term
investment return volatility. It requires the
Fund to have a long-term horizon to ride
through short-term fluctuations in order to
achieve an average long-term higher expected
return. The investment strategy and strategic
asset allocation are described in more detail in
the section, “The Fund’s Investments”.
4
Governance
The Petroleum Fund model is internationally
recognised for its high standard of governance,
accountability, transparency and disclosure of
information. This helps build public support
for the wise management of petroleum
revenues
and
reduces
the
risk
of
mismanagement. As shown in Figure 2 below,
the
relevant
entities
involved
in
the
management of the Petroleum Fund operate
independently but are accountable to one
another in the decision making process.
The Parliament sets the objective of the Fund,
the broad asset allocation guidelines and the
risk limits. The Government, through the
Ministry of Finance, is responsible for the
overall management of the Petroleum Fund
including setting the investment policy and
strategy, investment guidelines and exercising
of oversight.
The Minister of Finance is required to seek
advice from the Investment Advisory Board
(IAB) before making decisions on any matter
relating to the investment strategy or
management of the Fund. The operational
management of the Fund is delegated to and
carried out by the Banco Central de
Timor-Leste (BCTL), which invests, and may delegate
to external managers to invest, the Fund’s
capital according to guidelines established by
the Ministry of Finance.
The Petroleum Fund Law also sets out the
requirements for all entities involved in the
management of the Fund to provide and
publish reports on the activities of the Fund.
The Ministry of Finance prepares the Petroleum
Fund Annual Report, financial statements and
general state budget statement for the National
Parliament. The BCTL provides quarterly
reports to the Minister on the Fund’s
performance. In addition, an international
accredited external auditor is required to issue
and publish an annual audit report on the
Fund’s financial statements
.
These reports are shared with key stakeholders
and are publicly available on both Ministry of
Finance (www.mof.gov.tl) and Central Bank
(www.bancocentral.tl)
websites.
The
Petroleum Fund, as an active member of the
International Forum for Sovereign Wealth
Funds (IFSWF), conducted its seventh annual
self-
assessment of the Petroleum Fund’s
adherence with the Santiago Principles to
ensure that the Fund continues to exemplify
international best practice with regard to funds
governance. The self-assessment report is
attached as Annex XIII to this report. These
efforts have been reflected in international
recognition of the high level of transparency of
the Fund and the good management of the
resources.
5
Petroleum Fund Balance and Flows
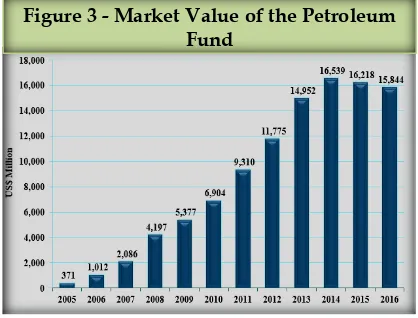
The Fund’s balance decreased to $1
5,844
million as at the end of December 2016 from
the previous year’s balance of $16,
218 million
(see Figure 3). The $373 million fall in the
balance was the second annual decline since
the Fund’s inception. The overall balance of the
Fund is affected by petroleum revenues, the
investment return and withdrawals. As Figure
4 illustrates, petroleum revenues and
investment returns contributed $224 million
and $648 million respectively to the Fund over
the year. The total withdrawal of $1,245
million from the Fund to finance the
Government
’s budget resulted in the decline in
the Fund’s balance.
Petroleum Revenues
Petroleum revenues now come from one field,
Bayu Undan, which started production in
2004. Kitan, the other much smaller field,
started production in 2011 but was suspended
in December 2015 due to the fall in oil prices.
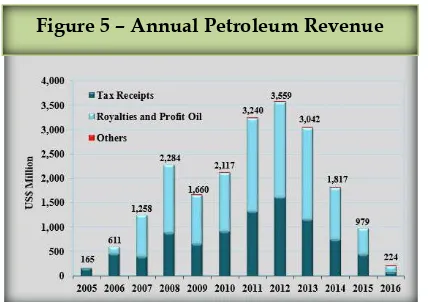
The total petroleum revenue collected during
2016 was $224 million. That was comprised of
$90 million in petroleum taxes, $127 million in
royalties and oil and gas profit and $6 million
in other petroleum revenues (see Figure 5). The
collections are net of a tax settlement
1. These
collections were in accordance with Articles 6.1
(a), (b), and (e) of the Petroleum Fund Law
respectively.
1 http://timor-leste.gov.tl/?p=14540&lang=en
Figure 3 - Market Value of the Petroleum
Fund
6
Petroleum revenue has declined significantly
since its peak of close to $3.6 billion in 2012. The
falls in revenue reflects both declining
production and lower oil prices (Figure 6).
Total petroleum production from Bayu-Undan
peaked in 2011 and will continue to decline
before ceasing in 2021. The global oil price has
also been much lower over the last two and a
half year.
Figure 5 shows that the petroleum revenue
received in 2016 was about one fifth of the
revenue received in 2015. Oil and gas
production slightly decreased from 52 million
barrels of oil in 2015 to 49 million barrels of oil
in 2016
2. The average price received in 2016 was
higher than the price received in 2015.
Source: EIA and ANPM
The bulk of production was sold at higher oil
prices in previous years. Since the inception of
the Fund in 2005, the Government has collected
total petroleum revenues of $21.0 billion. Most
of the
country’s Petroleum W
ealth is already
transformed into financial assets. Going
forward, investment income
and withdrawals
will be the main drivers of the Petroleum Fund
balance until new projects come online.
2
http://www.anp-tl.org/webs/anptlweb.nsf/pgLafaekDataGasListHTML
Withdrawals
The Government withdrew $1,244.8 million
from the Fund during 2016 to finance the
General State Budget. This was $700 million
more than the ESI of $545 million for the year
(see Figure 7).
The ESI is set at 3% of the
Petroleum Wealth which consists of the
Petroleum Fund balance and the forecasted net
present value of the future petroleum revenues.
The Government has withdrawn $8,554 million
from the Fund since its inception until the end
of 2016. This exceeds the cumulative ESI over
that period by $3,003 million.
The excess
reflects the Government’s policy to front
-load
expenditure to enable economic development.
The implications for the Petroleum Fun
d’s
investment strategy have been carefully
considered and are summarised in the section
regarding the advice from the Investment
Advisory Board.
Investment Income
The Petroleum Fund posted a gain of $647.7
million in 2016 after deducting expenses. This
follows the previous year’s small loss of $21.4
million and income of $502 million in 2014.
Details on the Fund’s performance are
provided in the section below. Since the Fund’s
inception, investment income has been $3,237
million.
Figure 5
–
Annual Petroleum Revenue
7
Management Expenses
The Operational Management Agreement
signed between the Ministry of Finance and the
BCTL provides for the BCTL to recover the
expenses it incurs as the Petroleum Fund’s
operational manager
3. Figure 9
shows that
management expenses incurred in 2016 totalled
US$ 14.9 million. This included custody and
external manager fees of US$ 8.3 million; the
BCTL’s operating expenses of US$ 4.9 million;
and Investment Advisory Board (IAB)
expenses of US$ 203 thousand. Relative to the
size of the Fund, the fees for 2016 were 0.08 per
cent, which was lower than the previous year’s
0.10 per cent.
Figure 9
–
Management Expenses in 2016
Category
$US
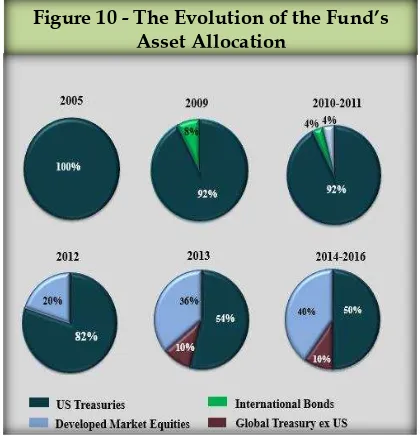
The Fund’s strategic asset allocation (SAA) is 40
per cent equities and 60 per cent bonds. This is
shown in Figure 10,
along with how the asset
allocation has evolved over time.
The original Petroleum Fund Law required 90
per cent of investments to be in US dollar bonds
and the Fund was fully invested in bonds for its
first 5 years. The objective was to limit risk
during the early stages in order to help build
public confidence in the Fund and allow time
to develop internal investment capabilities.
Given the low risk of such a defensive
allocation, the
portfolio’s
expected return was
low. However, the high bond allocation proved
to be a windfall during the Financial Crisis in
2007 and 2008, when a flight to safe
investments caused US government bonds to
perform strongly.
Fund’s purchasing power by offsetting
inflation
and
the
government’s
ESI
withdrawals. In order to meet the objective, it
was agreed that the equity allocation needed to
increase
because
equities
systematically
generate
higher
returns
than
bonds.
Consequently, the Petroleum Fund Law was
Figure 10 - The E
volution of the Fund’s
Asset Allocation
8
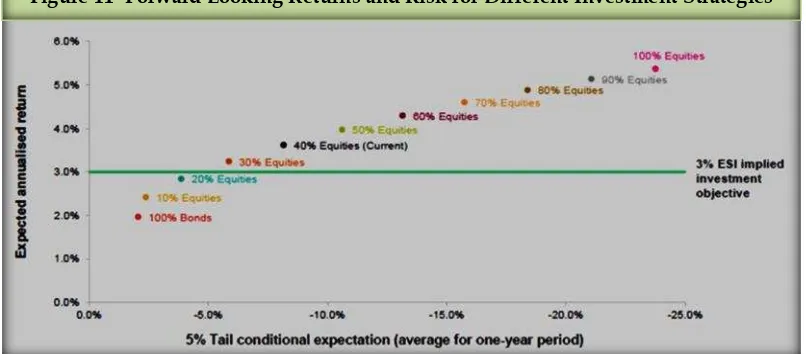
changed in 2011 to allow up to half of the Fund
to be invested in equities. An SAA of 40 per cent
equities was chosen based on projections that
the allocation could attain a 3 per cent real
return with a reasonable probability and an
acceptable level of risk. As Figure 11 shows,
lower equity allocations fail to meet the return
objective, while higher equity allocations result
in additional risk.
Investment risk can be measured in different
ways, as the 2015 Petroleum Fund Annual
Report explained. A common measure is the
standard deviation of returns, which measures
the variability in annual returns. That is 7.6 per
cent for our portfolio compared to the expected
nominal return of 5.6 per cent (the nominal
return includes inflation). This means that we
must expect considerable variability each year
around the central return expectation. In other
words, it is a mistake to think that the Fund will
meet its return objective every year. Measures
of downside risk are also useful. Modelling
predicts that we should expect a loss in one out
of five years. Therefore, an annual loss should
not be a surprise and it can potentially be large.
In the worst five years out of 100, the expected
loss is 5.5 per cent or more. Risk is necessary if
the objective is to meet the 3 per cent real return
objective. The volatility in performance and the
potential for losses can be reduced but this will
necessitate a lower expected return, which fails
to meet the current investment objective.
The Petroleum Fund’s SAA, in particular th
e
split between equities and bonds, is the key
driver of the Fund’s performance. The Fund’s
investment beliefs shape how the investments
are implemented. These are documented in the
Investment Advisory Board’s “Statement of
Investment Beliefs and Principle
s”, which are
published on the Ministry of Finance’s website
(www.mof.gov.tl).
Two principal beliefs are that markets are
generally efficient and that the bulk of
investment returns come from rewarded
systematic risk factors. Following these beliefs,
and also considering capacity development,
passive management is adopted as the main
investment style for the Petroleum Fund.
Passive managers are also known as index
managers in that their investment objective is
to closely match the performance of the
benchmark index. This involves holding the
securities in the index so that their invested
weights correspond to those in the benchmark.
Active managers, in contrast, seek to
outperform the benchmark by deviating from
the ind
ex’s holdings.
A related investment belief is that forecasting
short-term market movements is difficult.
Investors that can remain invested in risky
assets over the long-term, including the periods
of adverse performance, are able to collect the
systematic risk premia, such as the equity risk
premium. Ill-timed attempts to jump in and out
of markets will fail to realise those premia. For
this reason, the Petroleum Fund’s allocations
are maintained close to those in the SAA, with
rebalancing undertaken by the BCTL, the
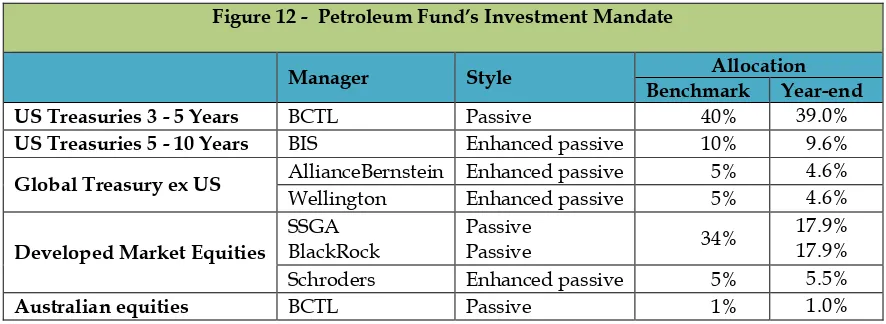
operational manager. Figure 12 shows that the
Fund’s actual holdings at the end of December
2016
closely correspond with the SAA weights.
The 2.3 per cent overweight to equities and the
corresponding underweight to bonds are
within the mandated parameters.
Source: Willis Towers Watson
9
Figure 12 -
Petroleum Fund’s Investment Mandate
Manager
Style
Allocation
Benchmark
Year-end
US Treasuries 3 - 5 Years
BCTL
Passive
40%
39.0%
US Treasuries 5 - 10 Years
BIS
Enhanced passive
10%
9.6%
Global Treasury ex US
AllianceBernstein Enhanced passive
5%
4.6%
Wellington
Enhanced passive
5%
4.6%
Developed Market Equities
Schroders
Enhanced passive
5%
5.5%
Australian equities
BCTL
Passive
1%
1.0%
The Petroleum Fund invests in equity and
bonds issued in a number of developed
countries. Passive managers account for the
bulk of the equity portfolio, so its composition
closely follows the benchmark index, the MSCI
World Index. The holdings are diversified
across industries and 1,894 companies were
held at the end of the year. The individual
holdings at the end of the year are detailed in
the annual financial statements.
Figure 13
shows that over 60 per cent of equities are in
companies listed in the US. The Eurozone,
Japan and UK in combination account for about
another quarter of the equity holdings. The
BCTL began internally managing a passive
allocation to Australian equities in July 2016,
which
had
previously
been
managed
externally. The 2.6 per cent weight of
Australian equities in the Petroleum Fund’s
equity allocation corresponds with Australia’s
weight in the MSCI World Index.
The composition of countries in the bond
portfolio follows from the allocations to the
mandates in Figure 12. Almost 85 per cent of
the bond portfolio is in US government bonds.
The BCTL’s internal mandate of US Treasury 3
to 5 year bonds constitutes about two thirds of
the bond portfolio and the BIS’s mandate of US
Treasury 5 to 10 year bonds represents about
another one sixth of the portfolio. The
remaining allocation is to non-US sovereign
bonds and is managed by AllianceBernstein
and Wellington Management. A customised
benchmark was developed to provide a broad
exposure by capping country weights at 10 per
cent and the Eurozone at 30 per cent. The
enhanced passive mandates provide the two
managers with moderate discretion to depart
from the benchmark’s holdings. The allocations
shown in Figure 13 are in line with those in the
benchmark, with the Eurozone accounting for
4.4 per cent of the total bond portfolio and
Australia, Canada, Japan and the UK each
comprising about 1.5 per cent of the portfolio.
10
Figure 13
–
Allocation by Country
Country
% of Equities
% of Bonds
% of Portfolio
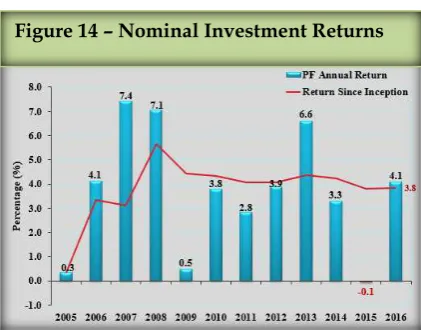
The investment return before expenses was 4.1
per cent (see Figure 14). T
he Fund’s return sinc
e
inception finished 2016 at 3.8 per cent or 2.0 per
cent in real terms after accounting for US
Both equities and bonds recorded positive
returns in 2016 but the equity
portfolio’s
8.1 per
cent return drove the Fund’s performance.
Stock markets fell sharply early in the year
based on uncertainty regarding China and a
weakening outlook for global growth. Markets
stabilized as the economic concerns receded,
aided by accommodative monetary policy.
Stocks were quick to recover from the surprise
result in the UK referendum on EU membership
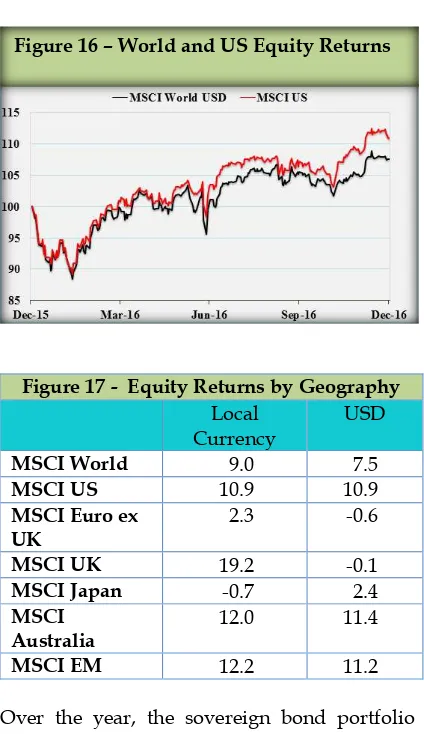
in June. Equities posted strong returns in the
second half of the year as market sentiment and
the economic outlook improved. US equities
performed strongly (Figure 16), while other
developed markets were mixed, with currency
playing a role (Figure 17).
Figure 15
–
Equity and Bond Returns
11
Figure 17 - Equity Returns by Geography
Local
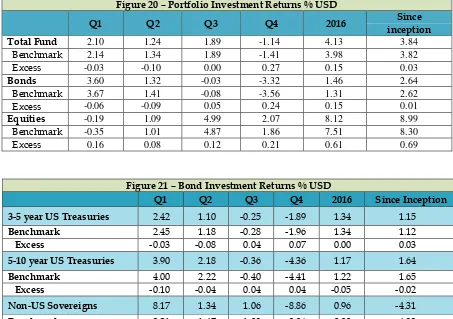
returned 1.5 per cent and acted as a diversifier
for equities. The bond portfolio generated
positive returns in the first half and negative
returns in the second half of 2016 (Figure 20 and
21).
After declining in the first two quarters, the
yields on the US Treasury mandates drifted
higher as the outlook and risk sentiment
improved (Figure 18). Yields rose sharply in the
final quarter. Markets expected a more
expansionary fiscal policy following the US
Presidential election and began to project
higher growth and inflation. The Federal
Reserve also raised its policy rate in December
to 0.75 per cent and signaled further tightening
in future. The US Treasury 3 to 5 year mandate
returned 1.3 per cent and the 5 to 10 year
mandate returned 1.2 per cent, each in line with
their benchmark’s
performance (Figure 21).
The non-US sovereign bond allocation returned
about 1 per cent in 2016 (Figure 21). Non-US
bonds are unhedged and currency movements
contributed
to
variations
in
quarterly
performance. The portfolio posted strong gains
in the first quarter when yields fell and the USD
appreciated. The yield on the non-US bond
portfolio rose towards the end of the year along
with global growth and inflation expectations.
The losses in quarter four reflected both a rise
in yields and a stronger USD dollar.
The appreciation of the US dollar over the
course of the year resulted in a $116 million fall
in the value of foreign currency denominated
investments (Figure 19). This was shared
between the foreign exchange exposures in the
non-US portion of the equity portfolio and the
non-US sovereign bond portfolio.
Figure 16
–
World and US Equity Returns
Figure 18
–
US Treasuries and Non-US
Government Benchmark Yields
12
Figure 20
–
Portfolio Investment Returns % USD
Q1
Q2
Q3
Q4
2016
Since
inception
Total Fund
2.10
1.24
1.89
-1.14
4.13
3.84
Benchmark
2.14
1.34
1.89
-1.41
3.98
3.82
Excess
-0.03
-0.10
0.00
0.27
0.15
0.03
Bonds
3.60
1.32
-0.03
-3.32
1.46
2.64
Benchmark
3.67
1.41
-0.08
-3.56
1.31
2.62
Excess
-0.06
-0.09
0.05
0.24
0.15
0.01
Equities
-0.19
1.09
4.99
2.07
8.12
8.99
Benchmark
-0.35
1.01
4.87
1.86
7.51
8.30
Excess
0.16
0.08
0.12
0.21
0.61
0.69
Figure 21
–
Bond Investment Returns % USD
Q1
Q2
Q3
Q4
2016
Since Inception
3-5 year US Treasuries
2.42
1.10
-0.25
-1.89
1.34
1.15
Benchmark
2.45
1.18
-0.28
-1.96
1.34
1.12
Excess
-0.03
-0.08
0.04
0.07
0.00
0.03
5-10 year US Treasuries
3.90
2.18
-0.36
-4.36
1.17
1.64
Benchmark
4.00
2.22
-0.40
-4.41
1.22
1.65
Excess
-0.10
-0.04
0.04
0.04
-0.05
-0.02
Non-US Sovereigns
8.17
1.34
1.06
-8.86
0.96
-4.31
Benchmark
8.21
1.47
1.03
-8.96
0.99
-4.33
13
Advice from the IAB and the
Petroleum Fund going forward
The Investment Advisory Board (IAB) of the
Petroleum Fund held 8 meetings and 2
workshops during 2016. The minutes of the
meetings are available on the BCTL’s website
(www.bancocentral.tl). The IAB provided 6
recommendations to the Minister of Finance
(see Annex XII) in accordance with Article 16
in the Petroleum Fund Law.
The Board addressed three main investment
issues over the course of the year. These are
outlined below and further details of the
IAB’s
advice are provided in Annex XII.
1.
Implications of a declining Fund
balance for the investment strategy
The IAB’s primary focus in 2016 was reviewing
the Fund’s investment strategy in light of a
declining Fund balance. The State Budget
Book’s projections
clearly show that the
balance in the Petroleum Fund will decline
over the coming years because outflows from
government withdrawals will exceed the
inflows from oil and gas revenues and
investment returns. Withdrawals continue to
be in excess of the ESI as the government
prioritises economic development. The future
inflows from oil and gas revenues are modest,
declining with production and lower oil prices.
Investment returns will vary from year to year
and the prospective return from bonds is
compressed by low yields.
In May the Board recommended an interim
step of introducing a cash portfolio to reduce
the market risk associated with financing
expected withdrawals. While the Fund’s
investments in equities and bonds are highly
liquid, they are subject to short-term
fluctuations in value. Cash involves no price
risk and represents a more suitable investment
for a short holding period. The opportunity
cost is that cash will earn a low return. The
IAB’s
advice was to sell equities and bonds to
match the projected $800m of net withdrawals
from the Fund for the remainder of 2016. The
Minister of Finance adopted the IAB’s
recommendation
and
the
sale
was
implemented by the BCTL in June.
The IAB undertook further analysis and
provided its SAA advice on 23 September
2016. The Board recognised that the Fund’s
balance will continue to decline over the
Budget Book period and, if those projections
are extended, then the Fund will be exhausted
sometime within the next 15 to 30 years. When
determining the balance between saving and
spending to foster development, the Board
believed that it is important for policy makers
to understand that the Fund is not sustainable
beyond this horizon unless there is a change in
fiscal policy or there are new inflows from oil
and gas reserves.
These projections required a reassessment of
the Petroleum Fund’s investment strategy.
The
Fund is often presented as a perpetual fund,
based on the framework that withdrawals do
not exceed the sustainable amount estimated
by the ESI. With a perpetual investment
horizon - or at the least a very long term
horizon - the Petroleum Fund can weather the
volatility inherent in equities. The Board
considered whether the change in the
projected life of the Fund made it necessary to
change
the portfolio’s
overall level of risk.
The Board advised the Minister that there were
not sufficient grounds for changing the long
projections of both government spending
and future revenue so there is value in
waiting for new information and adapting
the investment strategy accordingly.
The low interest rate environment is likely
to increase the opportunity cost of
allocating out of equities into interest
bearing investments such as cash or bonds.
At the same time, there is merit in reducing the
risk with financing the net outflows expected
in the near-term. The Board recommended
introducing a cash portfolio to match 12
months of expected net withdrawals. The
14
and recommending parameters to implement
a new cash mandate, including a rule for the
size of the allocation and determining its
benchmark. The Minister will then be advised
by the IAB. It is expected that the mandate will
be implemented in 2017.
2.
Introduction of equity factors
The IAB recommended diversifying the equity
portfolio by including equity factors in its
advice to the Minister on 27 January 2016. As
noted in the Investments section earlier, the
bulk of the equity portfolio is currently
passively managed to the global equity
benchmark, which provides exposure to the
equity risk premium. The IAB believes that
other factors are systematically rewarded,
including Value, Size, Momentum, Quality
and Low risk. This is supported by the
empirical finance literature.
Implementation of a long-only factor portfolio
involves creating a portfolio that has a higher
than average exposure to the targeted factor.
For example, to gain exposure to the Value
factor an investor will select listed companies
that are “cheap” according to valuation ratios,
such as the Book to Market ratio (the
company’s accounting book value relative to
its market capitalisation). The characteristics of
the other factors are summarised in Figure 22
below.
Figure 22 - Equity Factors
Factor
Company characteristics
Value
Cheap according to valuation
ratios e.g. Book to Market
Size
Smaller market capitalisation
Momentum
Recent strong performance
Quality
Higher profitability
Low risk
Low volatility or low beta
The Board recommended a multiple factor
portfolio to achieve exposure to the equity
factors listed above. The IAB explained that the
performance of the equity factor mandates will
diverge from the current market-capitalisation
weighted benchmark, the MSCI World. While
over the long-run the factors are expected to
offer risk-adjusted returns that are higher than
the MSCI World, their performance is subject
to cycles that can include extended periods of
adverse relative returns. To capture the
systematic return it is essential to take a
long-term view and maintain the exposure during
periods of underperformance.
The Minister of Finance
followed the IAB’s
advice and in her letter on 15 March 2016
advised the BCTL to commence a manager
search. The BCTL undertook further analysis
and in September proposed adding more
specific parameters. This was endorsed by the
IAB in its advice to the Minister on 14 October
2016 and adopted by the Minister in her
instructions to the BCTL on 28 October 2016.
This included specifying the MSCI World as
the benchmark rather than trying to
incorporate equity factors into the factor
managers’ benchmarks and a composite
benchmark for the total equity portfolio.
Consequently returns from the factor
strategies must be expected to deviate from the
benchmark index and, therefore, differ from
the performance of the Fund’s passive equity
managers.
The BCTL began due diligence on a short-list
of managers and it is expected that equity
factors will be implemented in 2017.
3.
The currency numeraire and currency
exposure
The currency numeraire in economic terms is
the unit of measure that represents the
purchasing power of the Fund. In other
words, it represents the currency mix of the
expenditure that withdrawals from the Fund
are used to finance. The true currency
numeraire can differ from the reporting
currency. The US dollar has been the reporting
unit since the Fund’s inception. The US dollar
represents a transparent measure given it is
Timor-
Leste’s local currency
and is also a
reserve currency.
The currency numeraire and hedging policy
15
relative to the US Dollar reporting unit of the
Fund.
There are limitations with the data on the
currency composition of national expenditure.
The estimates in the 2016 review indicate that
by far the bulk of the nation’s spending is
effectively in US dollars. It is clear that almost
all government expenditure is in US dollars. In
view of this, the IAB believes that the
purchasing power of the Fund is now best
represented by the US dollar. Analysis for a US
dollar investor shows that currency exposures
are unlikely to act as a diversifier and usually
add to volatility. Unhedged currency is also
unlikely to provide a return over the long-term
that exceeds a hedged position.
The analysis supported introducing currency
hedging of non-US bonds. The IAB has
requested the BCTL to determine how to best
implement hedging. Once the operational
considerations are addressed, the IAB will
formally advise the Minister of Finance.
Work going forward
The cash mandate, equity factors and currency
hedging are expected to be implemented
during 2017. In addition, the IAB’s Secre
tariat
will undertake an internal review of the
Petroleum Fund’s investment objectives
and
strategic asset allocation (SAA) and brief the
Board in the fourth quarter. As part of the
review, the Secretariat will work on devising
capital market assumptions that account for
current conditions. The IAB in its advice to the
Minister on the SAA has noted that the low
interest rate environment detracts from the
expected return from bonds. Bond yields are
low in the US and negative in a number of
developed markets. The returns expected from
bonds over the next 10 years are much lower
than the normative assumptions used to
determine the returns of the portfolios shown
earlier (Figure 11). This presents a challenge in
meeting the 3 per cent real return objective.
The IAB and Ministry of Finance will brief
stakeholders following the SAA review.
The SAA review will also assess potential new
asset classes that may lead to incremental
improvements in the portfolio. Over the past
couple of years, the IAB and its Secretariat
have reviewed investment grade corporate
17
Annex I
18
Petroleum Fund of Timor-Leste General Information
31 December 2016
Minister of Finance Her Excellency Santina Cardoso
Director General of Treasury Rui Ferreira Magno (from 1 July 2016) Agostinho Castro (to 1 July 2016)
Members of Investment Advisory Board Olgario de Castro Gualdino da Silva Torres Trovik Kevin Bailey
Ex Officio (non-voting) Venancio Alves Maria
Rui Ferreira Magno (alternate, Basilio R.D.C. Soares)
Governor of Central Bank of Timor-Leste Abraão de Vasconselos
Executive Director of the Petroleum Fund Venancio Alves Maria
Operational Manager Banco Central de Timor-Leste Avenida Xavier do Amaral, no. 9 Dili
Timor-Leste
Investment Managers Banco Central de Timor-Leste Bank for International Settlements
Schroders Investment Management Limited State Street Global Advisors
BlackRock Investment Management Australia Limited Alliance Bernstein
Wellington Management
Members of Petroleum Fund Consultative Council Mericio Juvinal dos Reis Jose Augusto Fernandes Teixeira Rui Meneses da Costa
Julio Fernandes
Pe. Julio Crispim Ximenes Belo Bonaventura M. Bali
Zelia Fernandes
Custodian J P Morgan Chase Bank N.A.
19
Petroleum Fund of Timor-Leste Statement by the Director General of Treasury
31 December 2016
BACKGROUND
The Petroleum Fund Law No. 9/2005 promulgated on 3 August 2005 and amended on 28 September 2011 (Petroleum Fund Law No. 12/2011) established the Petroleum Fund of Timor-Leste (“Petroleum Fund”). The Banco Central de Timor-Leste (“BCTL”) is responsible for the operational management of the Petroleum Fund. In accordance with a Management Agreement dated 12 October 2005 and amended on 25 June 2009 between the Ministry of Finance and the BCTL, BCTL is also responsible for maintaining the books of account for the Petroleum Fund on behalf of the Director General of Treasury.
FINANCIAL STATEMENTS
In accordance with Article 21 of the Petroleum Fund Law, the financial statements have been prepared in accordance with International Financial Reporting Standards (IFRS). The statements are:
Statement of profit or loss and other comprehensive income,
Statement of financial position,
Statement of changes in capital,
Statement of cash flows, and
Notes to the financial statements
These financial statements cover the year ended 31 December 2016.
The Petroleum Fund’s financial statements are the most complex IFRS financial statements produced in Timor-Leste. After ten years of the
Petroleum Fund’s existence, it is timely to review the format of its statutory financial reporting in light of its transparency obligations. Therefore a working group reviewed the financial statements and supporting notes during 2016 with the objective of making them easier for readers to understand. As a result, accounting policies that were previously included all together in a separate note are now contained individually in the note with the related information. Similarly for information about risks. Commentaries have been added to explain the various components of the financial statements. In general, the notes have been restructured so as to provide a general introduction to the subject matter of the note, followed by financial tables elaborating on the data in the primary statements, a description of the risks, important judgements or key assumptions that have been made in presenting the data, and the related accounting policies. The notes have been re-ordered to better support the information in the primary financial statements.
The financial statements have been independently audited by Deloitte Touche Tohmatsu whose audit opinion is attached to the financial statements.
PETROLEUM FUND CAPITAL
The Petroleum Fund had capital of US$16.2bn on 1 January 2016 (2015: US$16.5bn). During the period, taxes and other petroleum revenue under Article 6 of the Petroleum Fund were US$0.2bn (2015: US$1.0bn). The Fund recorded a gain of US$648m (2015: US$21m loss)
during the period. A summary of transactions for the income is given in the “Statement of profit or loss and other comprehensive income”.
US$1.24bn was transferred from the Petroleum Fund to the Consolidated Fund during the year. The capital of Petroleum Fund as at 31
December 2016 was US$15.8bn (2015: US$16.2bn). A summary of the transactions is given in the “Statement of changes in capital”.
BENCHMARKS AND PERFORMANCE
During 2016, the asset allocation of the fund was 60% Fixed interest securities and 40% Global equities, the Investment Advisory Board considers this to be an appropriate level given the long term investment horizon of the Fund.
The Board intends to review the investment strategy and asset allocation of the Fund regularly with the objective of maintaining an alignment between the expected level of returns and the Estimated Sustainable Income (ESI).
Summary of benchmarks
BOA Merrill Lynch US Government 0-5 Years 40.0% 40.0%
BOA Merrill Lynch US Government 5-10 Years 10.0% 10.0%
Barclays Global 10.0% 10.0%
Total Fixed Interest 60.0% 60.0%
Global Equities
MSCI World 40.0% 40.0%
Total Global Equities 40.0% 40.0%
20
Petroleum Fund of Timor-Leste Statement by the Director General of Treasury
31 December 2016
Performance
In accordance with the Article 24.1(a) of the Petroleum Fund and the provisions of the Management Agreement, the Petroleum Fund assets were invested in mandated instruments during the year. The list of instruments held as at 31 December 2016 is given at note 23. The credit exposure by credit rating is given in the note 13(b)(iii). The performance of the Petroleum Fund during the period has been in accordance with the mandate of the Management Agreement.
Net gains on financial assets at fair value through the profit or loss has been significant at US$447m in 2016 reflecting the performance of global equities during the year. The net foreign exchange loss reflects the strengthening of the US dollar during 2016 into which foreign investments are translated.
During the period, Ministry of Finance together with the BCTL have been able to accomplish the stewardship and fiduciary role for the Petroleum Fund.
SIGNIFICANT CHANGES IN THE STATE OF AFFAIRS
There were no significant changes in the state of affairs of the Fund during the year.
APPROVAL OF FINANCIAL STATEMENTS
The accompanying financial statements for the year ended 31 December 2016 have been approved on behalf of the Ministry of Finance by:
Regina de Jesus de Sousa
Acting Director General of Treasury
21
Annex II
22
Independent
Auditor’s Report to The Ministry of Finance,
Democratic Republic of Timor-Leste,
in respect of the Petroleum Fund Annual Financial Report for the year ended 31 December 2016
Opinion
We have audited the financial statements of the Petroleum Fund of Timor-
Leste (the ‘Petroleum Fund’),
which comprises the statement of financial position as at 31 December 2016, and the statement of
comprehensive income, statement of changes in equity and statement of cash flows for the year then
ended, and notes to the financial statements, including a summary of significant accounting policies.
In our opinion, the accompanying financial statements present fairly, in all material respects, the
financial position of the Petroleum Fund as at 31 December 2016, and its financial performance and its
cash flows for the year then ended in accordance with International Financial Reporting Standards
(IFRSs).
Basis for Opinion
We conducted our audit in accordance with International Standards on Auditing (ISAs). Our
responsibilities under those standards are further described in the
Auditor’s Responsibilities for the Audit
of the Financial Statements
section of our report. We are independent of the Petroleum Fund in
accordance with the ethical requirements of the
International Ethics Sta
ndards Board for Accountants’
Code of Ethics for Professional Accountants
(IESBA Code) that are relevant to our audit of the financial
statements. We have also fulfilled our ethical other responsibilities in accordance with the IESBA Code.
We believe that the audit evidence we have obtained is sufficient and appropriate to provide a basis for
our opinion.
Other Information
Management is responsible for the other information included in the Petroleum Fund Annual Report.
The other information, which does no
t include the financial statements and our auditor’s report thereon,
which we received prior to the date of this auditor’s report
is comprised of the following:
Annex I Statement by Director General of Treasury
Annex III Statement on Accounting Policies of the Petroleum Fund for the Fiscal Year 2016
Annex IV Comparison of Income Derived from the Investment of the Petroleum Fund Assets
with the Previous Three Fiscal Years
Annex V Comparison of Nominal Income on the Investment of the Petroleum Fund Assets to
the Real Returns
Annex VI Comparison of Nominal Income on the Investment of the Petroleum Fund Assets
with the Benchmark Performance Index
Annex VII Comparison of the Estimated Sustainable Income with the Sum of Transfers from
the Petroleum Fund
Annex VIII Statement on Borrowing
Annex IX A List of Persons Holding Positions Relevant for the Operations and Performance
of the Petroleum Fund
Annex X Statement on Total Withdrawals versus the Approved Appropriation Amount
Annex XI Article 35 Report on the Petroleum Fund Receipts from Deloitte Touche Tohmatsu
Annex XII Advice Provided by the Investment Advisory Board
Annex XIII Implementation of the Santiago Principles
23
the Message from Minister of Finance
The Petroleum Fund at a Glance
Our opinion on the financial statements does not cover the other information and we do not express any
form of assurance conclusion thereon.
In connection with our audit of the financial statements, our responsibility is to read the other
information and, in doing so, consider whether the other information is materially inconsistent with the
financial statements or our knowledge obtained in the audit, or otherwise appears to be materially
misstated. If, based on the work we have performed on the other information obtained prior to the date
of this auditor’s report, we conclude that there is a material misstatement of this other information, we
are required to report that fact. We have nothing to report in this regard.
Responsibilities of Management and Those Charged with Governance for the Financial Statements
Management of the Petroleum Fund is responsible for the preparation and fair presentation of the
financial statements in accordance with IFRSs and for such internal control as management determines
is necessary to enable the preparation of financial statements that are free from material misstatement,
whether due to fraud or error.
In prepari
ng the financial statements, management is responsible for assessing the Petroleum Fund’s
ability to continue as a going concern, disclosing, as applicable, matters related to going concern and
using the going concern basis of accounting unless management either intend to liquidate the Petroleum
Fund or to cease operations, or has no realistic alternative but to do so.
Those charged with governance are responsible for overseeing the Petroleum Fund’s financial reporting
process.
Auditor’s Responsibilities f
or the Audit of the Financial Statements
Our objectives are to obtain reasonable assurance about whether the financial statements as a whole are
free from material misstatement, whether due to fraud or error, and to issue an auditor’s report that
includes our opinion. Reasonable assurance is a high level of assurance, but is not a guarantee that an
audit conducted in accordance with the ISAs will always detect a material misstatement when it exists.
Misstatements can arise from fraud or error and are considered material if, individually or in the
aggregate, they could reasonably be expected to influence the economic decisions of users taken on the
basis of these financial statements.
As part of an audit in accordance with the ISAs, we exercise professional judgement and maintain
professional scepticism throughout the audit. We also:
Identify and assess the risks of material misstatement of the financial statements, whether due
to fraud or error, design and perform audit procedures responsive to those risks, and obtain audit
evidence that is sufficient and appropriate to provide a basis for our opinion. The risk of not
detecting a material misstatement resulting from fraud is higher than for one resulting from
error, as fraud may involve collusion, forgery, intentional omissions, misrepresentations, or the
override of internal control.
Obtain an understanding of internal control relevant to the audit in order to design audit
procedures that are appropriate in the circumstances, but not for the purpose of expressing an
opinion on the effectiveness of the Petroleum Fund
’s internal control.
Evaluate the appropriateness of accounting policies used and the reasonableness of accounting
estimates and related disclosures made by management.
24
attention in our auditor’s report to the related disclosures in the financial statements or, if such
disclosures are inadequate, to modify our opinion. Our conclusions are based on the audit
evidence obtained up to the date of our auditor’s report. However, future events or conditions
may cause the Petroleum Fund to cease to continue as a going concern.
Evaluate the overall presentation, structure and content of the financial statements, including
the disclosures, and whether the financial statements represent the underlying transactions and
events in a manner that achieves fair presentation.
We communicate with management regarding, among other matters, the planned scope and timing of
the audit and significant audit findings, including any significant deficiencies in internal control that we
identify during our audit.
28 April 2017
25
Petroleum Fund of Timor-Leste
Statement of profit or loss and other comprehensive income for the year ended 31 December 2016
Year ended 31/12/2016
Year ended 31/12/2015
Note USD USD
Income
Interest income 4 157,797,693 156,789,531 Dividend income 5 175,011,786 163,013,772 Trust income 5 7,516,692 6,886,553 Other investment income 545,803 20,200 Net gains/(losses) on financial assets and liabilities at fair value through profit or loss 6 447,243,609 (21,060,960) Net foreign exchange losses 7 (115,796,014) (302,027,185)
Total income 672,319,569 3,621,911
Expenses 8
External management and custody fees 19 (8,257,197) (9,583,916) Investment Advisory Board expenses 19 (203,420) (164,456) BCTL operational management fees 19 (4,934,218) (5,605,775) Other expenses 19 (1,475,000) (312,282)
Total expenses (14,869,835) (15,666,429)
Profit/(Loss) before tax 657,449,734 (12,044,518)
Withholding taxes 9 (9,767,840) (9,367,122) Profit/(Loss) for the year 647,681,894 (21,411,640)
Other comprehensive income - -
Total comprehensive income/(loss) for the year 647,681,894 (21,411,640)
26
Petroleum Fund of Timor-Leste Statement of financial position
as at 31 December 2016
As at 31/12/2016
As at 31/12/2015
Note USD USD
Assets
Cash and cash equivalents 11 108,985,160 135,176,810 Other receivables 12 27,853,010 26,890,851 Financial assets at fair value through profit or loss 13,14 15,715,654,040 16,076,302,454
Total assets 15,852,492,210 16,238,370,115
Liabilities
Payables for securities purchased 3,211,916 15,627,166 Accounts payable 4,953,007 5,170,444
Total liabilities 8,164,923 20,797,610
Net assets 15,844,327,287 16,217,572,505
Capital
Capital 15,844,327,287 16,217,572,505
27
Petroleum Fund of Timor-Leste Statement of changes in capital for the year ended 31 December 2016
Note
Year ended 31/12/2016
USD
Year ended 31/12/2015
USD
Capital at the beginning of the year 15 16,217,572,505 16,538,617,460 Petroleum Fund Gross Receipts 15 223,872,888 1,003,813,967
(pursuant to Article 6 of the Petroleum Fund Law) 16,441,445,393 17,542,431,427
Transfers to the Consolidated Fund of Timor-Leste
(pursuant to Article 7 of the Petroleum Fund Law) 15 (1,244,800,000) (1,278,500,000)
Transfers for refunds of taxation
(pursuant to Article 10 of the Petroleum Fund Law) 15 - (24,947,282)
Total comprehensive (loss)/income for the year 647,681,894 (21,411,640)
Capital at the end of the year 15,844,327,287 16,217,572,505
28
Petroleum Fund of Timor-Leste Statement of cash flows for the year ended 31 December 2016
Year ended 31/12/2016
Year ended 31/12/2015
Note USD USD
Cash flows from operating activities
Proceeds from sale of financial assets at fair value through profit or loss 13 10,377,148,481 12,822,234,541 Purchases of financial assets at fair value through profit or loss 13 (9,698,427,751) (12,746,142,226) Interest received 161,397,601 153,916,746 Dividends received 161,637,232 150,425,621 Trust distributions received 7,495,819 6,785,495 External management and custody fees paid (13,612,273) (13,672,515) Other operating receipts 913,627 20,200 Other operating payments (1,475,000) (312,282) Net cash utilized in operating activities 16 995,077,736 373,255,580
Cash flows from financing activities
Petroleum Fund Gross Receipts 15 223,872,888 1,003,813,967 Transfer payments to the Consolidated Fund of Timor-Leste 15 (1,244,800,000) (1,278,500,000) Refunds of tax receipts 15 - (24,947,282) Net cash flows provided by financing activities (1,020,927,112) (299,633,315)
Net (decrease)/increase in cash and cash equivalents (25,849,376) 73,622,265
Cash and cash equivalents at the beginning of the year 135,176,810 66,842,141 Effects of foreign currency exchange rate changes on cash and cash equivalents (342,274) (5,287,596) Cash and cash equivalents at 31 December 11 108,985,160 135,176,810
29
Petroleum Fund of Timor-Leste Notes to the financial statements for the year ended 31 December 2016
Contents
Page
PART I INTRODUCTION 30
1. Fund information 30
2. Statement of compliance with IFRS 30
3. Basis of preparation 30
PART II NOTES TO THE STATEMENT OF PROFIT OR LOSS AND OTHER COMPREHENSIVE INCOME 31
4. Interest income 31
5. Dividend and trust income 31
6. Gain or loss on financial assets and liabilities at fair value through profit or loss 32
7. Foreign exchange gain or loss 32
8. Expenses 32
9. Taxation 33
PART III NOTES TO THE STATEMENT OF FINANCIAL POSITION 33
10. Risk Management 33
13. Financial assets at fair value through profit or loss 36
14. Financial Liabilities 44
PART IV NOTES TO THE STATEMENT OF CHANGES IN CAPITAL 45 15. Capital receipts and payments 45
PART V NOTES TO THE STATEMENT OF CASH FLOWS 47
16. Reconciliation of net cash flows 47
PART VI NON-FINANCIAL DISCLOSURES 47
17. Personnel 47
18. Contingent assets, liabilities and commitments 47
19. Related party 48
20. Encumbrances on the Petroleum Fund 48 21. Application of new and revised IFRS 49 21.1. New and revised IFRS applied with no material effect on the financial statements 49 21.2. Adoption of IFRS standards that are not yet effective 49
22. Subsequent events 49
PART VII SCHEDULE OF FINANCIAL ASSETS 50
Petroleum Fund of Timor-Leste
Notes to the financial statements
for the year ended 31 December 2016
30
PART I: INTRODUCTION
1. Fund information
The Petroleum Fund of Timor-Leste (“Petroleum Fund”) was established under the provisions of the Petroleum Fund Law No. 9/2005 as amended by Law No. 12/2011 on 28 September 2011.
The investment strategy and benchmarks of the Petroleum Fund are determined by the Minister of Finance based on advice from the Investment Advisory Board (IAB).
The Banco Central de Timor-Leste (BCTL) having its office at Avenida Xavier do Amaral, no. 9, Dili, Timor-Leste, is responsible for the operational management of the Petroleum Fund, and is the registered owner of all the assets of the Petroleum Fund. The management of the Petroleum Fund is undertaken according to a Management Agreement between the Ministry of Finance and the BCTL.
The Petroleum Fund’s objective is to meet benchmark returns on its capital within the risk limit provided in mandates and within the limits established in Articles 14 and 15 of the Petroleum Fund Law relating to Investment Policy and Investment Rules.
The Petroleum Fund’s investment portfolio of assets at fair value through profit or loss (including cash and cash equivalents) complied with the legislative and contractual requirements throughout the period.
These financial statements were authorized for issue by the Director General of Treasury on 28 April 2017.
2. Statement of compliance with IFRS
In accordance with Article 21 of the Petroleum Fund Law, the financial statements have been prepared in accordance with International
Financial Reporting Standards (IFRS) (formerly: “International Accounting Standards”).
The Petroleum Fund has adopted the IFRS that were applicable during the year under review.
Information about the impact of new and forthcoming IFRS on these financial statements is provided in Note 21.
3. Basis of preparation
Items included in the Petroleum Fund's financial statements are measured and presented in United States Dollars, being the functional and official currency of the Democratic Republic of Timor Leste.
The financial statements are prepared on the historical cost basis, except for certain financial investments that are measured at fair value through profit or loss, as explained in the accounting policies described herein.
The accounting policies have been consistently applied by the Petroleum Fund. Estimates and Judgements
The preparation of financial statements in conformity with IFRS requires management to make judgments, estimates and assumptions that affect the application of policies and reported amounts of assets, liabilities, income and expense. The estimates and associated assumptions are based on historical experience and other factors that are believed to be reasonable under the circumstances, the results of which form the basis of making the judgments about carrying values and assets and liabilities that are not readily apparent from other sources. Estimates use observable data to the extent practicable. However, areas such as potential market changes, credit risk, volatilities and correlations require management to make estimates that could affect the reported fair value of financial instruments. Actual results may therefore vary from these estimates. This process involves a high degree of judgement or complexity.
Revisions to accounting estimates are recognized in the period in which the estimate is revised if the revision affects only that period, or in the period of the revision, and future periods if the revision affects both current and future periods