UNCORRECTED PR
OOF
1
The myth of the
‘
unaffected
’
side after unilateral stroke: Is reorganisation of the
2
non
‐
infarcted corticospinal system to re-establish balance the price for recovery?
3
S.
Q1
Graziadio
a,⁎
, L. Tomasevic
c, G. Assenza
b, F. Tecchio
b,c,d,e,1, J.A. Eyre
a,1 4 aDevelopmental Neuroscience, Institute of Neuroscience, Newcastle University, Newcastle upon Tyne, UK5 bNeurologia Clinica, Università Campus Bio-Medico di Roma, Italy
6 cIstituto di Scienze e Tecnologie della Cognizione, CNR, Rome, Italy
7 dAFaR, Center of Medical Statistics and IT, Fatebenefratelli Hospital, Rome, Italy
8 eDepartment of Imaging, San Raffaele Cassino, Italy 9
10
a b s t r a c t
a r t i c l e
i n f o
11 Article history: 12 Received 12 June 2012 13 Revised 17 August 2012 14 Accepted 28 August 2012
15 Available online xxxx
16 17 18
19 Keywords:
20 Motor
21 Stroke
22 Corticospinal 23 Homeostatic plasticity 24 Recovery
25 EEG
26 EMG
27 Corticomuscular coherence
28 Symmetry 29 Reorganisation
30 Background:Bilateral changes in the hemispheric reorganisation have been observed chronically after unilateral
31 stroke. Our hypotheses were that activity dependent competition between the lesioned and non-lesioned
32 corticospinal systems would result in persisting asymmetry and be associated with poor recovery.
33 Methods:Eleven subjects (medium 6.5 years after stroke) were compared to 9 age-matched controls. The
34 power spectral density (PSD) of the sensorimotor electroencephalogram (SM1-EEG) and electromyogram
35 (EMG) and corticomuscular coherence (CMC) were studied during rest and isometric contraction of right or
36 left opponens pollicis (OP). Global recovery was assessed using NIH score.
37 Findings:There was bilateral loss of beta frequency activity in the SM1-EEGs and OP-EMGs in strokes compared
38 to controls. There was no difference between strokes and controls in symmetry indices estimated between the
39 two corticospinal systems for SM1-EEG, OP-EMG and CMC. Performance correlated with preservation of beta
40 frequency power in OP-EMG in both hands. Symmetry indices for the SM1-EEG, OP-EMG and CMC correlated
41 with recovery.
42 Interpretation:Significant changes occurred at both cortical and spinomuscular levels after stroke but to the
43 same degree and in the same direction in both the lesioned and non-lesioned corticospinal systems. Global
re-44 covery correlated with the degree of symmetry between corticospinal systems at all three levels—cortical and
45 spinomuscular levels and their connectivity (CMC), but not with the absolute degree of abnormality. Re‐
46 establishing balance between the corticospinal systems may be important for overall motor function, even if
47 it is achieved at the expense of the non-lesioned system.
48 © 2012 Published by Elsevier Inc.
49 50
51 52
53 Introduction
54 Stroke in the territory of the middle cerebral artery (MCA2) often
55 causes serious disturbances within the motor system resulting in
56 acute hemiparesis and often permanent impairment of arm control
57 and dexterity. Extensive studies of cortical function after unilateral
58 MCA stroke indicate that the motor deficits do not arise solely from
59 direct focal damage to the sensorimotor cortex, but that intra and
60 inter-hemispheric reorganisation and abnormal interaction between
61 key areas remote from the infarct also contribute to the
pathophysiol-62 ogy (Grefkes and Fink, 2011). The control and coordination of the
63 upper limb involve distributed bilateral subcortical and spinal
net-64 works and the pathophysiology of upper limb control after MCA
65 stroke is likely also to involve abnormal reorganisation and
interac-66 tion within and between these networks. Extensive bilateral
67 reorganisation of the corticospinal system, driven by activity
depen-68 dent competition between the lesioned and non-lesioned
69 corticospinal systems, has already been described after unilateral
70 perinatal stroke (Eyre et al., 2007; O'Sullivan et al., 1998).
71 Markers of plasticity normally only expressed in the neonatal
72 brain are re-expressed acutely after adult stroke, involving not only
73 the lesioned but also the non-lesioned cortex (Carmichael, 2003).
74 Functional imaging acutely has shown abnormal excess activation of
75 the motor network in the non-lesioned ipsilateral hemisphere during
76 movement of the hand affected (Rehme et al., 2012). A progressive
77 shift of the hemispheric activation balance from the lesioned to the
78 non-lesioned hemisphere has been demonstrated over thefirst few
79 months after stroke and the greater degree of shift towards the Experimental Neurology xxx (2012) xxx–xxx
⁎ Corresponding author at: Developmental Neuroscience, Sir James Spence Institute of Child Health, Royal Victoria Infirmary, Queen Victoria Road, Newcastle upon Tyne, NE1 4LP, UK. Fax: +44 191 282 4725.
E-mail addresses:[email protected](S. Graziadio),[email protected]
(L. Tomasevic),[email protected](G. Assenza),[email protected]
(F. Tecchio),[email protected](J.A. Eyre).
1These two authors have equally contributed to the work.
2CMC = corticomuscular coherence; OP = opponens pollicis; MVC = maximum
volun-tary contraction; PSD = power spectral density; L = lesioned; nL = non-Lesioned; SymI = symmetry indexes; SM1 = sensorimotor cortex.
YEXNR-11253; No. of pages: 8; 4C:
0014-4886/$–see front matter © 2012 Published by Elsevier Inc.
http://dx.doi.org/10.1016/j.expneurol.2012.08.031
Contents lists available atSciVerse ScienceDirect
Experimental Neurology
UNCORRECTED PR
OOF
80 unaffected hemisphere the less the recovery of function over this81 time (Calautti et al., 2001). Transcranial magnetic stimulation (TMS) 82 and effective connectivity studies reveal that acutely after stroke the
83 non-lesioned primary sensorimotor cortex exerts increased
inhibito-84 ry influences on the lesioned sensorimotor cortex (Takeuchi et al., 85 2005) and functional recovery after unilateral stroke is predicted by 86 the balance between the activity dependent plasticity of each
hemi-87 sphere (Di Lazzaro et al., 2010). Together these observations are con-88 sistent with activity dependent competition between the lesioned
89 and non-lesioned corticospinal systems being reinitiated during
90 recovery from adult onset MCA stroke.
91 Previous studies demonstrating bilateral plasticity after unilateral
92 MCA stroke have focused on hemispheric reorganisation (Sanes and 93 Donoghue, 2000) and have not yet considered reorganisation of the 94 corticospinal system as a whole. In this study we investigate
95 reorganisation of the lesioned and non-lesioned corticospinal systems
96 in patients who are more than 18 months after unilateral stroke
oc-97 curring in adult age.
98 Our hypotheses were that in the chronic phase after adult onset
99 unilateral stroke:
100 (i) there is bilateral reorganisation of the corticospinal systems,
101 reflected not only at the level of the motor cortex (Sanes and 102 Donoghue, 2000), but also in the spinal motoneurones and
103 motor units.
104 (ii) there is activity dependent competition between the lesioned
105 and non-lesioned corticospinal systems, indicated by
recipro-106 cal reorganisation and persisting asymmetry between the two
107 systems during the chronic phase after stroke.
108 (iii) the greater the degree of asymmetry between the corticospinal
109 systems the poorer the recovery.
110 In order to compare the degree of reorganisation at three levels,
111 cortex, motor units and their functional connectivity, both within
112 and between the lesioned and non-lesioned corticospinal systems,
113 we focus on the oscillatory activity of the sensorimotor cortices and
114 of the electromyogram recorded bilaterally over hand muscles and
115 on corticospinal functional connectivity reflected in corticomuscular
116 coherence (CMC) (Graziadio et al., 2010).
117 Material and methods
118 The approval of the Ethical Committee of San Giovanni Calibita
119 Fatebenefratelli Hospital and written, informed consent from all the
120 subjects were obtained.
121 Subjects
122 The stroke group comprised 11 previously right-handed subjects
123 who had suffered afirst ever, mono‐hemispheric, MCA territory,
ische-124 mic stroke more than 18 months previously, confirmed by magnetic
125 resonance imaging, MRI (3 female, mean age 69±10 years; time
126 elapsed from the stroke, median 6.5 years, range 1.8 to 7.4 years;
127 Table 1). The subjects were selected to have a range of initial deficits 128 (NIHt0 1–16) and degrees of recovery (NIHt0–6;Table 1). Subjects 129 with peripheral neuropathy, dementia or severe aphasia were excluded.
130 The control group comprised 9 healthy right‐handed subjects,
131 matched in age with the stroke group (7 female, mean age 68 ±
132 10 years) with no past history of a neurological disorder.
133 Clinical assessments
134 Muscle strength
135 In the stroke group muscle strength was assessed in wristflexors
136 and extensors, opponens pollicis (OP), and thefirst dorsal interosseous
137 of the affected upper limb using the MRC scale and a mean score
138 obtained.
139
Recovery index
140 Stroke severity was assessed using the National Institute of Health
141 Stroke Scale both acutely (NIHt0), and at the time of the study (NIHt).
142 An index of recovery was determined as the fraction of recovery with
143 respect to the total possible (which equals NIHt0since NIHtin healthy
144 A simple task involving the corticospinal system was chosen to
en-149 sure, as far as possible, that patients and controls could achieve a
sim-150 ilar level of motor performance with each hand, to prevent the level of
151 performance becoming a confounder. Subjects sat with their arms
152 supported (flexed at the elbow, forearm semi‐pronated) and opposed
153 their thumb to the other fingers against resistance of a
semi-154 compliant object. The pressure generated was displayed (pressure
sen-155 sor 40PC100G1A, Honeywell Sensing and Control, Golden Valley,
156 Minneapolis, USA). Subjects first performed a maximum voluntary
157 contraction (MVC) for each hand and then alternating periods of 20 s
158 of steady isometric contraction and rest with each hand. The target
159 level was set to 20% of MVC for each hand, to match between groups
160 and between hands the subjective sense of effort and the level of
fa-161 tigue. A total of 240 s of contraction and rest were recorded for each
162 hand. 120 s of continuous rest with eyes open was also recorded.
163 mastoid reference) and surface EMG from the skin over right and
167 left OP muscles were recorded using Ag/AgCl electrodes (band pass
168 filter 0.48–256 Hz, sampling rate 1024 Hz,) and a Micromed System
169 Plus SAM32 (Micromed S.P.A. Mogliano, Veneto, Italy).
170
Data analysis
171
Sensorimotor cortex EEG
172 The bipolar derivations over the contralateral hemispheres
show-173 ing maximum CMC with the EMG were identified as the cortical
com-174 ponent of the corticospinal system for each hemisphere and these
175 bipolar derivations were used for further analysis (Graziadio, et al.,
176
2010).
177
Spinal motoneurons and muscle components
178 The surface EMG was recorded as a measure of the oscillatory
ac-179 tivity of spinal motoneuronal groups and the membrane properties of
180 musclefibers.
Table 1 t1:1
t1:2
Stroke group: clinical information. F indicates female, M male.
t1:3
NIHt NIHt0 MRC Lesion site
t1:4
59 F Left 7.1 6 16 3.5 Subcortical
t1:5
83 M Left 6.5 0 11 5 Cortical–subcortical
t1
:8
69 F Left 3.1 2 13 5 Cortical–subcortical
t1
:9
57 F Right 7.4 4 7 4.2 Cortical–subcortical
t1
:10
74 M Right 7.2 0 1 5 subcortical
t1:11
72 F Right 6.3 4 14 3 Cortical–subcortical
t1:12
69 M Right 6.1 1 3 5 Cortical
t1:13
60 M Right 1.9 3 12 4.5 Cortical–subcortical
t1
:14
82 M Right 1.8 1 5 4.7 Cortical–subcortical
UNCORRECTED PR
OOF
181 Estimation of power spectral density (PSD)
182 Transition periods between rest and contraction were disregarded
183 (0.5 s). 90 s in total of the task for each hand and of rest was analysed.
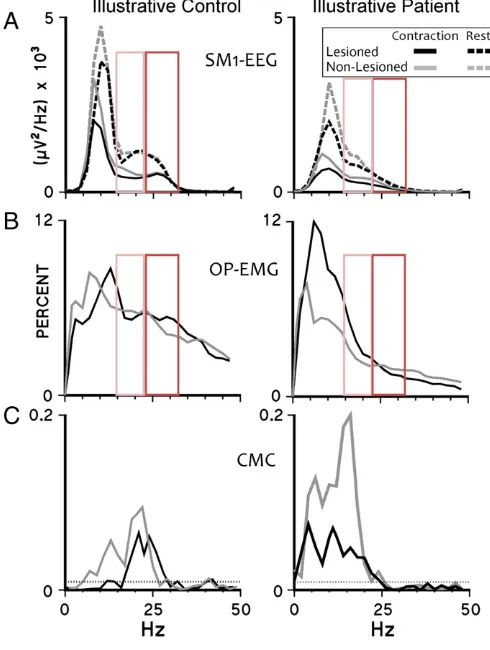
184 The power spectral densities (PSDs) of EEG (Fig. 1A) and rectified 185 EMG signals (Fig. 1B) were estimated using the Welch procedure 186 (512 data point epochs, Hanning-windowed, 50% overlap). Power
187 was grouped into bands: 2–6 Hz (delta–theta), 8–12 Hz (alpha),
188 14–22 Hz (low beta), 24–32 Hz (high beta), 34–46 Hz (low
189 gamma) and 54–100 Hz (high gamma) and normalised by the
190 number of frequency points in each band. For the EEG, power in the
191 gamma frequency bands was not analysed, since at rest gamma
activ-192 ity in the EEG is poorly represented and during a steady contraction it
193 is not observed in all subjects (Crone, et al., 1998).
194 Estimation ofCMC
195 CMC was estimated using the method described inGraziadio et al. 196 (2010) (Terry and Griffin, 2008). The number, amplitude and 197 frequency of significant CMC peaks were evaluated (Fig. 1C).
198
Symmetry indices
199 To investigate the degree of symmetry in oscillatory activity
be-200 tween the lesioned (L) and non-lesioned (nL) corticospinal systems
201 at cortical, spinal/muscular levels we estimated a symmetry index:
SymIx¼1− (i) for the sensorimotor cortex EEG power at rest (x=sensorimotor
205 cortex EEG PSD) and
206 (ii) for the relative OP‐EMG power during contraction (x=relative
207 OP-EMG): where i is the frequency (n=32 Hz for SM1-EEG
208 andn=100 Hz for OP-EMG).
209 To estimate the degree of symmetry in cortico-spinal coupling
210 during contraction we computed:
SymICMC¼1− CMC where CMCMaxis the amplitude of the highest peak of CMC.
213
Performance of the motor task
214 We have previously demonstrated a linear relationship between
215 the coefficient of variation of the force and that of the rectified
216 OP-EMG during this task (Graziadio, et al., 2010). Performance was
217 estimated as: Performance¼1−mean EMGstd EMGðð RectRectÞÞ:
218
Estimation of fatigue during the motor task
219 The pressure generated, the OP-EMG root mean squared
ampli-220 tude, and the median spectral frequency of the OP-EMG were used
221 as indictors of fatigue (Jouanin, et al., 2009). Fatigue during each
222 20 s period of contraction (fatigue within trial) was considered by
223 comparing the mean values during thefirst 5 s of a contraction with
224 that of the last 5 s; fatigue across the total duration of the study
225 (fatigue along session) was considered by comparing the mean values
226 duringfirst 3 periods of contraction with that of the last 3 periods.
227
Statistical analyses
228 We grouped the non-lesioned corticospinal system of stroke
229 patients (non-lesioned hemisphere and non-paretic hand) and the
le-230 sioned corticospinal system of the patients (lesioned hemisphere and
231 paretic hand) irrespective of the side (left or right hemisphere) of the
232 lesion. To control for a potentially confounding effect of left vs. right
233 differences, before approaching the statistical analysis, left and right
234 data were randomly mixed in controls to achieve the same left/right
235 distribution of lesioned/non-lesioned sides in patients. In addition,
236 to prevent possible systematic bias, computation of the PSD was
237 completed blind to whether a hemisphere represented a lesioned or
238 non‐lesioned hemisphere for either group.
239 The data were normally distributed. Significance was set at
240 pb0.05, with Bonferroni correction.
241 Group differences (stroke versus control): a general linear model
242 analysis of variance (ANOVA) with Greenhouse–Geisser correction if
243 required was applied (SPSS 15, SPSS Inc, Chicago, Illinois, USA).
244
Relationship of corticospinal system variables with performance
245 A univariate ANOVA was used with the corticospinal system
246 variable as a covariate.
247
Relationship of corticospinal system variables with recovery in the stroke
248
group
249 Spearman correlation was used.
Fig. 1.Power spectral density of SM1-EEG, relative OP-EMG and CMC: representative data. Data are plotted from an illustrative control subject (left column) and an illustra-tive stroke subject (right column). Grey spectra indicate the non-lesioned corticospinal system and their controls, black spectra—the lesioned corticospinal system and their controls. A. PSDs of the contralateral sensorimotor cortex EEG during rest (dashed lines) and during contraction (continuous lines). B. The relative powers of surface EMG recorded over opponens pollicis. C. CMC spectra. The dotted horizontal lines indi-cate the 95% confidence level for a CMC of zero. Note the bilateral loss of beta activity in this stroke patient compared to the exemplar control subject (enlightened in the red boxes: orange for low beta, red for high beta frequency range; continuous line for sig-nificant results on the whole dataset, pb0.05, dotted for trends, pb0.1). (For interpre-tation of the references to colour in thisfigure legend, the reader is referred to the web version of this article.)
UNCORRECTED PR
OOF
250 Results251 The clinical data are reported inTable 1. Data are reported as 252 means ± standard errors of the mean.
253 Performance of the motor task
254 There were no differences in performance between control and
255 stroke Groups nor between Tasks (contraction with lesioned or
256 non-lesioned hand) [control: non-lesioned hand, 0.51± 0.02;
257 lesioned hand, 0.50 ± 0.03; stroke: non-lesioned hand, 0.50 ± 0.02;
le-258 sioned hand, 0.49± 0.03], ensuring that differences between lesioned
259 and non-lesioned corticospinal systems and between groups could
260 not be attributed to differences in performance of this simple task.
261 Fatigue
262 There were no significant differences between control and stroke
263 Groups nor Groups∗Fatigue interactions (within trial or across trials)
264 in the pressure level [p > 0.26], in the OP-EMG amplitude [p > 0.18] or
265 in the median spectral frequency [p > 0.6], excluding fatigue as a
266 source of differences between Groups or between Tasks (contraction
267 with lesioned or non-lesioned hand).
268 Sensorimotor cortex EEG PSD
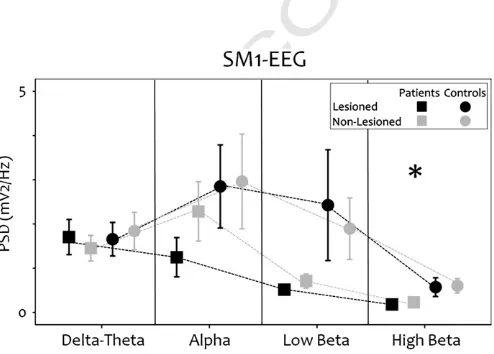
269 There was decreased power in high beta in the strokes compared
270 to controls [non-lesioned hemisphere: p = 0.025; lesioned
hemi-271 sphere: p = 0.018] and a trend for decreased power in low beta
272 [non-lesioned hemisphere: p = 0.07; lesioned hemisphere: p = 0.07]
273 at rest and during the motor task (Figs. 2 and 3).
274 OP-EMG PSD
275 Total OP-EMG power
276 During rest there was no significant difference between Groups
277 [p = 0.31] nor a Groups∗State (voluntary contracted hand, resting
278 hand) interactions [p = 0.25], indicating that, even if mirroring did
279 occur occasionally, its incidence was similar across stroke and control
280 groups. No difference between Groups nor between Tasks was found
281 during voluntary contraction [p = 0.124, control: 0.35 ± 0.17 mV2,
282 stroke: 0.72 ± 0.1 mV2].
283
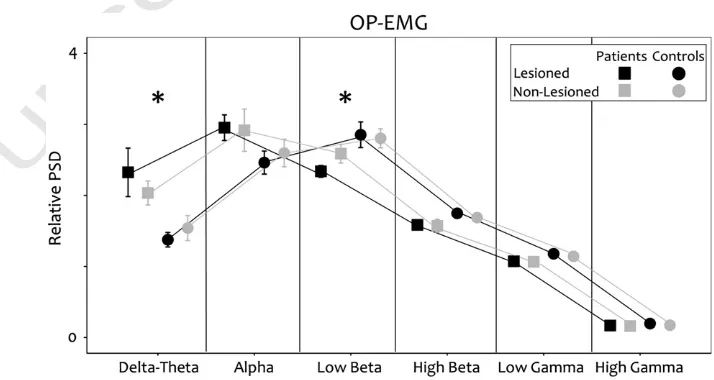
RelativeOP-EMG PSD
284 In the stroke group there was increased power in 2–7 Hz (delta/
285 theta; p =0.019) and reduced power in 13–23 Hz (low beta; p =
286 0.048;Fig. 4) during contraction of the paretic and the non-paretic
287 hands compared to controls.
288
Contralateral CMC
289 No difference was found between stroke and control groups in
290 CMC amplitude [p = 0.645] and peak frequency [p = 0.135]. Stroke
291 subjects had a trend [p = 0.058] towards a greater number of signifi
-292 cant peaks in both the lesioned [control: 1.7 ± 0.3, stroke: 2.5 ± 0.3,]
293 and non-lesioned systems [control: 1.5 ± 0.3, stroke: 2.2 ± 0.2].
294
Symmetry indices
295 There were no significant differences between stroke and control
296 groups in the symmetry indices [p = 0.639,Fig. 5A]. SymIOP-EMG
cor-297 related with SymISM1‐EEG [r = 0.555, p = 0.017] and with SymICMC
298 [r = 0.776, pb0.0011]; SymISM1‐EEG was correlated with SymICMC
299 [r = 0.436, p = 0.05,Fig. 3].
300
Relationship between performance and corticospinal system variables
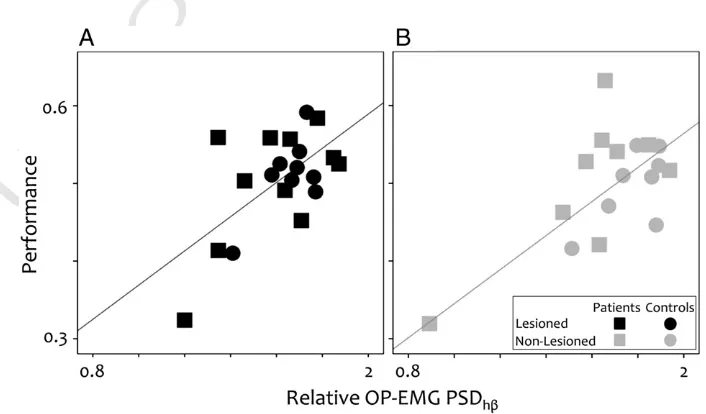
301 Relative OP-EMG power in high beta correlated positively with
302 performance in both the lesioned [p = 0.018, B = 0.21,Fig. 6A] and
303 the non-lesioned systems [p = 0.016, B = 0.26,Fig. 6B]. No interaction
304 between OP-EMG power in high beta and Group was observed
dem-305 onstrating no difference between the stroke patients and controls
306 [p > 0.2].
307
Relationship between corticospinal variables and recovery
308 The recovery index correlated with the SymIOP-EMG[p = 0.023, r =
309 0.706], SymISM1‐EEG [p = 0.048, r = 0.606] and SymICMC [p = 0.023,
310 r = 0.706;Fig. 5B].
311 Discussion
312
Mainfindings and conclusions
313 We began this study with the hypothesis that reorganisation of
314 the corticospinal system after unilateral stroke would be activity
driv-315 en, leading to marked asymmetry between the more active non‐
316 lesioned system and the less active lesioned system in the chronic
317 phase (Tecchio, et al., 2005; van Putten and Tavy, 2004). Whilst we
318 have demonstrated significant differences between the control and
319 stroke groups at the level of the cortex and also at the spinomuscular
320 level, we report for thefirst time that the changes occurred to the
321 same degree and in the same direction in the lesioned and
non-322 lesioned corticospinal systems, and also occurred to the same degree
323 between the different levels of the corticospinal system within each
324 subject. Only the degree of symmetry between the corticospinal
sys-325 tems at the three levels (cortex, spinomuscular and their
connectivi-326 ty) correlated with recovery, assessed using the global NIH score,
327 indicating the potential importance of re-establishing balance
be-328 tween the interdependent networks of the two corticospinal systems
329 for overall motor function.
330
Bilateral increase of low frequency power of the OP-EMG
331 In stroke patients the OP-EMG of both hands had increased power
332 in the lower frequencies (2–7 Hz) compared to controls (Fig. 4). The
333 power spectrum of the surface EMG is determined by the number
334 of active motor units within recording range of the electrodes and
335 their frequency content. There is no evidence of a consistent
Fig. 2.Spectral properties: sensorimotor cortex EEG during rest. Grey lines and sym-bols represent data from the non-lesioned sensorimotor cortex and black lines and symbols represent data from the lesioned sensorimotor cortex in the stroke group (squares) and the control group (circles). Asterisks indicate significant differences be-tween the groups [pb0.050].
UNCORRECTED PR
OOF
336 reduction in the firing rate of motor neurons after stroke337 (Pierrot-Deseilligny and Burke, 2005) to explain a significant shift to 338 lower frequencies. The frequency content of motor unit action
poten-339 tials is related to the musclefibre conduction velocity (Rau, et al., 340 2004). Muscle fibre atrophy from underuse of the affected hand 341 could not explain ourfindings because similar changes were also
ob-342 served in the non-paretic hand, where if anything, over use is likely to
343 have occurred. A shift to lower frequencies in the surface EMG would
344 be predicted from the selective loss of type II musclefibres
demon-345 strated to occur acutely in the paretic hand (Lukács, et al., 2008), 346 since this would lead to larger relative contributions from slow
347 conducting type I motor units. Our observation of a shift to lower
fre-348 quencies in the EMG of both hands would be consistent with a loss in
349 the chronic phase of type II musclefibres also in the non-paretic hand,
350 to match that occurring acutely in the paretic hand.
351 Bilateral decreased power in beta frequencies in the SM1-EEG and in the
352 OP-EMG
353 Stroke patients had reduced power in the beta frequencies in both
354 the sensorimotor cortex EEG and in the OP‐EMG and performance of
355 our task with either hand correlated with the degree of preservation
356 of high beta power in the OP-EMG. The beta frequency has particular
357 relevance to the motor system, since it is optimal for information
358 transfer in large‐scale or widely separated networks, such as those
359 in the corticospinal system (Kopell, et al., 2000). Furthermore, beta
360 frequency resonance occurs in the key neural cortical and subcortical
361 networks for movement control and its power is modulated before
362 and during motor tasks (Murthy and Fetz, 1996; Sanes and
363
Donoghue, 1993; Schalow, 1993; Soteropoulos and Baker, 2006). Bi-364 directional informationflow in corticomuscular coherence occurs in
365 the beta frequency (Meng, et al., 2008) and provides support for the
366 proposal that coherent networks oscillating in the beta frequencies
367 form interconnected loops from the cortex to the periphery and
368 back (Graziadio, et al., 2010; Witham, et al., 2011). In our study
369 there is evidence for detuning (Graziadio, et al., 2010) of information
370 transfer in the corticospinal network after stroke, with a trend
371 towards a greater number of significant CMC peaks in the stroke
372 group during isometric contraction for both the lesioned and
373 non-lesioned system.
374
Bilateral corticospinal system reorganisation and its relationship to
375
recovery
376 Functional MRI studies have previously demonstrated that
377 rebalancing activity between the infarcted and non-infarcted
378 hemispheres in the chronic phase is associated with better recovery
379 after stroke (Calautti, et al., 2010). We are, however, the first to
Fig. 3.Spectral properties: sensorimotor cortex EEG during unilateral contraction. Grey lines and symbols represent data from the non-lesioned sensorimotor cortex and black lines and symbols data from the lesioned sensorimotor cortex in the stroke group (squares) and the control group (circles). Asterisks indicate significant differences between the groups (pb0.050). A. SM1-EEG contra—the hemisphere contralateral to the contracting hand B. SM1-EEG ipsi—the hemisphere ispilateral to the contracting hand.
Fig. 4.Spectral properties: OP-EMG. During unilateral contraction of the hand muscle contralateral to the non lesioned hemisphere (grey lines and symbols) or to the lesioned hemisphere (black lines an symbols) in the stroke group (squares) and the control group (circle).
UNCORRECTED PR
OOF
380 demonstrate that this concept extends also to the corticospinalsys-381 tems, where in the chronic phase after stroke, we have demonstrated
382 re-establishment of the balance in activity both within and between
383 the corticospinal systems, not only at the cortex but also at
384 spinomuscular level, and that this is achieved, at least in part, at the
385 expense of reorganisation of the non-lesioned system.
386 Previous studies have demonstrated significantly marked
asym-387 metry acutely in EEG/MEG power between the lesioned and
388 non-lesioned hemispheres (Tecchio, et al., 2005; van Putten and 389 Tavy, 2004). One of the authors of our current study had previously 390 reported reduced power in the beta frequencies during rest in MEG
391 recorded over the rolandic area in both the acute and chronic phases
392 after stroke (Tecchio, et al., 2005, 2006). In thefirst study of 32 pa-393 tients within one week of stroke, beta power in the lesioned
hemi-394 sphere was significantly lower than in the non lesioned hemisphere
395 (Tecchio, et al., 2005) but in a study of 56 patients who were more 396 than one year after stroke, paired comparison within patients showed
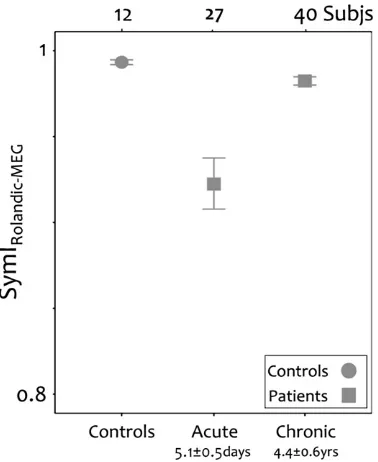
397 no differences in beta power between hemispheres (Tecchio, et al., 398 2006). We calculated a SymI for the MEG power for subjects from 399 both these studies (Tecchio, et al., 2005, 2006) to determine if there 400 was a significant change from the acute period to the chronic period
401 in the symmetry of rolandic area MEG power after stroke. The
pa-402 tients in the chronic phase (Tecchio, et al., 2006) had significantly 403 higher SymIs than those in the acute phase (Tecchio, et al., 2005) 404 [Kolmogorov–Smirnov exact test, pb0.001;Fig. 7]. We considered 405 whether this change could simply occur because those studied
406 chronically (Tecchio, et al., 2006) had less impairment overall than
407 those studied in the acute phase (Tecchio, et al., 2005); however
408 this is unlikely since the patients studied in the chronic phase had
sig-409 nificantly greater impairment acutely [pb0.0001] than those studied
410 in the acute phase, as measured by NIH scores assessed in both
sub-411 ject groups in the period immediately after the stroke.
412 In the present study the only variables correlating with recovery
413 were the symmetry indexes. When reviewing the data ofTecchio et
414
al. (2006)we also found in those subjects a positive relationship be-415 tween the SymI, estimated from rolandic area MEG power and the
re-416 covery index [one-tailed Spearman correlation, p = 0.007, r = 0.385].
417 Complex behaviors emerge through the integration of neural
cir-418 cuits usually comprising bilateral components of the peripheral and
419 central nervous systems. Such neural circuits must maintain stable
420 function in the face of many plastic challenges during learning,
devel-421 opment and aging. Recent work has shown that destabilizing infl
u-422 ences are counterbalanced by homeostatic mechanisms that act to
423 stabilise neuronal and circuit activities (Turrigiano, 2012). Ourfi
nd-424 ings imply that homeostatic plasticity may be induced during
recov-425 ery from focal, unilateral stroke to re-establish balance both within
426 and between the interdependent lesioned and non-lesioned
427 corticospinal systems. Since the degree of global recovery in the
428 chronic phase correlated with the degree symmetry achieved and
429 not with the absolute level of abnormality of the corticospinal
vari-430 ables, this implies that imbalance between the corticospinal systems
431 contributes to the pathophysiology of movement disorders after
Fig. 5.Symmetry indices (SymI). A. Comparison of the symmetry indices in the sensorimotor cortex at rest (SM1-EEG), in the surface EMG recorded over opponens pollicis muscle (OP-EMG) and in the corticomuscular coherence (CMC) between stroke patients (squares) and controls (circles). B. Relationship between recovery and the three symmetry indices.
Fig. 6.Relationship between motor performance and relative OP-EMG power in high beta. The correlation across both the stroke group (squares) and the control group (circles). A. The non-lesioned system. B The lesioned system.
UNCORRECTED PR
OOF
432 stroke. This proposal is supported by previous observations in a
longi-433 tudinal study of middle cerebral artery stroke in neonates where the
434 degree of abnormality in the infarcted corticospinal system acutely
435 was not predictive of outcome but rather the greater the asymmetry
436 between the corticospinal systems at two years, the worse the
437 motor outcome (Eyre, et al., 2007).
438 Could reorganisation of the non-lesioned corticospinal system contribute
439 to ipsilesional upper limb dysfunction?
440 More than 30 years ago the Norwegian neuroanatomist Brodal
ob-441 served that his right sided handwriting was impaired after he
suf-442 fered a right hemisphere stroke (Brodal, 1973). Numerous studies 443 have since demonstrated abnormal ipsilesional upper limb function
444 when performing skilled motor tasks, irrespective of whether the
le-445 sion is cortical or subcortical, and currently there is no consensus on
446 what types of deficit lead to impairment of ipsilateral hand function,
447 independent of the site of the lesion (Nowak, et al., 2007; Winstein 448 and Pohl, 1995). Ourfindings raise the hypothesis that homeostatic 449 plasticity induced during recovery to maintain stability within and
450 between corticospinal systems does so, at least in part, at the expense
451 offine motor function in the ipsilesional arm and hand, by driving
452 reorganisation of the non-lesioned corticospinal system to mirror or
453 balance that of the lesioned system. If our hypothesis is substantiated
454 in longitudinal studies, it would have significant implications since
455 rehabilitation paradigms would need to consider not only benefit to
456 the paretic arm, but also potential benefit or harm induced in the
457 ipsilesional arm and hand.
458 Conflict of interest
459 Graziadio S, Tecchio F, Assenza G, Tomasevic L, Eyre JA report no
460 disclosure.
461 Authorship definition
462 Graziadio S contributed to study design, data analysis and drafting
463 of the manuscript.
464 Tomasevic L contributed to data analysis and revising of the
465 manuscript.
466 Assenza G contributed to revising of the manuscript.
467 Tecchio F contributed to study design, data analysis and drafting of
468 the manuscript.
469 Eyre JA contributed to study design, data analysis and drafting of
470 the manuscript.
471 Role of the funding source
472 The funders of the study had no role in the study design, data
473 collection, analysis and interpretation, writing the paper or in the
de-474 cision of where to publish the paper.
475 Acknowledgments
476 This work was supported by The Wellcome Trust [WT065577MA]
477 and by the European Community's Seventh Framework Programme
478 under grant agreement no. 200859, project MEGMRI and from Italian
479 Ministry of Health Cod. GR-2008-1138642‘Promoting recovery from
480 Stroke: Individually enriched therapeutic intervention in Acute
481 phase’ [ProSIA]. The authors would like to thank TNFP Matilde
482 Ercolani, for the excellent technical support, and to Dr Filippo
483 Zappasodi and Dr Patrizio Pasqualetti for the scientific collaboration.
484 References
485
Brodal, A., 1973. Self observations and neuro-anatomocal considerations after stroke.
486
Brain 96, 675–694.
487
Calautti, C., Leroy, F., Guincestre, J.-Y., Marié, R.-M., Baron, J.-C., 2001. Sequential
activa-488
tion brain mapping after subcortical stroke: changes in hemispheric balance and
489
recovery. Neuroreport 12, 3883–3886.
490
Calautti, C., Jones, P., Naccarato, M., Sharma, N., Day, D., Bullimore, E., Warburton, E.A.,
491
Baron, J.-C., 2010. The relationship between motor deficit and primary motor
492
cortex hemispheric activation balance after stroke: longitudinal fMRI study.
493
J. Neurol. Neurosurg. Psychiatry 81, 788–792.
494
Carmichael, S., 2003. Plasticity of cortical projections after stroke. Neuroscientist 9,
495
64–75.
496
Crone, N., Miglioretti, D., Gordon, B., Lesser, R., 1998. Functional mapping of human
497
sensorimotor cortex with electrocorticographic spectral analysis II: event-related
498
desynchronization in the gamma band. Brain 121, 2301–2315.
499
Di Lazzaro, V., Profice, P., Pilato, F., Capone, F., Ranieri, F., Pasqualetti, P., Colosimo, C.,
500
Pravatà, E., Cianfoni, A., Dileone, M., 2010. Motor cortex plasticity predicts recovery
501
in acute stroke. Cereb. Cortex 20, 1523–1528.
502
Eyre, J., Smith, M., Dabydeen, L., Clowry, G., Petacchi, E., Battini, R., Guzzetta, A., Cioni,
503
G., 2007. Is hemiplegic cerebral palsy equivalent to amblyopia of the corticospinal
504
system? Ann. Neurol. 62, 493–503.
505
Graziadio, S., Basu, A., Zappasodi, F., Tecchio, F., Eyre, J.A., 2010. Developmental tuning
506
and decay in senescence of oscillations linking the corticospinal system.
507
J. Neurosci. 30, 3663–3674.
508
Grefkes, C., Fink, G., 2011. Reorganization of cerebral networks after stroke: new
in-509
sights from neuroimaging with connectivity approaches. Brain 134, 1264–1276.
510
Jouanin, J., Pérès, M., Ducorps, A., Renault, B., 2009. A dynamic network involving
M1-511
S1, SII-insular, medial insular, and cingulate cortices controls muscular activity
512
during an isometric contraction reaction time task. Hum. Brain Mapp. 30, 675–688.
513
Kopell, N., Ermentrout, G., Whittington, M., Traub, R., 2000. Gamma rhythms and beta
514
rhythms have different synchronization properties. Proc. Natl. Acad. Sci. U. S. A. 97,
515
1867–1870.
516
Lukács, M., Vécsei, L., Beniczky, S., 2008. Large motor units are selectively affected
fol-517
lowing a stroke. Clin. Neurophysiol. 119, 2555–2558.
518
Meng, F., Tong, K., Chan, S., Wong, W., Lui, K., Tang, K., Gao, X., Gao, S., 2008. Study on
519
connectivity between coherent central rhythm and electromyographic activities.
520
J. Neural Eng. 5, 324–332.
521
Murthy, V., Fetz, E., 1996. Oscillatory activity in sensorimotor cortex of awake
mon-522
keys: synchronization of local field potentials and relation to behavior.
523
J. Neurophysiol. 76, 3949–3967.
524
Nowak, D., Grefkes, C., Dafotakis, M., Küst, J., Karbe, H., Fink, G., 2007. Dexterity is
im-525
paired at both hands following unilateral subcortical middle cerebral artery stroke.
526
Eur. J. Neurosci. 3173–3184.
527
O'Sullivan, M.C., Miller, S., Ramesh, V., Conway, E., Gilfillan, K., McDonough, S., Eyre, J.A.,
528
1998. Abnormal development of biceps brachii phasic stretch reflex and
persis-529
tence of short latency heteronymous excitatory responses to triceps brachii in
530
spastic cerebral palsy. Brain 121, 2381–2395.
531
Pierrot-Deseilligny, E., Burke, D., 2005. The circuitry of the human spinal cord. Its Role
532
in Motor Control and Movement Disorders. Cambridge University Press,
533
Cambridge.
534
Rau, G., Schulte, E., Disselhorst-Klug, C., 2004. From cell to movement: to what answers
535
does EMG really contribute? J. Electromyogr. Kinesiol. 14, 611–617.
Fig. 7.Symmetry indexes (SymIRolandic-MEG) for additional MEG datasets fromTecchio
et al., 2005, 2006. Comparison of the symmetry indices for the rolandic area at rest be-tween controls and bebe-tween stroke patients during acute (Tecchio, et al., 2005) and chronic phases (Tecchio, et al., 2006) of recovery.
UNCORRECTED PR
OOF
536 Rehme, A., Eickhoff, S., Rottschy, C., Fink, G., Grefkes, C., 2012. Activation likelihoodes-537 timation meta-analysis of motor-related neural activity after stroke. NeuroImage
538 59, 2771–2782.
539 Sanes, J., Donoghue, J., 1993. Oscillations in localfield potentials of the primate motor
540 cortex during voluntary movemen. Proc. Natl. Acad. Sci. 90, 4470–4474. 541 Sanes, J., Donoghue, J., 2000. Plasticity and primary motor cortex. Annu. Rev. Neurosci. 542 23, 393–415.
543 Schalow, G., 1993. Spinal oscillators in man under normal and pathologic conditions. 544 Electromyogr. Clin. Neurophysiol. 33, 409–426.
545 Soteropoulos, D., Baker, S., 2006. Cortico-cerebellar coherence during a precision grip 546 task in the monkey. J. Neurophysiol. 95, 1194–1206.
547 Takeuchi, N., Chuma, T., Matsuo, Y., Watanabe, I., Ikoma, K., 2005. Repetitive
transcra-548 nial magnetic stimulation of contralesional primary motor cortex improves hand
549 function after stroke. Stroke 36, 2681–2686.
550 Tecchio, F., Zappasodi, F., Pasqualetti, P., Tombini, M., Salustri, C., Oliviero, A., Pizzella,
551 V., Vernieri, F., Rossini, P., 2005. Rhythmic brain activity at rest from rolandic
552
areas in acute mono-hemispheric stroke: a magnetoencephalographic study.
553
NeuroImage 28, 72–83.
554
Tecchio, F., Zappasodi, F., Pasqualett, I.P., Tombini, M., Caulo, M., Ercolani, M., PM, R.,
555
2006. Long-term effects of stroke on neuronal rest activity in rolandic cortical
556
areas. J. Neurosci. Res. 83, 1077–1087.
557
Terry, K., Griffin, L., 2008. How computational technique and spike train properties
558
affect coherence detection. J. Neurosci. Methods 168, 212–223.
559
Turrigiano, G., 2012. Homeostatic synaptic plasticity: local and global mechanisms for
560
stabilizing neuronal function. Cold Spring Harb. Perspect. Biol. 4, a005736.
561
van Putten, M., Tavy, D., 2004. Continuous quantitative EEG monitoring in hemispheric
562
stroke patients using the brain symmetry index. Stroke 35, 2489–2492.
563
Winstein, C., Pohl, P., 1995. Effects of unilateral brain damage on the control of
goal-564
directed hand movements. Exp. Brain Res. 105, 163–174.
565
Witham, C., Riddle, C., Baker, M., Baker, S., 2011. Contributions of descending and
566
ascending pathways to corticomuscular coherence in humans. J. Physiol. 589,
567
3789–3800.
568
569