The Importance of Sustainability Reports In Non-Financial
Companies
Caturida Meiwanto Doktoralina1, Dewi Anggraini2, Safira3,Shinta Melzatia4 Faculty of Economics and Business,2,3
Universitas Mercu Buana, Jakarta, Indonesia1,2,3
Salimah Yahaya5
Centre For Islamic Development Studies (ISDEV) Universiti Sains Malaysia, Pulau Pinang, Malaysia
[email protected]; [email protected]; [email protected]; [email protected]
Abstract: The sustainability report (SR) has become a necessity for companies. Its role is crucial for the development of a company because it includes both social and environmental aspects. However, there are still companies that have not properly conducted sustainability report disclosures (SRDs). Therefore, this study aims to examine the effects of profitability, leverage and liquidity on SRDs. In particular, we explore the implications of regulations that require the disclosure of environmental and social information in non-financial companies listed on the Indonesia Stock Exchange (IDX) in 2013-2017. The sample in this study was 65 from 13 companies that met the criteria, and the study utilised the purposive sampling method. The study results found that first, profitability proxied by return on assets (ROA) did not significantly influence SRDs. Second, leverage proxied by debt to assets ratio (DAR) has a significant negative effect on SRDs, and third, the liquidity proxied by the current ratio (CR) has a significant negative effect on SRDs. The results of this study are expected to increase knowledge for readers, especially investors, so they can pay better attention to a company's social and environmental activities when investing.
Keywords: return on assets, debt assets to ratio, current ratio, sustainability report
BACKGROUND
responsibility into business operations (Frias-Aceituno, Rodríguez-Ariza, and Garcia-Sánchez, 2014). Moreover, increasing business competition requires management to employ strategic thinking to obtain additional capital from sources other than investors (Grant, 2016).
Generally, investors are interested in the additional information included in annual reports, information on environmental, social and political responsibilities that is disclosed separately (Saeidi et al., 2015). Stakeholder theory states that a company is responsible for expanding organisational responsibilities beyond investors/owners to parties outside the company (Donaldson and Preston, 1995). Therefore, to ensure a commitment to building a sustainable economy and to improving the quality of life and the environment, Indonesia regulates such activities in Law Number 40 Article 1 of 2007. Additionally, the government requires that companies which utilise geothermal energy must fulfil their social responsibilities through the development of the surrounding community, per Law No. 21 of 2014, Article 65 paragraph 2.
However, in reality, not all companies in Indonesia abide by the established regulations. This is seen in the case of environmental damage in 2017 that allegedly damaged a mangrove forest covering an area of 1,232 ha and oil spills that harmed coral reefs in the province of Nusa Tenggara Timur (http://www.liputan6.com). For those reasons, Du, (2015); Liu, Pan, and Tian (2018) report that sustainable performance is mandatory for balancing the aspects of people, planet and profit (the triple bottom line–
social, environmental and financial), as well as global issues in society. Accordingly, the summation of social activities in sustainability reports (SRs) possesses essential values for long-term success, survival and organisational growth (Lozano & Huisingh, 2011; Peloza, Loock, Cerruti, & Muyot, 2012).
The Global Reporting Initiative (GRI) conveys the importance of SR publications in European countries, but in Indonesia, they are still voluntary. Therefore, the government of Indonesia encourages the publication of SRs by giving awards to the companies implementing them, thus far resulting in 120 companies doing so (Simbolon, J. and Sueb, 2016). This shows that companies in Indonesia hold concerns related to their impact in the economic, environmental and social fields. The relationship of a company in meeting the interests of stakeholders characterises stakeholder theory. But as for the explanation of norms in its operational environment, the application of legitimacy theory results in better tendencies.
The better tendency is generally that high profitability can become public information communicating the advantages of one company in comparison to other companies. Moreover, a company's liquidity level illustrates its ability to pay short-term obligations on time (Antonio Dias, 2017). Therefore, with an increasing number of companies disclosing sustainability reports, a company's marketing strategy for improving financial performance (profitability, liquidity, solvency and earnings per share) is expected to fare better.
Research on SR disclosure (SRD) is still a study trend in various countries, including
Indonesia, because such studies show that SRs influence a company’s liquidity,
questions. First, does the level of profitability of a company affect SRD in public companies listed on the Indonesia Stock Exchange (IDX)? Second, does the level of corporate leverage affect SRD for public companies listed on the IDX? Third, does the level of corporate liquidity affect SRD?
THEORETICAL REVIEW
Stakeholder Theory. Stakeholder theory aims to help management understand the stakeholder environment for managing a more effective company (Ulum, 2015). This theory asserts that companies must direct the fulfilment of stakeholder expectations. The possibility of not implementing stakeholder management will reap protests that can eliminate stakeholder legitimacy (Hadi, 2011). Therefore, this theory is widely used in the underlying research on SRs (Epstein, 2018; Hill, Jones, & Schilling, 2014). The basis of this theory also refers to signalling theory, about which Brealey, Leland, and Pyle, (1977); Ross, (1977) stated: Information on corporate value conveyed by managers to potential investors or external parties could increase the value of the company through annual report signals.
Legitimacy Theory. Legitimacy theory states that organisations continually seek ways to guarantee operations and to analyse the behaviour of their organisations within the limits of the norms prevailing in society (Dowling and Pfeffer, 1975). Society can provide companies with benefits that are potential resources necessary for them to maintain a going concern (Deegan, 2014; Hummel & Schlick, 2016; O’Donovan, 2002). Therefore, this social disclosure practice is seen as a form of influential public accountability in explaining social and environmental impacts. This supports Brown and Deegan, (1998); Deegan and Rankin, (1996), which state that a company must strive to ensure the existence of the community and the local environment.
Regulatory Theory. This theory is used because regulation occurs as a reaction to a crisis that cannot be identified (Robles Jr, 2016). It requires rules or provisions in accounting that are considered necessary. The aim is that such regulations create a brotherhood between the political forces of executive-led interest groups and the legislature (Stigler, 1971). Thus, the role of the government as a regulator must maintain and deliver an informational balance. The government can pressure companies to run their businesses without damaging the environment by setting regulations that force them to live up to their social responsibilities. All the theories above are used since they encompass every study and linkages in decision making aimed at the interests of this study.
In addition, with a high level of leverage (a large proportion of debt compared to assets), companies will, in general, reduce costs, including the cost of social activities disclosed in SRs (Admati, Demarzo, Hellwig, and Pfleiderer, 2018; Haningsih, Zulkifli, and Doktoralina, 2014). Furthermore, high leverage and costs can cause a company to delay publishing SRs and voluntarily reporting disclosures (Martínez-Ferrero, Garcia-Sanchez, and Cuadrado-Ballesteros, 2013).
We next consider an understanding of the liquidity ratio as a measure of the company's ability to pay and meet short-term obligations (Fazzini, 2018). Fundamentally, a company understands that a high level of liquidity means that management has succeeded in building a positive impression in the company. Therefore, it enables them to gain the trust of stakeholders, who will then have a tendency to always support management decisions (Adhipradana & Daljono, 2014). The positive impression that was built means that, in general, management would disclose information on activities that fulfil social responsibilities in the SR (Adhipradana & Daljono, 2014; Brigham & Houston, 2012; Candri & Puspita, 2015; Marwati & Yulianti, 2015; Muallifin & Priyadi, 2016).Based on the above, the hypotheses in this study are as follows:
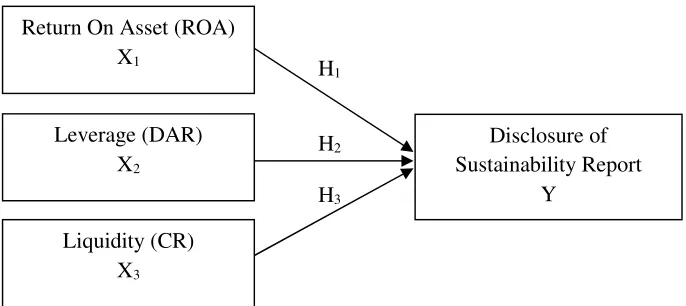
H1: Profitability affects SRD.
H2: Leverage affects SRD.
H3: Liquidity affects SRD.
Figure 1.The Theoretical Model
METHOD
Research design. This research was conducted in 2018. The type of data used is secondary data obtained from the annual reports of non-financial companies listed on the IDX from 2013 to 2017 and company data sources that reveal the SR from each company's website. The study employs causal methods. The aim is to test the hypotheses for the effects of one or more independent variables on the dependent variable (Creswell & Creswell, 2017). The independent variables referred to are return on assets (ROA), leverage as measured by debt to assets ratio (DAR), and liquidity as measured by current ratio (CR) of SRD.
Return On Asset (ROA) X1
Leverage (DAR) X2
Liquidity (CR) X3
Disclosure of Sustainability Report
Y H1
H2
Data and research samples. The sample of this study is derived from companies that consistently published annual and sustainability reports from 2013 to 2017, as shown in Table 1.
Table 1.Research Sample
Criteria Amount
Non-financial companies listed on the stock exchange from 2013 to 2017 269 Companies that inconsistently published sustainability report from 2013 to
2017 (100)
Companies that inconsistently participated in the Indonesia Sustainability
Report Awards at least three times during the period 2013 to 2017 (150) Companies that recognized losses during 2013 to 2017 (6)
Number of sample companies 13
Research Year 5
Number of Samples 65
Sample selection is based on a purposive sampling method with the aim of obtaining a representative sample under the specified criteria, namely, (1) non-financial companies listed on the IDX from 2013 until 2017, (2) companies that publish separate SRs which can be accessed on the company's official website and that received Indonesia Sustainability Report Awards three times during the 2013-2017 period and (3) the company had no losses during the study period, as shown in Table 2.
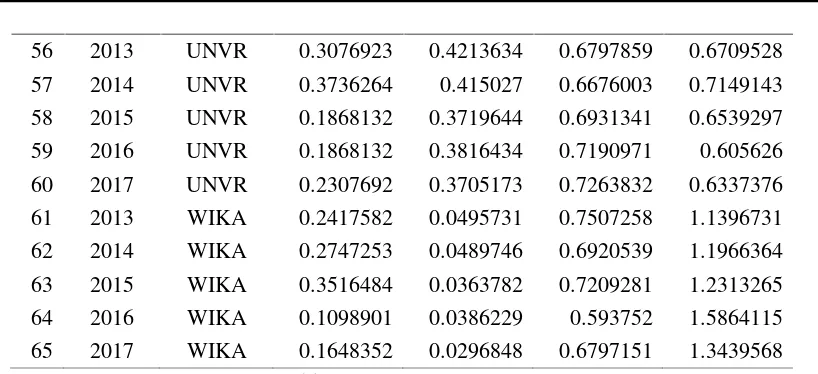
Table 2.The Companies Sampled and Tabulation
Nr. Years Company
Code SR (Y) ROA (X1) DAR (X2) CR (X3)
1 2013 ADHI 0.4065934 0.0422191 0.8498085 1.3275114
2 2014 ADHI 0.1978022 0.0317109 0.8431208 1.3018592
3 2015 ADHI 0.2417582 0.0524283 0.6920164 1.5604877
4 2016 ADHI 0.1978022 0.0201948 0.7283729 1.2930442
5 2017 ADHI 0.2747253 0.0185148 0.7928236 1.4074329
6 2013 ASII 0.2857143 0.1107882 0.5037805 1.2419629
7 2014 ASII 0.2527473 0.0938749 0.4907913 1.3098019
8 2015 ASII 0.2527473 0.0670402 0.4844541 1.3793054
9 2016 ASII 0.2857143 0.0756296 0.4657119 1.239383
10 2017 ASII 0.3186813 0.0765645 0.4712291 1.2286319
11 2013 ASRI 0.3296703 0.0616559 0.6304578 0.7529929
12 2014 ASRI 0.2747253 0.069542 0.6223673 1.1373406
13 2015 ASRI 0.2527473 0.0366911 0.6471162 0.7192381
14 2016 ASRI 0.2307692 0.0257924 0.6439216 0.8975276
15 2017 ASRI 0.3076923 0.0664763 0.5864283 0.7373862
17 2014 GGRM 0.3076923 0.0928274 0.4310155 1.6201649
18 2015 GGRM 0.3406593 0.1013402 0.4015013 1.7703589
19 2016 GGRM 0.3186813 0.1060669 0.3715139 1.9378907
20 2017 GGRM 0.2967033 0.1161422 0.3680691 1.9355362 21 2013 HMSP 0.3076923 0.3947455 0.4834884 1.7525569
22 2014 HMSP 0.2967033 0.3587259 0.5244001 1.5277941
23 2015 HMSP 0.2857143 0.2726316 0.1577175 6.5668649
24 2016 HMSP 0.2747253 0.3002258 0.1960337 5.2344431
25 2017 HMSP 0.3296703 0.2937113 0.2092673 5.2722505
26 2013 ICBP 0.3296703 0.1030065 0.4026707 2.4106162
27 2014 ICBP 0.3846154 0.1016161 0.4173156 2.194214
28 2015 ICBP 0.3626374 0.1138943 0.3830373 2.326025
29 2016 ICBP 0.2527473 0.1257772 0.3598795 2.4067823
30 2017 ICBP 0.3956044 0.1116779 0.3572226 2.4282764
31 2013 JSMR 0.3406593 0.0330743 0.623708 0.7614702
32 2014 JSMR 0.2967033 0.037037 0.6540804 0.8244074
33 2015 JSMR 0.2747253 0.0354527 0.6631995 0.4815533
34 2016 JSMR 0.2307692 0.0314766 0.6945981 0.6960322
35 2017 JSMR 0.3296703 0.0237521 0.7681613 0.7595452
36 2013 SIMP 0.3186813 0.0366806 0.4406526 0.8285885
37 2014 SIMP 0.3076923 0.0363351 0.4705091 0.8712354
38 2015 SIMP 0.2967033 0.0166958 0.4563737 0.9357801
39 2016 SIMP 0.2857143 0.0174632 0.4585251 1.246773
40 2017 SIMP 0.2307692 0.016689 0.4556289 1.0164562
41 2013 SMGR 0.3956044 0.1897968 0.2945413 1.8823854
42 2014 SMGR 0.5274725 0.1643473 0.2716659 2.2095409
43 2015 SMGR 0.5274725 0.1221961 0.2807718 1.5969693
44 2016 SMGR 0.3076923 0.0987712 0.3086923 1.272519
45 2017 SMGR 0.2857143 0.0348748 0.3783318 1.5677513
46 2013 TLKM 0.3846154 0.1578313 0.4032049 1.1630974
47 2014 TLKM 0.3736264 0.1500049 0.3936625 1.0611424
48 2015 TLKM 0.2967033 0.1403176 0.4377667 1.3529495
49 2016 TLKM 0.4175824 0.1624177 0.4123745 1.199663
50 2017 TLKM 0.4395604 0.1647538 0.4350678 1.0481532
51 2013 UNTR 0.3516484 0.0836574 0.3785303 1.7018323
52 2014 UNTR 0.4065934 0.0801245 0.3611059 1.6516789
53 2015 UNTR 0.3736264 0.045247 0.3640108 1.5481137
54 2016 UNTR 0.3516484 0.0797684 0.3339409 1.5987116
56 2013 UNVR 0.3076923 0.4213634 0.6797859 0.6709528
57 2014 UNVR 0.3736264 0.415027 0.6676003 0.7149143
58 2015 UNVR 0.1868132 0.3719644 0.6931341 0.6539297
59 2016 UNVR 0.1868132 0.3816434 0.7190971 0.605626 60 2017 UNVR 0.2307692 0.3705173 0.7263832 0.6337376
61 2013 WIKA 0.2417582 0.0495731 0.7507258 1.1396731
62 2014 WIKA 0.2747253 0.0489746 0.6920539 1.1966364
63 2015 WIKA 0.3516484 0.0363782 0.7209281 1.2313265
64 2016 WIKA 0.1098901 0.0386229 0.593752 1.5864115
65 2017 WIKA 0.1648352 0.0296848 0.6797151 1.3439568 Source: Data was processed by SPSS 23.
Operational Variable. Operational variables and the measurement scale of this study use two types of variables, as shown in Table 3.
Table 3.Operational Variables and Measurement Scale
Variable Definitions Measurement
Dependent variable
The dependent variable in this study is SRD based on the Global Reporting Initiative (GRI-G4), shown in Table
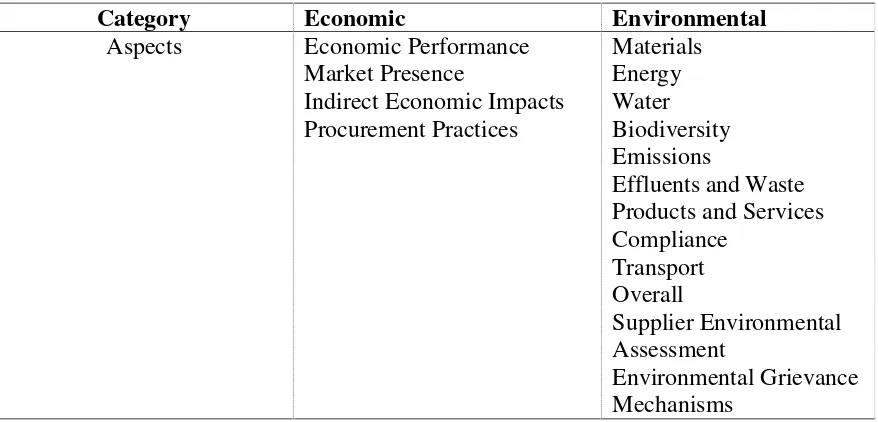
4.1-4.3 There were 91 total items of disclosure: 9
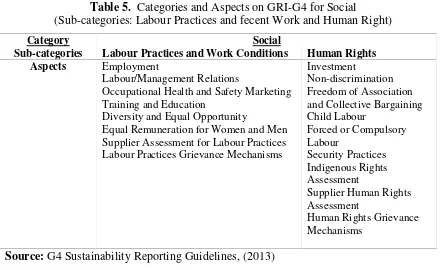
items disclosing economic aspects, 34 items disclosing environmental aspects, 12 items disclosing aspects of human rights, 16 items disclosing aspects of employment practices and work comfort, 9 items disclosing aspects of product responsibility, and 11 items disclosing the aspect of society.
Independent Variables
The independent variables used are profitability, leverage and liquidity.
Return On Assets (X1)
The justification for using profitability is that this ratio can provide a measure of a
company management’s effectiveness, as
well as in measuring the level of a
company’s profitability. Moreover, ROA is
to seek profits (Roy and Das, 2017).
Debt to Asset Ratio (X2)
Leverage justification is employed because leverage is equivalent to DAR, one of the ratios used by companies in assessing how much of a company's assets are financed with debt or by outsiders (Roy and Das, 2017).
Current Ratio (X3)
The use of liquidity justification equals CR because CR is used by companies in measuring the level of company liquidity, as well as for measuring a company's ability to pay and meet its short-term obligations (Roy and Das, 2017).
An explanation for GRI-G4 is given in Table 4-6:
Table 4. Categories and Aspects of GRI-G4 For Economic & Environmental
Category Economic Environmental
Aspects Economic Performance Market Presence
Indirect Economic Impacts Procurement Practices
Materials Energy Water Biodiversity Emissions
Effluents and Waste Products and Services Compliance
Transport Overall
Supplier Environmental Assessment
Environmental Grievance Mechanisms
Table 5. Categories and Aspects on GRI-G4 for Social
(Sub-categories: Labour Practices and fecent Work and Human Right)
Category Social
Sub-categories Labour Practices and Work Conditions Human Rights
Aspects Employment
Labour/Management Relations
Occupational Health and Safety Marketing Training and Education
Diversity and Equal Opportunity
Equal Remuneration for Women and Men Supplier Assessment for Labour Practices
Source:G4 Sustainability Reporting Guidelines, (2013)
Table 6. Categories and Aspects of GRI-G4 For Social (Sub-categories: Society and Product Responsibility)
Source:G4 Sustainability Reporting Guidelines, (2013)
Data Analysis Methods.The methods of analysis data used include descriptive analysis, a classical assumption test and hypothesis testing using multiple linear regression equations (Brooks, 2014; Gujarati, 2011). Regression analysis is mostly about dependent variables with one or more independent variables, with the purpose of estimating and/or predicting the average population or the mean value of the dependent variable based on the known independent value. Multiple linear regression equations in this research utilise the following model:
SDRs = α + β₁ROAβX1+β2DAR βX2+β3CR βX3+ e.
Descriptive Test. Based on the results, the descriptive statistics shown in Table 5 were obtained.
Table 7.Descriptive Statistics
N Minimum Maximum Mean Std. Deviation
SR 65 .1191 .53 .3085 .07614
ROA 65 .0166 .42 .1191 .11272
DAR 65 .1577 .85 .5080 .16784
CR 65 .4815 6.57 1.5238 1.05123
Source: Data was processed by SPSS 23.
1. The SRDs summarised in 91 indicators set by the Global Reporting Initiative have an average value of 0.3085, a minimum value of 0.1098 reported by PT. Wijaya Karya in 2016 and a maximum value of 0.5274 obtained by PT. Semen Indonesia in 2015, as well as a standard deviation of 0.0761.
2. Profitability has an average value of 0.1191, a minimum value of 0.0166 reported by PT. Salim Ivomas Pratama in 2017, a maximum value of 0.4213 obtained by PT. Unilever in 2013, and a standard deviation of 0.1127.
3. Leverage (DAR) has an average value of 0.5080, a minimum value of 0.1577 reported by PT. HM Sampoerna in 2015, a maximum value of 0.8498 disclosed by PT. Adhi Karya in 2013, and a standard deviation of 0.1678.
4. Liquidity (CR) has an average value of 1.5238, a minimum value of 0.4815 reported by PT. Jasa Marga in 2015 and a maximum value of 6,566 disclosed by PT. HM. Sampoerna in 2015, and a standard deviation of 1.0512.
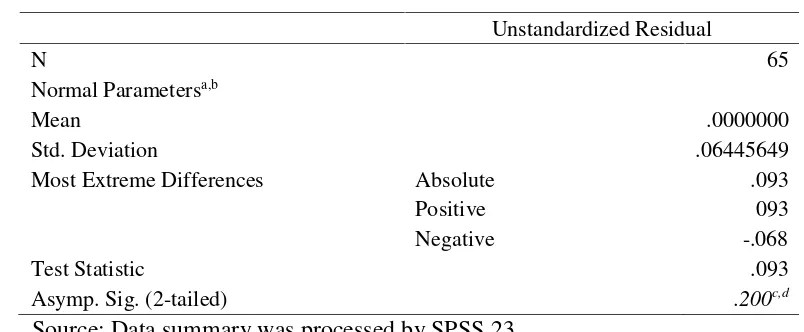
Classic assumption test. The classic assumption test (Kolmogorov-Smirnov test shown in Table 6) results showed asymptotic values, a significance of 0.200 or >0.05. This proves that the research data is normally distributed and can be used to conduct regression analysis.
Table 8.One-Sample Kolmogorov-Smirnov Test
Unstandardized Residual
N 65
Normal Parametersa,b
Mean .0000000
Std. Deviation .06445649
Most Extreme Differences Absolute .093
Positive 093
Negative -.068
Test Statistic .093
Asymp. Sig. (2-tailed) .200c,d
Source: Data summary was processed by SPSS 23.
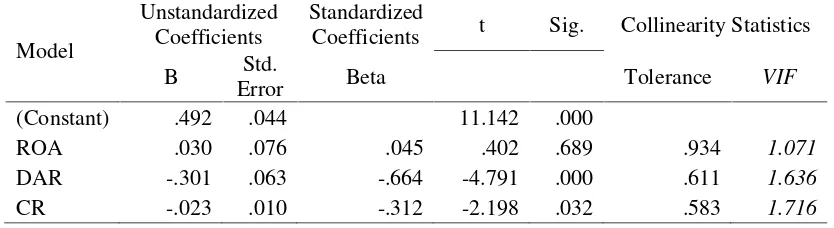
no multicollinearity between the variables in this regression model.
Table 9.Results of the Multicollinearity Test
Model
ROA .030 .076 .045 .402 .689 .934 1.071
DAR -.301 .063 -.664 -4.791 .000 .611 1.636
CR -.023 .010 -.312 -2.198 .032 .583 1.716
Source: Data summary was processed by SPSS 23.
The third-step test is an autocorrelation test (Table 10). Its results show that the value of Durbin-Watson (d) is 1.524, where the value (du) is 1.50349 and the value (dl) is 1.69602. The results of the DW value are located between 1.50349 <1.524 <1.69602, meaning there is no positive or negative autocorrelation.
Table 10.Results of the Autocorrelation Test
Model R R
1 .532a .283 .248 .0660225 1.524
Source: Data summary was processed by SPSS 23.
The fourth step is the heteroscedasticity test (Table 9), the results of which show that the significance value of the three independent variables is more than 0.05. It can thus be concluded that there is no heteroscedasticity in the regression model.
Table 11.Heteroscedasticity Test
ROA .003 .049 .008 .059 .953
DAR .020 .041 .081 .500 .619
CR -.001 .007 -.026 -.153 .879
Source: Data summary was processed by SPSS 23.
Hypotheses testing. The hypotheses testing was done in three stages. The first test takes into account the results of the value of the coefficient of determination (R2) in Table 10, adjusted R square (R2) that is equal to 0.248 (24.8%). The test results mean that the
Table 12.Summary of Hypotheses Tests
Model R R Square Adjusted R Square Std. Error of the Estimate
1 .532a .283 .248 .0660225
Source: Data summary was processed by SPSS 23.
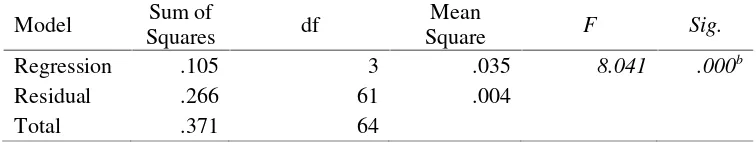
The second test conducted was a simultaneous significance test (the F-test shown in Table 11). The F-test determined that the F-value was 8.041 with a significance value of 0.000, which is smaller than 0.05. It can thus be concluded that the variables of profitability, leverage and liquidity simultaneously or jointly influence SRD.
Table 13.Simultaneous Significance Test (F- Test)
Model Sum of
Squares df
Mean
Square F Sig.
Regression .105 3 .035 8.041 .000b
Residual .266 61 .004
Total .371 64
Source: Data summary was processed by SPSS 23.
The third test was a partial significance test (the t-test shown in Table 12). The results of the t-test indicate that profitability (ROA) has a count value of 0.402 with a significance level of 0.689, which is greater than 0.05. This shows that profitability does not have an insignificant effect on SRD, so Hypothesis 1 (H1) is rejected. Furthermore,
leverage (DAR) has a t-value of -4.779 with a significance level of 0.000, which is less than 0.05. This shows that leverage has a negative and significant effect on SRD, so Hypothesis 2 (H2) is accepted. The liquidity (CR) has a t-count value of -2.198 with a
significance level of 0.032, which means smaller than 0.05. This shows that liquidity has a negative and significant influence on SRD, so Hypothesis 3 (H3) is accepted.
Table 14.Result of T-test
Model
Unstandardized Coefficients
Standardized
Coefficients t Sig.
B Std. Error Beta
(Constant) .492 .044 11.142 .000
ROA .030 .076 .045 .402 .689
DAR -.301 .063 -.664 -4.791 .000
CR -.023 .010 -.312 -2.198 .032
Source: Data summary was processed by SPSS 23.
has a 1% increase, then SRDs will increase by 0.03. In connection with leverage (DAR), which is equal to -0.301, if other independent variables have a fixed value and DAR has a 1% increase, then SRDs will decrease by 0.301. As for the liquidity regression coefficient (CR) of -0.023, it shows that if another independent variable is fixed in value and CR has a 1% increase, SRDs will decrease by 0.023. For this reason, the regression equation for testing the statistical research is as follows: SRDs = 0.492α + 0.03ROAβX1 -0.301DAR
βX2-0.023CR βX3.
Information:SRDs : Sustainability Report Disclosure;ROA (X1) : Profitability
(Return on Assets); DAR (X2): Leverage (Debt to Assets Ratio); CR (X3) : Liquidity
(Current Ratio);α: Constants;β: Coefficient;ε: Error
DISCUSSION
Profitability proxied by ROA does not affect SRD. This shows that the level of company profitability does not directly affect the SRD at that time. This is also possible whether the ROA is large or small; it is affected by the profit after tax that comes from sales. SRD does not always have an impact on increasing sales. This may occur because SRD does not affect stakeholder decisions (for example,consumers’sales activities).
When profitability is high, companies tend not to report SDR because of increasing company costs. In reaction to a decrease in profits, companies will reduce social activity and focus on increasing profits, thus causing less social and environmental information to be disclosed. This does not support stakeholder theory, which states that all stakeholders have the right to be given information about how organizational activities affect them because the company’s survival is strongly influenced by the support provided by stakeholders.
SRD is carried out in the context of accountability to stakeholders to maintain their support and to fulfil their information needs. In addition, companies with high ROA values do not necessarily conduct SRDs because in Indonesia they are still voluntary and there is no good control mechanism from the government.
Leverage proxied by DAR has a negative and significant influence on SRD. This shows that the DAR value directly affects the SRD at that time. Thus, the greater leverage the company has, the less likely the company will disclose and vice versa; if the leverage level of a company is small, the greater the probability the company will report SRDs. The same thing is obtained from the results of the Liquidity Effect (CR) on Sustainability Report Disclosures. Liquidity proxied by CR has a negative and significant influence on SRD. This shows that the CR value directly affects the SDR at that time. Thus, the greater the liquidity has, the less likely the company will disclose and vice versa; if the liquidity of a company is small, the greater the probability the company will report SRDs. The other reason is that companies with high leverage tend to want to report higher profits that will reflect the company's stable financial condition assist in raising capital. To achieve high profits, companies will reduce costs, including the costs of SRDs.
could examine other variables, e.g. SRD potential, different sized companies, and company value, and increase the number of samples to obtain more comprehensive results. The government is firm in enforcing the law regarding companies that do not implement SRDs. One thing that can be done is to establish a sustainable performance assessment system that is standardised in a company's licensing rules and annually evaluate the performance of a company’s social environment activities. Thus, the implications of this study’s results cannot be a single reference for interested parties due to
the limitations of the research sample. Variations in company policy must also be considered in behavioural research linked to a company's SRD compliance.
CONCLUSION
Based on the results of hypotheses testing on the three independent variables, only ROA does not affect SDR. The other two variables, DAR and CR, have an effect on SDR, but in the opposite direction, which means that companies with high leverage and liquidity often fail to report SRDs. The author recommends that further research test other profitability factors, namely ROI and ROE. In addition, a greater number of samples and years could be examined. This reveals that company management appears not to be focused on social and environmental activities and requires further studies regarding variables that support the government's intent.
REFERENCES
Adhipradana, F., & Daljono, D. (2014). “Pengaruh Kinerja Keuangan, Ukuran Perusahaan, dan Coporate Governance Terhadap Pengungkapan Sustainability Report”.Diponegoro Journal of Accounting, 3(1), 80–91.
Admati, A. R., Demarzo, P. M., Hellwig, M. F., & Pfleiderer, P. (2018).”The Leverage Ratchet Effect”.Journal of Finance, 73(1), 145–198.
http://doi.org/10.1111/jofi.12588
Brealey, R., Leland, H. E., & Pyle, D. H. (1977). “Informational asymmetries, financial structure, and financial intermediation”.The Journal of Finance,32(2), 371–387. Brigham, E. F., & Houston, J. F. (2012).Fundamentals of financial management. Cengage
Learning.
Brooks, C. (2014).Introductory econometrics for finance. Cambridge University Press. Brown, N., & Deegan, C. (1998). “The public disclosure of environmental performance
information—a dual test of media agenda setting theory and legitimacy theory”.
Accounting and Business Research, 29(1), 21–41.
http://doi.org/10.1080/00014788.1998.9729564
Candri, Puspita, Y. (2015). “Analisis Pengungkapan Sustainability Report Pada Perusahaan Non Keuangan 2009-2013”.Jurnal Dinamika Akuntansi,7(Semarang). Creswell, J. W., & Creswell, J. D. (2017).Research Design: Qualitative, Quantitative and
Mixed Method Approaches.SAGE Publications. United Kingdom: SAGE Publications Ltd. http://doi.org/10.4135/9781849208956
Deegan, C., & Rankin, M. (1996). “Do Australian companies report environmental news objectively?: An analysis of environmental disclosures by firms prosecuted successfully by the Environmental Protection Authority”. Accounting, Auditing & Accountability Journal, 9(2), 50–67. http://doi.org/10.1108/09513579610116358. Dias, A. (2017). “Corporate Governance Effects on Social Responsibility Disclosures”.
Australasian Accounting, Business and Finance Journal, 11(2), 3–22. http://doi.org/10.14453/aabfj.v11i2.2
Dias, A., Rodrigues, L. L., & Craig, R. (2017). “Corporate governance effects on social responsibility disclosures”.Australasian Accounting Business and Finance Journal, 11(2), 1–22.
Donaldson, T., & Preston, L. E. (1995). “The stakeholder theory of the corporation: Concepts, evidence, and implications”.Academy of Management Review, 20(1), 65–
91.
Dowling, J., & Pfeffer, J. (1975). “Organizational legitimacy: Social values and organizational behaviour”.Pacific Sociological Review, 18(1), 122–136.
Du, X. (2015).“How the market values greenwashing? Evidence from China”.Journal of Business Ethics, 128(3), 547–574.
Epstein, M. J. (2018). Making sustainability work: Best practices in managing and measuring corporate social, environmental and economic impacts. Routledge.
Fazzini, M. (2018). Financial Statement Analysis. In Business Valuation (pp. 39–76). Springer.
Frias-Aceituno, J. V, Rodríguez-Ariza, L., & Garcia-Sánchez, I. M. (2014). “Explanatory Factors of Integrated Sustainability and Financial Reporting”.Business Strategy and the Environment, 23(1), 56–72. http://doi.org/10.1002/bse.1765
Grant, R. M. (2016).Contemporary strategy analysis: Text and Cases(Ninth Edit). United Kingdom: John Wiley & Sons.
Gujarati, D. N. (2011).Econometrics by example. Palgrave Macmillan.
Gunawan, A., & Wahyuni, S. F. (2013). Pengaruh Rasio Keuangan terhadap Pertumbuhan Laba pada Perusahaan Perdagangan di Indonesia. Jurnal Manajemen Dan Bisnis, 13(01), 63–84. http://doi.org/10.2527/jas2012-5761
Hadi, N. (2011).Corporate Social Responsibility. Yogyakarta: Graha Ilmu.
Hill, C. W. L., Jones, G. R., & Schilling, M. A. (2014).Strategic management: theory: an integrated approach. Cengage Learning.
Haningsih, L., Zulkifli, Z., & Doktoralina, C. M. (2014). ”Pengaruh Total Asset Turn Over, Return on Asset dan Return on Equity Terhadap Accumulation Distribution Line”.Jurnal Akuntansi, XVIII(03), 438–458.
Hummel, K., & Schlick, C. (2016). The relationship between sustainability performance and sustainability disclosure--Reconciling voluntary disclosure theory and legitimacy theory.Journal of Accounting and Public Policy,35(5), 455–476.
Ioannou, I., & Serafeim, G. (2017). The consequences of mandatory corporate sustainability reporting.
Kitzmueller, M., & Shimshack, J. (2010). “Economic Perspectives on Corporate Social Responsibility”. Journal of Economic Literature, 50(April), 51–84. http://doi.org/10.2870/16517
Liu, Q., Pan, X., & Tian, G. G. (2018). “To what extent did the economic stimulus package influence bank lending and corporate investment decisions? Evidence from China”. Journal of Banking and Finance, 86, 177–193. http://doi.org/10.1016/j.jbankfin.2016.04.022
Lozano, R., & Huisingh, D. (2011). “Inter-linking issues and dimensions in sustainability reporting”.Journal of Cleaner Production,19(2), 99–107.
Martínez-Ferrero, J., Garcia-Sanchez, I. M., & Cuadrado-Ballesteros, B. (2013).“Effect of Financial Reporting Quality on Sustainability Information Disclosure”. Corporate Social Responsibility and Environmental Management, 22(1), 45–64. http://doi.org/10.1002/csr.1330
Marwati, C. P., & Yulianti, Y. (2015). ”Analisis Pengungkapan Sustainability Report pada Perusahaan Non-Keuangan Tahun 2009-2013”.Jurnal Dinamika Akuntansi, 7(2). Means, G. (2017).The modern corporation and private property(2nd Edition). New York
City, USA: Routledge.
Muallifin, O. R., & Priyadi, M. P. (2016). “Dampak Pengungkapan Sustainability Report Terhadap Kinerja Keuangan dan Kinerja Pasar”.Jurnal Ilmu Dan Riser Akuntansi,5.
O’Donovan, G. (2002). “Environmental disclosures in the annual report: Extending the applicability and predictive power of legitimacy theory”. Accounting, Auditing & Accountability Journal, 15(3), 344–371.
Peloza, J., Loock, M., Cerruti, J., & Muyot, M. (2012). “Sustainability: How stakeholder perceptions differ from corporate reality”. California Management Review, 55(1), 74–97.
Robles Jr, A. C. (2016).French theories of regulation and conceptions of the international division of labour. Springer.
Ross, S. A. (1977). “The determination of financial structure: the incentive-signalling approach”.The Bell Journal of Economics, 23–40.
Roy, M., & Das, A. (2017). “Relative and Incremental Explanatory Power of Economic Value Added over Traditional Profitability Measures in Explaining Stock Returns: Evidence from Indian NSE Listed Pharmaceutical Companies”. Research Bulletin, 42(4), 139–153.
Saeidi, S. P., Sofian, S., Saeidi, P., Saeidi, S. P., & Saaeidi, S. A. (2015). “How does corporate social responsibility contribute to firm financial performance? The mediating role of competitive advantage, reputation, and customer satisfaction”. Journal of Business Research,68(2), 341–350.
Sejati, B. P., & Prastiwi, A. (2015). “Pengaruh Pengungkapan Sustainability Report terhadap Kinerja dan Nilai Perusahaan”. Diponegoro Journal of Accounting, 4(1), 195–206.
Simbolon, J., & Sueb, M. (2016).“Pengaruh Pengungkapan Sustainability Report terhadap Kinerja Keuangan Perusahaan (Studi Empiris pada Perusahaan Tambang dan Infrastruktur Energi yang Terdaftar di BEI Tahun 2010 – 2014)”. Simposium Nasional Akuntansi XIX, Lampung.
Stigler, G. J. (1971). The theory of economic regulation. The Bell Journal of Economics and Management Science, 3–21.
Ulum, I. (2015). Intellectual Capital Model Pengukuran, Framework Pengungkapan, dan Kinerja Organisasi, (Malang: UMM Press).