Saumyadipta Pyne · B.L.S. Prakasa Rao
S.B. Rao
Editors
Big Data
Analytics
Saumyadipta Pyne
⋅
B.L.S. Prakasa Rao
S.B. Rao
Editors
Big Data Analytics
Methods and Applications
Saumyadipta Pyne
Indian Institute of Public Health Hyderabad
India
B.L.S. Prakasa Rao CRRao AIMSCS
University of Hyderabad Campus Hyderabad
India
S.B. Rao CRRao AIMSCS
University of Hyderabad Campus Hyderabad
India
ISBN 978-81-322-3626-9 ISBN 978-81-322-3628-3 (eBook) DOI 10.1007/978-81-322-3628-3
Library of Congress Control Number: 2016946007
© Springer India 2016
This work is subject to copyright. All rights are reserved by the Publisher, whether the whole or part of the material is concerned, specifically the rights of translation, reprinting, reuse of illustrations,
recitation, broadcasting, reproduction on microfilms or in any other physical way, and transmission or information storage and retrieval, electronic adaptation, computer software, or by similar or dissimilar methodology now known or hereafter developed.
The use of general descriptive names, registered names, trademarks, service marks, etc. in this publication does not imply, even in the absence of a specific statement, that such names are exempt from the relevant protective laws and regulations and therefore free for general use.
The publisher, the authors and the editors are safe to assume that the advice and information in this book are believed to be true and accurate at the date of publication. Neither the publisher nor the authors or the editors give a warranty, express or implied, with respect to the material contained herein or for any errors or omissions that may have been made.
Printed on acid-free paper
This Springer imprint is published by Springer Nature The registered company is Springer (India) Pvt. Ltd.
Big data is transforming the traditional ways of handling data to make sense of the world from which it is collected. Statisticians, for instance, are used to developing methods for analysis of data collected for a specific purpose in a planned way. Sample surveys and design of experiments are typical examples.
Big data, in contrast, refers to massive amounts of very high dimensional and even unstructured data which are continuously produced and stored with much cheaper cost than they are used to be. High dimensionality combined with large sample size creates unprecedented issues such as heavy computational cost and algorithmic instability.
The massive samples in big data are typically aggregated from multiple sources at different time points using different technologies. This can create issues of heterogeneity, experimental variations, and statistical biases, and would therefore require the researchers and practitioners to develop more adaptive and robust procedures.
Toward this, I am extremely happy to see in this title not just a compilation of chapters written by international experts who work in diverse disciplines involving Big Data, but also a rare combination, within a single volume, of cutting-edge work in methodology, applications, architectures, benchmarks, and data standards.
I am certain that the title, edited by three distinguished experts in theirfields, will inform and engage the mind of the reader while exploring an exciting new territory in science and technology.
Calyampudi Radhakrishna Rao C.R. Rao Advanced Institute of Mathematics, Statistics and Computer Science, Hyderabad, India
The emergence of the field of Big Data Analytics has prompted the practitioners and leaders in academia, industry, and governments across the world to address and decide on different issues in an increasingly data-driven manner. Yet, often Big Data could be too complex to be handled by traditional analytical frameworks. The varied collection of themes covered in this title introduces the reader to the richness of the emergingfield of Big Data Analytics in terms of both technical methods as well as useful applications.
The idea of this title originated when we were organizing the“Statistics 2013, International Conference on Socio-Economic Challenges and Sustainable Solutions (STAT2013)” at the C.R. Rao Advanced Institute of Mathematics, Statistics and Computer Science (AIMSCS) in Hyderabad to mark the “International Year of Statistics”in December 2013. As the convener, Prof. Saumyadipta Pyne organized a special session dedicated to lectures by several international experts working on large data problems, which ended with a panel discussion on the research chal-lenges and directions in this area. Statisticians, computer scientists, and data ana-lysts from academia, industry and government administration participated in a lively exchange.
Following the success of that event, we felt the need to bring together a col-lection of chapters written by Big Data experts in the form of a title that can combine new algorithmic methods, Big Data benchmarks, and various relevant applications from this rapidly emerging area of interdisciplinary scientific pursuit. The present title combines some of the key technical aspects with case studies and domain applications, which makes the materials more accessible to the readers. In fact, when Prof. Pyne taught his materials in a Master’s course on “Big and High-dimensional Data Analytics” at the University of Hyderabad in 2013 and 2014, it was well-received.
We thank all the authors of the chapters for their valuable contributions to this title. Also, We sincerely thank all the reviewers for their valuable time and detailed comments. We also thank Prof. C.R. Rao for writing the foreword to the title.
Hyderabad, India Saumyadipta Pyne
June 2016 B.L.S. Prakasa Rao
Big Data Analytics: Views from Statistical and Computational
Perspectives. . . 1 Saumyadipta Pyne, B.L.S. Prakasa Rao and S.B. Rao
Massive Data Analysis: Tasks, Tools, Applications, and Challenges. . . . 11 Murali K. Pusala, Mohsen Amini Salehi, Jayasimha R. Katukuri,
Ying Xie and Vijay Raghavan
Statistical Challenges with Big Data in Management Science . . . 41 Arnab Laha
Application of Mixture Models to Large Datasets . . . 57 Sharon X. Lee, Geoffrey McLachlan and Saumyadipta Pyne
An Efficient Partition-Repetition Approach in Clustering
of Big Data . . . 75 Bikram Karmakar and Indranil Mukhopadhayay
Online Graph Partitioning with an Affine Message Combining
Cost Function . . . 95 Xiang Chen and Jun Huan
Big Data Analytics Platforms for Real-Time Applications in IoT. . . 115 Yogesh Simmhan and Srinath Perera
Complex Event Processing in Big Data Systems. . . 137 Dinkar Sitaram and K.V. Subramaniam
Unwanted Traffic Identification in Large-Scale University
Networks: A Case Study. . . 163 Chittaranjan Hota, Pratik Narang and Jagan Mohan Reddy
Application-Level Benchmarking of Big Data Systems . . . 189 Chaitanya Baru and Tilmann Rabl
Managing Large-Scale Standardized Electronic Health Records. . . 201 Shivani Batra and Shelly Sachdeva
Microbiome Data Mining for Microbial Interactions and
Relationships. . . 221 Xingpeng Jiang and Xiaohua Hu
A Nonlinear Technique for Analysis of Big Data in Neuroscience . . . 237 Koel Das and Zoran Nenadic
Saumyadipta Pyne is Professor at the Public Health Foundation of India, at the
Indian Institute of Public Health, Hyderabad, India. Formerly, he was P.C. Mahalanobis Chair Professor and head of Bioinformatics at the C.R. Rao Advanced Institute of Mathematics, Statistics and Computer Science. He is also Ramalin-gaswami Fellow of Department of Biotechnology, the Government of India, and the founder chairman of the Computer Society of India’s Special Interest Group on Big Data Analytics. Professor Pyne has promoted research and training in Big Data Analytics, globally, including as the workshop co-chair of IEEE Big Data in 2014 and 2015 held in the U.S.A. His research interests include Big Data problems in life sciences and health informatics, computational statistics and high-dimensional data modeling.
B.L.S. Prakasa Rao is the Ramanujan Chair Professor at the C.R. Rao Advanced
Institute of Mathematics, Statistics and Computer Science, Hyderabad, India. Formerly, he was director at the Indian Statistical Institute, Kolkata, and the Homi Bhabha Chair Professor at the University of Hyderabad. He is a Bhatnagar awardee from the Government of India, fellow of all the three science academies in India, fellow of Institute of Mathematical Statistics, U.S.A., and a recipient of the national award in statistics in memory of P.V. Sukhatme from the Government of India. He has also received the Outstanding Alumni award from Michigan State University. With over 240 papers published in several national and international journals of repute, Prof. Prakasa Rao is the author or editor of 13 books, and member of the editorial boards of several national and international journals. He was, most recently, the editor-in-chief for journals—SankhyaA andSankhyaB. His research interests include asymptotic theory of statistical inference, limit theorems in probability theory and inference for stochastic processes.
S.B. Rao was formerly director of the Indian Statistical Institute, Kolkata, and
director of the C.R. Rao Advanced Institute of Mathematics, Statistics and Com-puter Science, Hyderabad. His research interests include theory and algorithms in graph theory, networks and discrete mathematics with applications in social,
and Computational Perspectives
Saumyadipta Pyne, B.L.S. Prakasa Rao and S.B. Rao
Abstract Without any doubt, the most discussed current trend in computer science and statistics is BIG DATA. Different people think of different things when they hear about big data. For the statistician, the issues are how to get usable information out of datasets that are too huge and complex for many of the traditional or classical meth-ods to handle. For the computer scientist, big data poses problems of data storage and management, communication, and computation. For the citizen, big data brings up questions of privacy and confidentiality. This introductory chapter touches some key aspects of big data and its analysis. Far from being an exhaustive overview of this fast emerging field, this is a discussion on statistical and computational views that the authors owe to many researchers, organizations, and online sources.
1
Some Unique Characteristics of Big Data
Big data exhibits a range of characteristics that appears to be unusual when com-pared to traditional datasets. Traditionally, datasets were generated upon conscious and careful planning. Field experts or laboratory experimenters typically spend con-siderable time, energy, and resources to produce data through planned surveys or designed experiments. However, the world of big data is often nourished by dynamic sources such as intense networks of customers, clients, and companies, and thus there is an automatic flow of data that is always available for analysis. This almost volun-tary generation of data can bring to the fore not only such obvious issues as data volume, velocity, and variety but also data veracity, individual privacy, and indeed,
S. Pyne (
✉
)Indian Institute of Public Health, Hyderabad, India e-mail: [email protected]
B.L.S. Prakasa Rao⋅S.B. Rao
C.R. Rao Advanced Institute of Mathematics, Statistics and Computer Science, Hyderabad, India
e-mail: [email protected]
S.B. Rao
e-mail: [email protected]
© Springer India 2016
S. Pyne et al. (eds.),Big Data Analytics, DOI 10.1007/978-81-322-3628-3_1
ethics. If data points appear without anticipation or rigor of experimental design, then their incorporation in tasks like fitting a suitable statistical model or making a prediction with a required level of confidence, which may depend on certain assump-tions about the data, can be challenging. On the other hand, the spontaneous nature of such real-time pro-active data generation can help us to capture complex, dynamic phenomena and enable data-driven decision-making provided we harness that ability in a cautious and robust manner. For instance, popular Google search queries could be used to predict the time of onset of a flu outbreak days earlier than what is pos-sible by analysis of clinical reports; yet an accurate estimation of the severity of the outbreak may not be as straightforward [1]. A big data-generating mechanism may provide the desired statistical power, but the same may also be the source of some its limitations.
Another curious aspect of big data is its potential of being used in unintended manner in analytics. Often big data (e.g., phone records) could be used for the type of analysis (say, urban planning) that is quite unrelated to the original purpose of its generation, especially if the purpose is integration or triangulation of diverse types of data, including auxiliary data that may be publicly available. If a direct survey of a society’s state of well-being is not possible, then big data approaches can still pro-vide indirect but valuable insights into the society’s socio-economic indicators, say, via people’s cell phone usage data, or their social networking patterns, or satellite images of the region’s energy consumption or the resulting environmental pollution, and so on. Not only can such unintended usage of data lead to genuine concerns about individual privacy and data confidentiality, but it also raises questions regard-ing enforcement of ethics on the practice of data analytics.
Yet another unusual aspect that sometimes makes big data what it is is the ratio-nale that if the generation costs are low, then one might as well generate data on as many samples and as many variables as possible. Indeed, less deliberation and lack of parsimonious design can mark such “glut” of data generation. The relevance of many of the numerous variables included in many big datasets seems debatable, especially since the outcome of interest, which can be used to determine the relevance of a given predictor variable, may not always be known during data collection. The actual explanatory relevance of many measured variables to the eventual response may be limited (so-called “variable sparsity”), thereby adding a layer of complexity to the task of analytics beyond more common issues such as data quality, missing data, and spurious correlations among the variables.
pow-erful tools that is used for extraction of features from unstructured data, which allows combined modeling of structured and unstructured data.
Let us assume a generic dataset to be an×pmatrix. While we often refer to big data with respect to the number of data points or samples therein (denoted above by n), its high data volume could also be due to the large number of variables (denoted byp) that are measured for each sample in a dataset. A high-dimensional or “bigp” dataset (say, in the field of genomics) can contain measurements of tens of thousands of variables (e.g., genes or genomic loci) for each sample. Increasingly, large values of bothpandnare presenting practical challenges to statisticians and computer scientists alike. High dimensionality, i.e., bigprelative to low sample size or smalln, of a given dataset can lead to violation of key assumptions that must be satisfied for certain common tests of hypotheses to be applicable on such data. In fact, some domains of big data such as finance or health do even produce infinite dimensional functional data, which are observed not as points but functions, such as growth curves, online auction bidding trends, etc.
Perhaps the most intractable characteristic of big data is its potentially relentless generation. Owing to automation of many scientific and industrial processes, it is increasingly feasible, sometimes with little or no cost, to continuously generate dif-ferent types of data at high velocity, e.g., streams of measurements from astronom-ical observations, round-the-clock media, medastronom-ical sensors, environmental monitor-ing, and many “big science” projects. Naturally, if streamed out, data can rapidly gain high volume as well as need high storage and computing capacity. Data in motion can neither be archived in bounded storage nor held beyond a small, fixed period of time. Further, it is difficult to analyze such data to arbitrary precision by standard iterative algorithms used for optimal modeling or prediction. Other sources of intractability include large graph data that can store, as network edges, static or dynamic informa-tion on an enormous number of relainforma-tionships that may exist among individual nodes such as interconnected devices (the Internet of Things), users (social networks), com-ponents (complex systems), autonomous agents (contact networks), etc. To address such variety of issues, many new methods, applications, and standards are currently being developed in the area of big data analytics at a rapid pace. Some of these have been covered in the chapters of the present title.
2
Computational versus Statistical Complexity
Therefore, as data volume increases, any method that requires significantly more thanO(Nlog(N))steps (i.e., exceeding the order of time that a single pass over the full data would require) could be impractical. While some of the important prob-lems in practice withO(Nlog(N))solutions are just about scalable (e.g., Fast Fourier transform), those of higher complexity, certainly including the NP-Complete class of problems, would require help from algorithmic strategies like approximation, ran-domization, sampling, etc. Thus, while classical complexity theory may consider polynomial time solutions as the hallmark of computational tractability, the world of big data is indeed even more demanding.
Big data are being collected in a great variety of ways, types, shapes, and sizes. The data dimensionalitypand the number of data points or sample sizenare usually the main components in characterization of data volume. Interestingly, bigpsmall ndatasets may require a somewhat different set of analytical tools as compared to bignbigpdata. Indeed, there may not be a single method that performs well on all types of big data. Five aspects of the data matrix are important [2]:
(i) the dimensionprepresenting the number of explanatory variables measured; (ii) the sample sizenrepresenting the number of observations at which the variables
are measured or collected;
(iii) the relationship betweennandpmeasured by their ratio;
(iv) the type of variables measured (categorical, interval, count, ordinal, real-valued, vector-valued, function-valued) and the indication of scales or units of measure-ment; and
(v) the relationship among the columns of the data matrix to check multicollinearity in the explanatory variables.
To characterize big data analytics as different from (or extension of) usual data analysis, one could suggest various criteria, especially if the existing analytical strategies are not adequate for the solving the problem in hand due to certain proper-ties of data. Such properproper-ties could go beyond sheer data volume. High data velocity can present unprecedented challenges to a statistician who may not be used to the idea of forgoing (rather than retaining) data points, as they stream out, in order to satisfy computational constraints such as single pass (time constraint) and bounded storage (space constraint). High data variety may require multidisciplinary insights to enable one to make sensible inference based on integration of seemingly unrelated datasets. On one hand, such issues could be viewed merely as cultural gaps, while on the other, they can motivate the development of the necessary formalisms that can bridge those gaps. Thereby, a better understanding of the pros and cons of dif-ferent algorithmic choices can help an analyst decide about the most suitable of the possible solution(s) objectively. For instance, given apvariable dataset, a time-data complexity class can be defined in terms ofn(p),r(p)andt(p)to compare the perfor-mance tradeoffs among the different choices of algorithms to solve a particular big data problem within a certain number of samplesn(p), a certain level of error or risk r(p)and a certain amount of timet(p)[3].
as instances of an underlying random process for data generation, typically mod-eled using suitable probability distributions. Therefore, by assuming such underlying structure, one could view the growing number of data points as a potential source of simplification of that structural complexity. Thus, biggerncan lead to, in a clas-sical statistical framework, favorable conditions under which inference based on the assumed model can be more accurate, and model asymptotics can possibly hold [3]. Similarly, bigpmay not always be viewed unfavorably by the statistician, say, if the model-fitting task can take advantage of data properties such as variable sparsity whereby the coefficients—say, of a linear model—corresponding to many variables, except for perhaps a few important predictors, may be shrunk towards zero [4]. In particular, it is the bigpand smallnscenario that can challenge key assumptions made in certain statistical tests of hypotheses. However, while data analytics shifts from a static hypothesis-driven approach to a more exploratory or dynamic large data-driven one, the computational concerns, such as how to decide each step of an analytical pipeline, of both the computer scientist and the statistician have gradually begun to converge.
Let us suppose that we are dealing with a multiple linear regression problem with pexplanatory variables under Gaussian error. For a model space search for variable selection, we have to find the best subset from among2p− 1sub-models. Ifp= 20, then 2p− 1is about a million; but ifp= 40, then the same increases to about a trillion! Hence, any problem with more thanp= 50variables is potentially a big data problem. With respect ton, on the other hand, say, for linear regression methods, it takesO(n3)number of operations to invert ann×nmatrix. Thus, we might say that a dataset is big n ifn>1000. Interestingly, for a big dataset, the ration∕pcould be even more important than the values ofnandptaken separately. According to a recent categorization [2], it is information-abundant ifn∕p≥10, information-scarce if1≤n∕p<10, and information-poor ifn∕p<1.
Theoretical results, e.g., [5], show that the data dimensionalitypis not consid-ered as “big” relative tonunlesspdominates√nasymptotically. Ifp≫n, then there exists a multiplicity of solutions for an optimization problem involving model-fitting, which makes it ill-posed. Regularization methods such as the Lasso (cf. Tibshirani [6]) are used to find a feasible optimal solution, such that the regularization term offers a tradeoff between the error of the fit model and its complexity. This brings us to the non-trivial issues of model tuning and evaluation when it comes to big data. A “model-complexity ladder” might be useful to provide the analyst with insights into a range of possible models to choose from, often driven by computational considera-tions [7]. For instance, for high-dimensional data classification, the modeling strate-gies could range from, say, naïve Bayes and logistic regression and moving up to, possibly, hierarchical nonparametric Bayesian approaches. Ideally, the decision to select a complex model for a big dataset should be a careful one that is justified by the signal-to-noise ratio of the dataset under consideration [7].
characteristics. If the underlying data generation process changes, then the data com-plexity can change dynamically. New classes can emerge or disappear from data (also known as “concept drift”) even while the model-fitting is in progress. In a scenario where the data complexity can change, one might opt for a suitable nonparametric model whose complexity and number of parameters could also grow as more data points become available [7]. For validating a selected model, cross-validation is still very useful for high-dimensional data. For big data, however, a single selected model does not typically lead to optimal prediction. If there is multicollinearity among the variables, which is possible whenpis big, the estimators will be unstable and have large variance. Bootstrap aggregation (or bagging), based on many resamplings of sizen, can reduce the variance of the estimators by aggregation of bootstrapped ver-sions of the base estimators. For bign, the “bag of small bootstraps” approach can achieve similar effects by using smaller subsamples of the data. It is through such useful adaptations of known methods for “small” data that a toolkit based on fun-damental algorithmic strategies has now evolved and is being commonly applied to big data analytics, and we mention some of these below.
3
Techniques to Cope with Big Data
Sampling, the general process of selecting a subset of data points from a given input, is among the most established and classical techniques in statistics, and proving to be extremely useful in making big data tractable for analytics. Random sampling strategies are commonly used in their simple, stratified, and numerous other variants for their effective handling of big data. For instance, the classical Fisher–Yates shuf-fling is used for reservoir sampling in online algorithms to ensure that for a given “reservoir” sample ofkpoints drawn from a data stream of big but unknown size n, the probability of any new point being included in the sample remains fixed at k∕n, irrespective of the value of the new data. Alternatively, there are case-based or event-based sampling approaches for detecting special cases or events of interest in big data. Priority sampling is used for different applications of stream data. The very fast decision tree (VFDT) algorithm allows big data classification based on a tree model that is built like CART but uses subsampled data points to make its deci-sions at each node of the tree. A probability bound (e.g., the Hoeffding inequality) ensures that had the tree been built instead using the full dataset, it would not differ by much from the model that is based on sampled data [8]. That is, the sequence of decisions (or “splits”) taken by both trees would be similar on a given dataset with probabilistic performance guarantees. Given the fact that big data (say, the records on the customers of a particular brand) are not necessarily generated by random sampling of the population, one must be careful about possible selection bias in the identification of various classes that are present in the population.
connec-tome), complex graphical models, etc., new methods are being developed for sam-pling large graphs to estimate a given network’s parameters, as well as the node-, edge-, or subgraph-statistics of interest. For example, snowball sampling is a com-mon method that starts with an initial sample of seed nodes, and in each stepi, it includes in the sample all nodes that have edges with the nodes in the sample at step i− 1but were not yet present in the sample. Network sampling also includes degree-based or PageRank-degree-based methods and different types of random walks. Finally, the statistics are aggregated from the sampled subnetworks. For dynamic data streams, the task of statistical summarization is even more challenging as the learnt mod-els need to be continuously updated. One approach is to use a “sketch”, which is not a sample of the data but rather its synopsis captured in a space-efficient rep-resentation, obtained usually via hashing, to allow rapid computation of statistics therein such that a probability bound may ensure that a high error of approximation is unlikely. For instance, a sublinear count-min sketch could be used to determine the most frequent items in a data stream [9]. Histograms and wavelets are also used for statistically summarizing data in motion [8].
The most popular approach for summarizing large datasets is, of course, cluster-ing. Clustering is the general process of grouping similar data points in an unsu-pervised manner such that an overall aggregate of distances between pairs of points within each cluster is minimized while that across different clusters is maximized. Thus, the cluster-representatives, (say, thekmeans from the classicalk-means clus-tering solution), along with other cluster statistics, can offer a simpler and cleaner view of the structure of the dataset containing a much larger number of points
(n≫k)and including noise. For bign, however, various strategies are being used to improve upon the classical clustering approaches. Limitations, such as the need for iterative computations involving a prohibitively large O(n2)pairwise-distance matrix, or indeed the need to have the full dataset available beforehand for conducting such computations, are overcome by many of these strategies. For instance, a two-step online–offline approach (cf. Aggarwal [10]) first lets an online step to rapidly assign stream data points to the closest of thek′(≪n) “microclusters.” Stored in efficient data structures, the microcluster statistics can be updated in real time as soon as the data points arrive, after which those points are not retained. In a slower offline step that is conducted less frequently, the retainedk′microclusters’ statistics are then aggregated to yield the latest result on thek(<k′)actual clusters in data. Clustering algorithms can also use sampling (e.g., CURE [11]), parallel computing (e.g., PKMeans [12] using MapReduce) and other strategies as required to handle big data.
main-stays of high-dimensional data analysis. Notably, even such established methods can face computational challenges from big data. For instance,O(n3)time-complexity of matrix inversion, or implementing PCA, for a large dataset could be prohibitive in spite of being polynomial time—i.e. so-called “tractable”—solutions.
Linear and nonlinear multidimensional scaling (MDS) techniques–working with the matrix of O(n2) pairwise-distances between all data points in a high-dimensional space to produce a low-dimensional dataset that preserves the neighborhood structure—also face a similar computational challenge from bigndata. New spectral MDS techniques improve upon the efficiency of aggregating a global neighborhood structure by focusing on the more interesting local neighborhoods only, e.g., [13]. Another locality-preserving approach involves random projections, and is based on the Johnson–Lindenstrauss lemma [14], which ensures that data points of sufficiently high dimensionality can be “embedded” into a suitable low-dimensional space such that the original relationships between the points are approx-imately preserved. In fact, it has been observed that random projections may make the distribution of points more Gaussian-like, which can aid clustering of the pro-jected points by fitting a finite mixture of Gaussians [15]. Given the randomized nature of such embedding, multiple projections of an input dataset may be clustered separately in this approach, followed by an ensemble method to combine and pro-duce the final output.
The term “curse of dimensionality” (COD), originally introduced by R.E. Bell-man in 1957, is now understood from multiple perspectives. From a geometric per-spective, aspincreases, the exponential increase in the volume of ap-dimensional neighborhood of an arbitrary data point can make it increasingly sparse. This, in turn, can make it difficult to detect local patterns in high-dimensional data. For instance, a nearest-neighbor query may lose its significance unless it happens to be limited to a tightly clustered set of points. Moreover, aspincreases, a “deterioration of expres-siveness” of theLpnorms, especially beyondL1andL2, has been observed [16]. A related challenge due to COD is how a data model can distinguish the few relevant predictor variables from the many that are not, i.e., under the condition of dimension sparsity. If all variables are not equally important, then using a weighted norm that assigns more weight to the more important predictors may mitigate the sparsity issue in high-dimensional data and thus, in fact, make COD less relevant [4].
and Succinct upon which the Spark Core processing engine provides access and interfaces to tasks like data cleaning, stream processing, machine learning, graph computation, etc., for running different applications, e.g., cancer genomic analysis, at the top of the stack.
Some experts anticipate a gradual convergence of architectures that are designed for big data and high-performance computing. Important applications such as large simulations in population dynamics or computational epidemiology could be built on top of these designs, e.g., [18]. On the data side, issues of quality control, stan-dardization along with provenance and metadata annotation are being addressed. On the computing side, various new benchmarks are being designed and applied. On the algorithmic side, interesting machine learning paradigms such as deep learning and advances in reinforcement learning are gaining prominence [19]. Fields such as computational learning theory and differential privacy will also benefit big data with their statistical foundations. On the applied statistical side, analysts working with big data have responded to the need of overcoming computational bottlenecks, including the demands on accuracy and time. For instance, to manage space and achieve speedup when modeling large datasets, a “chunking and averaging” strategy has been developed for parallel computation of fairly general statistical estimators [4]. By partitioning a large dataset consisting ofni.i.d. samples (intorchunks each of manageable size⌊n∕r⌋), and computing the estimator for each individual chunk of data in a parallel process, it can be shown that the average of these chunk-specific estimators has comparable statistical accuracy as the estimate on the full dataset [4]. Indeed, superlinear speedup was observed in such parallel estimation, which, asn grows larger, should benefit further from asymptotic properties.
4
Conclusion
References
1. Kennedy R, King G, Lazer D, Vespignani A (2014) The parable of google flu. Traps in big data analysis. Science 343:1203–1205
2. Fokoue E (2015) A taxonomy of Big Data for optimal predictive machine learning and data mining.arXiv.1501.0060v1[stat.ML] 3 Jan 2015
3. Chandrasekaran V, Jodan MI (2013) Computational and statistical tradeoffs via convex relax-ation. Proc Natl Acad Sci USA 110:E1181–E1190
4. Matloff N (2016) Big n versus big p in Big data. In: Bühlmann P, Drineas P (eds) Handbook of Big Data. CRC Press, Boca Raton, pp 21–32
5. Portnoy S (1988) Asymptotic behavior of likelihood methods for exponential families when the number of parameters tends to infinity. Ann Stat 16:356–366
6. Tibshirani R (1996) Regression analysis and selection via the lasso. J R Stat Soc Ser B 58:267– 288
7. Report of National Research Council (2013) Frontiers in massive data analysis. National Acad-emies Press, Washington D.C
8. Gama J (2010) Knowledge discovery from data streams. Chapman Hall/CRC, Boca Raton 9. Cormode G, Muthukrishnan S (2005) An improved data stream summary: the count-min sketch
and its applications. J Algorithms 55:58–75
10. Aggarwal C (2007) Data streams: models and algorithms. Springer, Berlin
11. Rastogi R, Guha S, Shim K (1998) Cure: an efficient clustering algorithm for large databases. In: Proceedings of the ACM SIGMOD, pp 73–84
12. Ma H, Zhao W, He C (2009) Parallel k-means clustering based on MapReduce. CloudCom, pp 674–679
13. Aflalo Y, Kimmel R (2013) Spectral multidimensional scaling. Proc Natl Acad Sci USA 110:18052–18057
14. Johnson WB, Lindenstrauss J (1984) Extensions of lipschitz mappings into a hilbert space. Contemp Math 26:189–206
15. Fern XZ, Brodley CE (2003) Random projection for high dimensional data clustering: a cluster ensemble approach. In: Proceedings of the ICML, pp 186–193
16. Zimek A (2015) Clustering high-dimensional data. In: Data clustering: algorithms and appli-cations. CRC Press, Boca Raton
17. University of California at Berkeley AMP Lab. https://amplab.cs.berkeley.edu/. Accessed April 2016
18. Pyne S, Vullikanti A, Marathe M (2015) Big data applications in health sciences and epidemi-ology. In: Raghavan VV, Govindaraju V, Rao CR (eds) Handbook of statistics, vol 33. Big Data analytics. Elsevier, Oxford, pp 171–202
Applications, and Challenges
Murali K. Pusala, Mohsen Amini Salehi, Jayasimha R. Katukuri, Ying Xie and Vijay Raghavan
Abstract In this study, we provide an overview of the state-of-the-art technologies in programming, computing, and storage of the massive data analytics landscape. We shed light on different types of analytics that can be performed on massive data. For that, we first provide a detailed taxonomy on different analytic types along with examples of each type. Next, we highlight technology trends of massive data ana-lytics that are available for corporations, government agencies, and researchers. In addition, we enumerate several instances of opportunities that exist for turning sive data into knowledge. We describe and position two distinct case studies of mas-sive data analytics that are being investigated in our research group: recommendation systems in e-commerce applications; and link discovery to predict unknown associ-ation of medical concepts. Finally, we discuss the lessons we have learnt and open challenges faced by researchers and businesses in the field of massive data analytics.
M.K. Pusala⋅J.R. Katukuri⋅V. Raghavan (
✉
)Center of Advanced Computer Studies (CACS), University of Louisiana Lafayette, Lafayette, LA 70503, USA
e-mail: [email protected]
M.K. Pusala
e-mail: [email protected]
J.R. Katukuri
e-mail: [email protected]
M. Amini Salehi
School of Computing and Informatics, University of Louisiana Lafayette, Lafayette, LA 70503, USA
e-mail: [email protected]
Y. Xie
Department of Computer Science, Kennesaw State University, Kennesaw, GA 30144, USA
e-mail: [email protected]
© Springer India 2016
S. Pyne et al. (eds.),Big Data Analytics, DOI 10.1007/978-81-322-3628-3_2
1
Introduction
1.1
Motivation
Growth of Internet usage in the last decade has been at an unprecedented rate from 16 million, which is about 0.4 % of total population in 1995, to more than 3 billion users, which is about half of the world’s population in mid-2014. This revolutionized the way people communicate and share their information. According to [46], just during 2013, 4.4 zettabytes (4.4 × 270bytes) of information have created and replicated, and
it estimated to grow up to 44 zettabytes by 2020. Below, we explain few sources from such massive data generation.
Facebook1has an average of 1.39 billion monthly active users exchanging billions of messages and postings every day [16]. There is also a huge surge in multimedia content like photos and videos. For example, in popular photo sharing social net-work Instagram,2on average, 70 million photos uploaded and shared every day [27]. According to other statistics published by Google on its video streaming service, YouTube,3has approximately 300 h of video uploaded every minute and billions of views generated every day [62].
Along with Individuals, organizations are also generating a huge amount of data, mainly due to increased use of networked sensors in various sectors of organizations. For example, by simply replacing traditional bar code systems with radio frequency identification (RFID) systems organizations have generated 100 to 1000 times more data [57].
Organization’s interest on customer behavior is another driver for producing mas-sive data. For instance, Wal-Mart4handles more than a million customer transactions each hour and maintains a database that holds more than 2.5 petabytes of data [57]. Many businesses are creating a360◦view of a customer by combining transaction
data with social networks and other sources.
Data explosion is not limited to individuals or organizations. With the increase of scientific equipment sensitivity and advancements in technology, the scientific and research, community is also generating a massive amount of data. Australian Square Kilometer Array Pathfinder radio telescope [8] has 36 antennas streams approxi-mately 250 GB of data per second per antenna that collectively produces nine ter-abytes of data per second. In another example, particle accelerator, particle detector, and simulations at Large Hadron Collider (LHC) at CERN [55] generate approxi-mately 15 petabytes of data per year.
1.2
Big Data Overview
The rapid explosion of data is usually referred as“Big Data”, which is a trending topic in both industry and academia. Big data (aka Massive Data) is defined as, data that cannot be handled or analyzed by conventional processing and storage tools. Big data is also characterized by features,known as5V’s. These features are:volume, variety,velocity,variability, andveracity[7,21].
Traditionally, most of the available data is structured data and stored in conven-tional databases and data warehouses for supporting all kinds of data analytics. With the Big data, data is no longer necessarily structured. Instead, it contains avarietyof data sources, including structured, semi-structured, and unstructured data [7]. It is estimated that 85 % of total organizational data are unstructured data [57] and almost all the data generated by individuals (e.g., emails, messages, blogs, and multime-dia) are unstructured data too. Traditional relational databases are no longer a viable option to store text, video, audio, images, and other forms of unstructured data. This creates a need for special types of NoSQL databases and advanced analytic methods. Velocityof data is described as problem of handling and processing data at the speeds at which they are generated to extract a meaningful value. Online retailers store every attribute (e.g., clicks, page visits, duration of visits to a page) of their customers’ visits to their online websites. There is a need to analyze customers’ visits within a reasonable timespan (e.g., real time) to recommend similar items and related items with respect to the item a customer is looking at. This helps companies to attract new customers and keep an edge over their competitors. Some organizations analyze data as a stream in order to reduce data storage. For instance, LHC at CERN [55] analyzes data before storing to meet the storage requirements. Smart phones are equipped with modern location detection sensors that enable us to understand the customer behavior while, at the same time, creating the need for real-time analysis to deliver location-based suggestions.
Datavariabilityis the variation in data flow with time of day, season, events, etc. For example, retailers sell significantly more in November and December compared to rest of year. According to [1], traffic to retail websites surges during this period. The challenge, in this scenario, is to provide resources to handle sudden increases in users’ demands. Traditionally, organizations were building in-house infrastructure to support their peak-estimated demand periods. However, it turns out to be costly, as the resources will remain idle during the rest of the time. However, the emergence of advanced distributed computing platforms, known as ‘the cloud,’ can be leveraged to enable on-demand resource provisioning through third party companies. Cloud provides efficient computational, storage, and other services to organizations and relieves them from the burden of over-provisioning resources [49].
to obtain hidden information in data. Higher quality data increases the likelihood of effective decision-making and analytics. A McKinsey study found that retailers using full potential from Big data could increase the operating margin up to 60 % [38]. To reach this goal, the quality of collected data needs to be improved.
1.3
Big Data Adoption
Organizations have already started tapping into the potential of Big data. Conven-tional data analytics are based on structured data, such as the transacConven-tional data, that are collected in a data warehouse. Advanced massive data analysis helps to com-bine traditional data with data from different sources for decision-making. Big data provides opportunities for analyzing customer behavior patterns based on customer actions inside (e.g., organization website) and outside (e.g., social networks).
In a manufacturing industry, data from sensors that monitor machines’ operation are analyzed to predict failures of parts and replace them in advance to avoid sig-nificant down time [25]. Large financial institutions are using Big data analytics to identify anomaly in purchases and stop frauds or scams [3].
In spite of the wide range of emerging applications for Big data, organizations are still facing challenges to adopt Big data analytics. A report from AIIM [9], identified three top challenges in the adoption of Big data, which are lack of skilled workers, difficulty to combine structured and unstructured data, and security and privacy con-cerns. There is a sharp rise in the number of organizations showing interest to invest in Big data related projects. According to [18], in 2014, 47 % of organizations are reportedly investing in Big data products, as compared to 38 % in 2013. IDC pre-dicted that the Big data service market has reached 11 billion dollars in 2009 [59] and it could grow up to 32.4 billion dollars by end of 2017 [43]. Venture capital fund-ing for Big data projects also increased from 155 million dollars in 2009 to more than 893 million dollars in 2013 [59].
1.4
The Chapter Structure
From the late 1990s, when Big data phenomenon was first identified, until today, there has been many improvements in computational capabilities, storage devices have become more inexpensive, thus, the adoption of data-centric analytics has increased. In this study, we provide an overview of Big data analytic types, offer insight into Big data technologies available, and identify open challenges.
we present two real-world Big data analytic projects. Section6discusses open chal-lenges in Big data analytics. Finally, we summarize and conclude the main contri-butions of the chapter in Sect.7.
2
Big Data Analytics
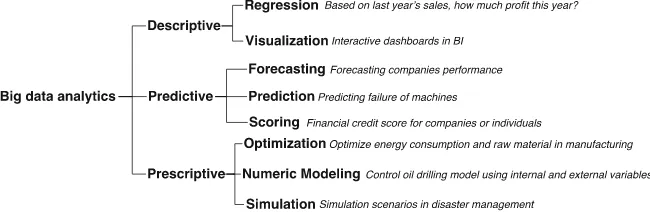
Big data analytics is the process of exploring Big data, to extract hidden and valu-able information and patterns [48]. Big data analytics helps organizations in more informed decision-making. Big data analytics applications can be broadly classi-fied asdescriptive,predictive, andprescriptive. Figure1illustrates the data analytic classes, techniques, and example applications. In the rest of this section, with refer-ence to Fig.1, we elaborate on these Big data analytic types.
2.1
Descriptive Analytics
Descriptive analytics mines massive data repositories to extract potential patterns existing in the data. Descriptive analytics drills down into historical data to detect patterns like variations in operating costs, sales of different products, customer buy-ing preferences, etc.
Typically it is the first step of analytics in decision-making, answering the ques-tion of “what has happened? ”. It summarizes raw data into a human understandable format. Most of the statistical analysis used in day-to-day Business Intelligence (BI) regarding a company’s production, financial operations, sales, inventory, and cus-tomers come under descriptive analytics [61]. Analytics involve simple techniques, such as regression to find correlation among various variables and drawing charts,
to identify trends in the data, and visualize data in a meaningful and understandable way, respectively.
For example, Dow Chemicals used descriptive analytics to identify under-utilized space in its offices and labs. As a result, they were able to increase space utilization by 20 % and save approximately $4 million annually [14].
2.2
Predictive Analytics
With descriptive analytics, organizations can understand what happened in the past. However, at a higher level of decision-making is to address the question of “what could happen?”. Predictive analytics helps to combine massive data from different sources with the goal of predicting future trends or events. Predictive analytics eval-uates the future, by forecasting trends, by generating prediction models, and by scor-ing.
For example, industries use predictive analytics to predict machine failures using streaming sensor data [25]. Organizations are able to forecast their sales trends or overall performance [35]. Financial institutions devote a lot of resources to predict credit risk scores for companies or individuals. Eventhough predictive analytics can-not predict with 100 % certainty, but it helps the companies in estimating future trends for more informed decision-making.
Southwest airlines has partnered with National Aeronautics and Space Adminis-tration (NASA) to work on a Big data-mining project [42]. They apply text-based analysis on data from sensors in their planes in order to find patterns that indicate potential malfunction or safety issues.
Purdue University uses Big data analytics to predict academic and behavioral issues [45]. For each student, the system predicts and generates a risk profile indi-cating how far a student succeeds in a course and labels the risk levels as green (high probability of success), yellow (potential problems), and red (risk of failure) by using data from various sources, such as student information and course management sys-tems for this analytics.
2.3
Prescriptive Analytics
Descriptive and predictive analytics helps to understand the past and predict the future. The next stage in decision-making is “how can we make it happen?”—the answer is prescriptive analytics. The goal of prescriptive analytics is to assist profes-sionals in assessing the impact of different possible decisions. It is a relatively new analytic method. According to Gartner [19], only 3 % of companies use prescriptive analytics in their decision-making. Prescriptive analytics involves techniques such as optimization, numerical modeling, and simulation.
Oil and Gas exploration industries use prescriptive analytics to optimize the exploration process. Explorers are using massive datasets from different sources in the exploration process and use prescriptive analytics to optimize drilling location [56]. They use earth’s sedimentation characteristics, temperature, pressure, soil type, depth, chemical composition, molecular structures, seismic activity, machine data, and others to determine the best possible location to drill [15, 17]. This helps to optimize selection of drilling location, and avoid the cost and effort of unsuccessful drills.
Health care is one of the sectors benefiting from applying Big data prescriptive analytics. Prescriptive analytics can recommend diagnoses and treatments to a doc-tor by analyzing patient’s medical hisdoc-tory, similar conditioned patient’s hisdoc-tory, aller-gies, medicines, environmental conditions, stage of cure, etc. According to [54], the Aurora Health Care Center saves six million USD annually by using Big data ana-lytics and recommending best possible treatment to doctors.
3
Big Data Analytics Platforms
There are several Big data analytics platforms available. In this section, we present advances within the Big data analytics platforms.
3.1
MapReduce
MapReduce framework represents a pioneering schema for performing Big data ana-lytics. It has been developed for a dedicated platform (such as a cluster). MapReduce framework has been implemented in three different ways. The first implementation was achieved by Google [13] under a proprietary license. The other two implemen-tations are: Hadoop [33] and Spark [66],which are available as open source. There are other platforms that, in fact, stem from these basic platforms.
MapRe-duce works closely with a distributed storage system to carry out operations such as storing input, intermediate, and output data. Distributed file systems, such as Hadoop Distributed File System (HDFS) [52] and Google File System (GFS), have been developed to the MapReduce framework [20].
Every MapReduce workflow typically contains three steps (phases) namely, Map-ping step, Shuffling step, and Reduce step. In the Map step, user (programmer) imple-ments the functionality required in the Map function. The defined Map function will be executed against the input dataset across the available computational resources. The original (i.e., input) data are partitioned and placed in a distributed file system (DFS). Then, each Map task processes a partition of data from the DFS and gen-erates intermediate data that are stored locally on the worker machines where the processing was taking place.
Distributing the intermediate data on the available computational resources is required to enable parallel Reduce. This step is known as Shuffling. The distribution of the intermediate data is performed in an all-to-all fashion that generally creates a communication bottleneck. Once the distribution of intermediate data is performed, the Reduce function is executed to produce the output, which is the final result of the MapReduce processing. Commonly, developers create a chain of MapReduce jobs (also referred to as a multistage MapReduce job), such as the Yahoo! WebMap [5]. In this case, the output of one MapReduce job is consumed as the intermediate data for the next MapReduce job in the chain.
3.2
Apache Hadoop
Hadoop [33] framework was developed as an open source product by Yahoo! and widely adopted for Big data analytics by the academic and industrial communities. The main design advantage of Hadoop is its fault-tolerance. In fact, Hadoop has been designed with the assumption of failure as a common issue in distributed systems. Therefore, it is robust against failures commonly occur during different phases of execution.
Hadoop Distributed File System (HDFS) and MapReduce are two main building blocks of Hadoop. The former is the storage core of Hadoop (see Sect.4.1for details). The latter, MapReduce engine, is above the file system and takes care of executing the application by moving binaries to the machines that have the related data.
a distributed system, its performance is not the best amongst other available tools because of frequent disk accesses [51].
3.3
Spark
Spark is a more recent framework developed at UC Berkeley [66]. It is being used for research and production applications. Spark offers a general-purpose program-ming interface in the Scala programprogram-ming language for interactive, in-memory data analytics of large datasets on a cluster.
Spark provides three data abstractions for programming clusters namely,resilient distributed datasets (RDDs),broadcast variables, andaccumulators. RDD is a read-only collection of objects partitioned across a set of machines. It can reconstruct lost partitions or recover in the event of a node failure. RDD uses a restricted shared memory to achieve fault-tolerance. Broadcast variables and accumulators are two restricted types of shared variables. Broadcast variable is a shared object wrapped around a read-only value, which ensures it is only copied to each worker once. Accu-mulators are shared variables with anaddoperation. Only workers can perform an operation on an accumulator and only users’ driver programs can read from it. Even-though, these abstractions are simple and limited, they can be used to develop several cluster-based applications.
Spark uses master/slave architecture. It has one master instance, which runs a user-defined driver program. At run-time, the driver program launches multiple workers in the cluster, which read data from the shared filesystem (e.g., Hadoop Distributed File System). Workers create RDDs and write partitions on RAM as defined by the driver program. Spark supports RDD transformations (e.g., map, fil-ter) and actions (e.g., count, reduce). Transformations generate new datasets and actions return a value, from the existing dataset.
Spark has proved to be 20X faster than Hadoop for iterative applications, was shown to speed up a real-world data analytics report by 40X, and has been used interactively to scan a 1 TB dataset with 57 s latency [65].
3.4
High Performance Computing Cluster
LexisNexis Risk Solutions originally developed High Performance Computing Clus-ter (HPCC),5as a proprietary platform, for processing and analyzing large volumes of data on clusters of commodity servers more than a decade ago. It was turned into an open source system in 2011. Major components of an HPCC system include a Thor cluster and a Roxie cluster, although the latter is optional. Thor is called the data refinery cluster, which is responsible for extracting, transforming, and loading
(ETL), as well as linking and indexing massive data from different sources. Roxie is called the query cluster, which is responsible for delivering data for online queries and online analytical processing (OLAP).
Similar to Hadoop, HPCC also uses a distributed file system to support parallel processing on Big data. However, compared with HDFS, the distributed file system used by HPCC has some significant distinctions. First of all, HPCC uses two types of distributed file systems; one is called Thor DFS that is intended to support Big data ETL in the Thor cluster; the other is called Roxie DFS that is intended to support Big data online queries in the Roxie cluster. Unlike HDFS that is key-value pair based, the Thor DFS is record-oriented, which is flexible enough to support data sets of different formats, such as CSV, XML, fixed or variable length of records, and records with nested structures. Thor DFS distributes a file across all nodes in the Thor cluster with an even number of records for each node. The Roxie DFS uses distributed B+ tree for data indexing to support efficient delivery of data for user queries.
HPCC uses a data-centric, declarative programming language called Enterprise Control Language (ECL) for both data refinery and query delivery. By using ECL, the user specifies what needs to be done on data instead of how to do it. The data transformation in ECL can be specified either locally or globally. Local transforma-tion is carried out on each file part stored in a node of the Thor cluster in a parallel manner, whereas global transformation processes the global data file across all nodes of the Thor cluster. Therefore, HPCC not only pioneers the current Big data com-puting paradigm that moves comcom-puting to where the data is, but also maintains the capability of processing data in a global scope. ECL programs can be extended with C++ libraries and compiled into optimized C++ code. A performance compari-son of HPCC with Hadoop shows that, on a test cluster with 400 processing nodes, HPCC is 3.95 faster than Hadoop on the Terabyte Sort benchmark test [41]. One of the authors of this chapter is currently conducting a more extensive performance comparison of HPCC and Hadoop on a variety of Big data analysis algorithms. More technical details on HPCC can be found in [24,40,41,47].
4
Distributed Data Management Systems for Big Data
Analytics
4.1
Hadoop Distributed File System
The Hadoop Distributed File System (HDFS)6is a distributed file system designed to run reliably and to scale on commodity hardware. HDFS achieves high fault-tolerance by dividing data into smaller chunks and replicating them across several nodes in a cluster. It can scale up to 200 PB in data, and 4500 machines in single cluster. HDFS is a side project of Hadoop and works closely with it.
HDFS is designed to work efficiently in batch mode, rather than in interactive mode. Characteristics of typical applications developed for HDFS, such as write once and read multiple times, and simple and coherent data access, increases the throughput. HDFS is designed to handle large file sizes from Gigabytes to a few Terabytes.
HDFS follows the master/slave architecture with one NameNode and multiple DataNodes. NameNode is responsible for managing the file system’s meta data and handling requests from applications. DataNodes physically hold the data. Typically, every node in the cluster has one DataNode. Every file stored in HDFS is divided into blocks with default block size of 64 MB. For the sake of fault tolerance, every block is replicated into user-defined number of times (recommended to be a minimum of 3 times) and distributed across different data nodes. All meta data about replication and distribution of the file are stored in the NameNode. Each DataNode sends a heartbeat signal to NameNode. If it fails to do so, the NameNode marks the DataNode as failed. HDFS maintains a Secondary NameNode, which is periodically updated with information from NameNode. In case of NameNode failure, HDFS restores a NameNode with information from the Secondary NameNode, which ensures fault-tolerance of the NameNode. HDFS has a built-in balancer feature, which ensures uniform data distribution across the cluster, and re-replication of missing blocks to maintain the correct number of replications.
4.2
NoSQL Databases
Conventionally, Relational Database Management Systems (RDBMS) are used to manage large datasets and handle tons of requests securely and reliably. Built-in features, such as data integrity, security, fault-tolerance, and ACID (atomicity, con-sistency, isolation, and durability) have made RDBMS a go-to data management technology for organizations and enterprises. In spite of RDBMS’ advantages, it is either not viable or is too expensive for applications that deal with Big data. This has made organizations to adopt a special type of database called “NoSQL” (Not an SQL), which means database systems that do not employ traditional “SQL” or adopt the constraints of the relational database model. NoSQL databases cannot pro-vide all strong built-in features of RDBMS. Instead, they are more focused on faster read/write access to support ever-growing data.
According to December 2014 statistics from Facebook [16], it has 890 Million average daily active users sharing billions of messages and posts every day. In order to handle huge volumes and a variety of data, Facebook uses a Key-Value data-base system with memory cache technology that can handle billions of read/write requests. At any given point in time, it can efficiently store and access trillions of items. Such operations are very expensive in relational database management sys-tems.
Scalability is another feature in NoSQL databases, attracting large number of organizations. NoSQL databases are able to distribute data among different nodes within a cluster or across different clusters. This helps to avoid capital expenditure on specialized systems, since clusters can be built with commodity computers.
Unlike relational databases, NoSQL systems have not been standardized and fea-tures vary from one system to another. Many NoSQL databases trade-off ACID prop-erties in favor of high performance, scalability, and faster store and retrieve opera-tions. Enumerations of such NoSQL databases tend to vary, but they are typically categorized as Key-Value databases, Document databases, Wide Column databases, and Graph databases. Figure2shows a hierarchical view of NoSQL types, with two examples of each type.
4.2.1 Key-Value Database
As the name suggests, Key-Value databases store data as Key-Value pairs, which makes them schema-free systems. In most of Key-Value databases, the key is func-tionally generated by the system, while the value can be of any data type from a character to a large binary object. Keys are typically stored in hash tables by hashing each key to a unique index.
All the keys are logically grouped, eventhough data values are not physically grouped. The logical group is referred to as a ‘bucket’. Data can only be accessed with both a bucket and a key value because the unique index is hashed using the
bucket and key value. The indexing mechanism increases the performance of stor-ing, retrievstor-ing, and querying large datasets.
There are more than 40 Key-Value systems available with either commercial or open source licenses. Amazon’s DynamoDB,7which is a commercial data storage system, and open source systems like Memcached,8Riak,9and Redis10are most pop-ular examples of Key-Value database systems available.These systems differ widely in functionality and performance.
Key-Value databases are appropriate for applications that require one to store or cache unstructured data for frequent and long-term usages, such as chat applica-tions, and social networks. Key-Value databases can also be used in applications that require real-time responses that need to store and retrieve data using primary keys, and do not need complex queries. In consumer-faced web applications with high traf-fic, Key-Value systems can efficiently manage sessions, configurations, and personal preferences.
4.2.2 Wide Column Database
A column-based NoSQL database management system is an advancement over a Key-Value system and is referred to as a Wide Column or column-family database. Unlike the conventional row-centric relational systems [22], Wide Column databases are column centric. In row-centric RDBMS, different rows are physically stored in different places. In contrast, column-centric NoSQL databases store all correspond-ing data in continuous disk blocks, which speeds up column-centric operations, such as aggregation operations. Eventhough Wide Column is an advancement over Key-Value systems, it still uses Key-Key-Value storage in a hierarchical pattern.
In a Wide-Column NoSQL database, data are stored as name and value pairs, rather than as rows, which are known as columns. Logical grouping of columns is named as column-family. Usually the name of a column is a string, but the value can be of any data type and size (character or large binary file). Each column con-tains timestamp information along with a unique name and value. This timestamp is helpful to keep track of versions of that column. In a Wide-Column database, the schema can be changed at any time by simply adding new columns to column-families. All these flexibilities in the column-based NoSQL Systems are appropriate to store sparse, distributed, multidimensional, or heterogeneous data. A Wide Col-umn database is appropriate for highly scalable applications, which require built-in versioning and high-speed read/write operations. Apache Cassandra11 (Originated by Facebook) and Apache HBase12 are the most widely used Wide Column data-bases.
7http://aws.amazon.com/dynamodb/. 8http://memcached.org/.
9http://basho.com/riak/. 10http://redis.io/.
4.2.3 Document Database
A Document database works in a similar way as Wide Column databases, except that it has more complex and deeper nesting format. It also follows the Key-Value stor-age paradigm. However, every value is stored as a document in JSON,13XML14or other commonly used formats. Unlike Wide Column databases, the structure of each record in a Document database can vary from other records. In Document databases, a new field can be added at anytime without worrying about the schema. Because data/value is stored as a document, it is easier to distribute and maintain data locality. One of the disadvantages of a Document database is that it needs to load a lot of data, even to update a single value in a record. Document databases have built-in approach of updating a document, while retaining all old versions of the document. Most Doc-ument database systems use secondary indexing [26] to index values and documents in order to obtain faster data access and to support query mechanisms. Some of the database systems offer full-text search libraries and services for real-time responses. One of the major functional advantages of document databases is the way it inter-faces with applications. Most of the document database systems use JavaScript (JS) as a native scripting language because it stores data in JS friendly JSON format. Fea-tures such as JS support, ability to access documents by unique URLs, and ability to organize and store unstructured data efficiently, make Document databases popular in web-based applications. Documents databases serve a wide range of web applica-tions, including blog engines, mobile web applicaapplica-tions, chat applicaapplica-tions, and social media clients.
Couchbase15 and MongoDB16 are among popular document-style databases. There are over 30 document databases. Most of these systems differ in the way data are distributed (both partition and replications), and in the way a client accesses the system. Some systems can even support transactions [23].
4.2.4 Graph Databases
All NoSQL databases partition or distribute data in such a way that all the data are available in one place for any given operation. However, they fail to consider the rela-tionship between different items of information. Additionally, most of these systems are capable of performing only one-dimensional aggregation at a time.
13http://json.org.
14http://www.w3.org/TR/2006/REC-xml11-20060816/. 15http://couchbase.com/.