Published by Oxford University Press on behalf of the American Association for Public Opinion Research 2015.
AN ANALYSIS OF THE MIXED COLLECTION MODES
FOR TWO BUSINESS SURVEYS CONDUCTED BY THE
US CENSUS BUREAU
KATHERINE JENNY THOMPSON*
BRODERICK OLIVER JENNIFER BECK
Abstract In the past decade, offering multiple modes of data collec-tion has become increasingly popular. However, the benefits of offering multiple modes should not come at the cost of data quality. Using his-toric data from two federal business surveys, we investigate data quality as a function of mode of data collection using various quality measures, including the unit response rate (the unweighted proportion of respond-ing reportrespond-ing units) and the quantity response rate (the weighted propor-tion of an estimate obtained from reported data).
Introduction
Many federal data-collection programs are experiencing reductions in survey funding, coupled with continuous demand to increase their data products and reduce the time from collection to release. To meet these demands, survey organizations have looked for ways to simultaneously improve data-collec-tion procedures and reduce costs. In recent years, web survey collection has become increasingly appealing, largely because of the potential cost reduc-tions this mode of data collection can afford.
Katherine Jenny Thompson, Broderick Oliver, and Jennifer Beck are survey methodologists in the General Methods Area of the Economic Statistical Methods Division at the US Census Bureau, Washington, DC, USA. The authors thank Jeffrey Dalzell, James Hunt, Xijian Liu, Peter Miller, Aidan Smith, Diane Willimack, three anonymous reviewers, and the editors for their useful comments on earlier versions of this manuscript, and Daniel Whitehead for his assistance with the graphs. This research was undertaken at the US Census Bureau under the authorization of the Associate Director for Economic Programs. Any views expressed in this paper are those of the authors and not necessarily those of the US Census Bureau. *Address correspondence to Katherine Jenny Thompson, US Census Bureau, Methodology Director for Complex Survey Methods and Analysis, Economic Statistical Methods Division, 4600 Silver Hill Drive, Washington, DC 20233,
USA; e-mail: [email protected].
doi:10.1093/poq/nfv013
at New York University on February 10, 2016
http://poq.oxfordjournals.org/
With these goals in mind, the US Census Bureau is strategically increasing the use of web data collection in both household and business surveys over other modes of data collection. While these initiatives affect household and business surveys, this paper focuses entirely on business survey applications that allow multimode data collections.
There has been considerable research on the advantages of multimode data collection and its effects on data quality over the past several decades (see de Leeuw [1992, 2005] for reviews). Offering multiple modes can (1) provide access to different types of people or businesses; (2) attract different types of respondents; and (3) elicit different responses, all of which have an effect on overall survey-data quality (Jäckle, Roberts, and Lynn 2010). In this paper, we explore the ideas of mode-based response differences and the types of respondents each mode attracts.
In household surveys, telephone (CATI) and face-to-face interview (CAPI) modes, long viewed as gold standards, can have advantages. Trained inter-viewers are able to probe respondents to answer questions and provide clarifi-cation. As a result, these modes tend to have higher response rates and lower item nonresponse than self-administered modes (de Leeuw 1992). However, CATI and CAPI modes can result in lower data quality for sensitive items (de Leeuw 1992). Respondents are more likely to satisfice and endorse socially desirable responses, especially in the CATI mode (Holbrook, Green, and Krosnick 2003; Kreuter, Presser, and Tourangeau 2008).
However, while interviewer-administered modes seem to elicit bet-ter data quality, they are often costly. Introducing a web mode allows for a more cost-effective approach compared to trained interviewers. In the past decade, researchers have explored the benefits of web data collection (see
Couper [2000, 2008] for reviews). There is evidence that introducing a web mode results in lower overall response rates (Manfreda and Vehovar 2008). However, this decrease in response rate could be the result in part of offer-ing the web concurrently with other modes. On the other hand, offeroffer-ing the web sequentially as the only initial response mode does not always decrease response rates (Millar, O’Neill, and Dillman 2009; Medway and Fulton 2012).
Web surveys can also have lower item nonresponse and a decrease in social desirability biases (Kaplowitz, Hadlock, and Levine 2004; Kreuter, Presser, and Tourangeau 2008). One potential driver of this increase in quality is the opportunity to implement complex skip patterns and real-time edits (Kerwin et al. 2004). These skips and edit checks within a web instrument serve to correct reporting errors and discourage item nonresponse before respondents submit their responses (Peytchev and Crawford 2005).
Although business-survey respondents grapple with the same cognitive response process as household-survey respondents, their response exists within the larger context of the business (Willimack and Nichols 2010). This context affects the way that respondents approach the business survey response task. These differences usher in different considerations for multimode collection and the resultant data quality.
at New York University on February 10, 2016
http://poq.oxfordjournals.org/
Unlike household surveys, business surveys tend to be self-administered and—with a few exceptions—do not use CAPI or CATI as primary modes during data collection (Christianson and Tortora 1995; Nicholls et al. 2000). At the US Census Bureau, initial contact with the respondent is by mail (ques-tionnaire or letter), but businesses are provided with the option of responding by mail, web, fax, or telephone (Nicholls et al. 2000).
Business surveys conducted at the US Census Bureau limit telephone data collection to nonresponse follow-up of selected businesses (generally, large businesses), and the contacts are often limited to reminder calls. Survey ana-lysts, not trained interviewers, make these calls, losing some of the advan-tages that are usually obtained with field or telephone interviewing, such as the “ability to motivate, probe, and assist” the respondent (Couper 2011, 901). Anecdotal evidence suggests that analysts also tend to ask respondents for a few key data items, rather than encouraging the respondent to complete the entire survey, and that the respondent may provide only quick estimates rather than calculated values (Willimack, Anderson, and Thompson 2000).
Nearly all of the business surveys at the US Census Bureau offer a web or electronic reporting option (Anderson and Tancreto 2011). Similar to the findings for household surveys, the results from business surveys indicate mixed results with the introduction of the web mode. There is some evidence that offering a web mode as the only response mode can reduce the overall response rate (Bremner 2011). However, this reduction in response rates may be the result of the burden businesses face in initially adapting to a new col-lection procedure (Gravem, Haraldsen, and Lofgren 2011). Research on mode switching in household surveys suggests that respondents become entrained in a particular mode (Millar, O’Neill, and Dillman 2009) and may initially resist the switch to another mode. Preliminary results from experiments con-ducted on web response push to the 2012 Economic Census suggest that new businesses that have never responded to a Census Bureau survey before opt to respond on the web in higher proportions when given only the web option, without a detrimental effect on overall response rates (Marquette and Kornbau 2013). The design of the web instrument also affects the choice to switch to the web mode. If the instrument is not carefully designed considering the limi-tations of the mode and their interaction with questionnaire design, then the web instrument may increase the response burden, making it less likely that a business may use that mode (Haraldsen et al. 2013).
Despite mixed results of multimode web collection in business surveys, web collection appears to provide similar benefits in data quality for busi-ness surveys as found in household surveys. Busibusi-ness web surveys can result in decreased burden and higher response quality, if the instrument is well designed for the web (Lofgren 2011). Hoogland and Smit (2008) report more consistency of response among items, along with a reduction of missing values on the web as compared to paper collection, especially for large businesses. Other research supports this idea of increased quality via web collection,
at New York University on February 10, 2016
http://poq.oxfordjournals.org/
showing that electronic data-collection instruments for business surveys, such as those that employ spreadsheet applications that are familiar to respondents, can improve data quality by aiding the data-retrieval and -collection process (Willimack and Nichols 2010).
In addition to the mode of data collection, the quality of the reported data is also affected by other factors, such as type of data collected and survey design. First, business survey publication statistics are generally industry totals or per-centage change. For example, a survey may provide data on the total monthly retail sales or percent increase or decrease from the prior month’s sales for grocery stores. Second, business samples generally have very different char-acteristics from their household counterparts. Business populations are highly skewed. The majority of a tabulated total in a given industry often comes from a small number of large businesses. For example, a large national chain of department stores would likely contribute a very high proportion of the total shoe sales in a given year, in contrast to the proportion the smaller specialty stores contribute. Consequently, business surveys often employ single-stage samples with highly stratified designs that include the “largest” businesses with certainty and sample the remaining “smaller” businesses. Therefore, missing data from the largest cases can induce substantive nonresponse bias in the totals, whereas missing data from the smaller cases (even those cases with large sampling weights) often have little effect on the tabulation levels or the overall level of nonresponse bias (Thompson and Washington 2013).
Because of their important contribution to survey totals, larger businesses are treated differently. Research on collection methods and contact strategies has been largely confined to obtaining accurate reported data from large busi-nesses (see Paxson, Dillman, and Tarnai 1995; Sudman et al. 2000; Tuttle, Morrison, and Willimack 2010; Willimack and Nichols 2010; Haraldsen et al. 2013). This research suggests that there are differences in data quality between large and small businesses. If the survey collects many items or requests addi-tive details that sum to collected totals (for example, requesting that respond-ents report the percentage of revenue obtained from a series of different products), then the larger businesses are much more likely to provide data than are the smaller businesses (Thompson and Washington 2013). Smaller businesses may not keep track of all the detailed data items (Willimack and Nichols 2010), or they may perceive the burden of responding to the survey as a whole as being too high (Bavdaž 2010).
Moreover, survey operation procedures increase the likelihood of obtain-ing valid responses from large units. The larger businesses on the whole are more likely to be contacted personally if there are questions about the data or as planned unit nonresponse follow-up; smaller business are mailed reminder letters, but rarely receive telephone reminders. Furthermore, auxiliary data are likely available to validate these larger units’ responses, for example, tax data and financial reports (Haraldsen 2013). Survey analysts may perform addi-tional comparisons besides machine edits, researching auxiliary data sources
at New York University on February 10, 2016
http://poq.oxfordjournals.org/
such as publicly available financial reports, and replacing imputed values with equivalent data (Thompson and Oliver 2012). Together, these efforts can result in differences in quality between small and large businesses.
This paper examines business survey data quality associated with the mode in which they were collected using historic data from two business surveys. Although the term “quality” does not have a single accepted definition, statis-tical agencies and organizations often define data quality by various dimen-sions. For example, Eurostat (2003) identifies six dimensions of data quality: relevance, accuracy, timeliness, accessibility and clarity, comparability, and coherence. Biemer and Lyberg (2003, 14) state that of these dimensions, accu-racy is the most important, because “without accuaccu-racy, other quality features are irrelevant.” However, accuracy is usually defined in terms of total survey error (i.e., sampling error + nonsampling error), and is difficult, if not impos-sible, to measure. For this paper, we use the term “data quality” (or “quality”) as a synonym for reporting accuracy.
Our analysis framework explicitly links quality to post-collection data-processing procedures, specifically editing, imputation, and analyst review. The first two procedures are applied automatically to the collected data and are designed to obtain accurate tabulations from both large and small busi-nesses. Analyst review is performed selectively after automatic processing is completed (some cycling between automatic machine editing and analyst review and corrections will occur). Both of the surveys we use in this analy-sis use the Standard Economic Processing System (StEPS) developed at the US Census Bureau (Sigman 2001), which implements standard data-flagging rules, respondent definitions, and response rate computations.
As mentioned earlier, data from larger businesses receive more scrutiny than data from small businesses. Our evaluation examines interactions between unit size and collection mode, noting that for the smaller cases that may be reviewed only by automated edits, the effectiveness of the considered mode of data col-lection for obtaining accurate reported data is especially important. Following the precedent set in the statistical data-editing literature (Fellegi and Holt 1976;
Charlton 2004), we assume that as the percentage of retained “reported data” increases, the quality of the collected data likewise increases. If all businesses in a survey are voluntarily moving toward web collection at a similar rate, then we should see an across-the-board increase in the web response rates. If the web collection does indeed result in “higher-quality” data, then we would like-wise expect to see a higher percentage of retained reported data obtained from web collection than for that obtained by the other modes.
Methods
In this section, we describe business survey units and present metrics devel-oped in the business survey context, then describe the two ongoing business surveys used in our analysis.
at New York University on February 10, 2016
http://poq.oxfordjournals.org/
BUSINESS SURVEY UNITS
Several sample design and data-collection concepts are fundamental to busi-ness surveys. First, many surveys need to distinguish between the survey (sampling) unit, the reporting unit, and the tabulation unit. A survey unit is a business selected from the underlying statistical population of similarly con-structed units (i.e., from the sampling frame). A reporting unit is an entity from which data are collected. Finally, a tabulation unit houses the data used in estimation, representing the data at the level used in tabulation. Unlike the reporting unit, which represents a physical entity, the tabulation unit can be an “artificial” construct used for data storage.
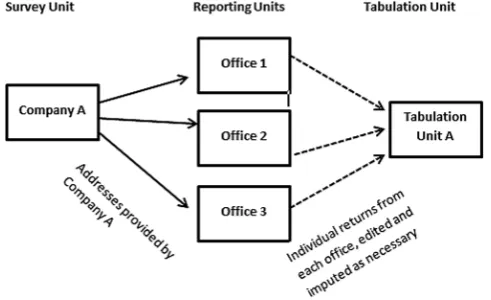
In a household survey, the reporting units are the tabulation units. With a business survey, the reporting unit and the tabulation unit can differ, especially when the survey unit is a company that has more than one location or that operates in several different industries. The reporting units are the vehicle for obtaining data, voluntarily established by the survey unit(s) for their conveni-ence. For example, a firm may establish a special reporting agreement with the US Census Bureau for data collection, as illustrated in figure 1. In this example, a separate questionnaire is sent to each office address designated by company A. The company completes questionnaires for each of the addresses. After minimal processing, the Census Bureau creates a single tabulation unit from the consolidated responses of the complete set of reporting units (offices 1, 2, and 3).
Alternatively, a sampled company may operate in multiple industries. For surveys that publish industry-level data, to ease respondent burden, a single paper questionnaire covering all pertinent industries is mailed to the
Figure 1. Illustration of Multiple Reporting Units Associated with a Single Tabulation Unit. The reporting units may change by statistical period due to changes in the survey unit such as mergers, acquisitions, or divestitures.
at New York University on February 10, 2016
http://poq.oxfordjournals.org/
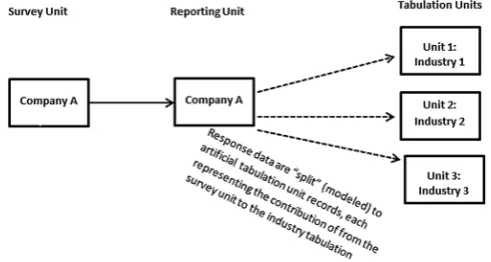
administrative office of company A, as shown in figure 2. Upon processing, these response data are allocated (“split out”) among tabulation units, using percentage distributions provided by company A or industry models.
In a household survey, the survey unit (the sampled address) remains con-stant, although the people interviewed in the household may change. In a business survey, the original definition of the survey unit may change in com-position over time (perhaps due to mergers, acquisitions, or divestitures), and the associated reporting and tabulation units may likewise change.
Following the US Census Bureau Quality Standards (Methodology and Statistics Council 2012), a respondent to a business survey is an eligible
reporting unit for which an attempt was made to collect data, the unit belongs to the target population, and the unit provided sufficient data to be classified as a response. This definition was developed collaboratively by an interdivi-sional team using the guidelines established in AAPOR (2008) as a baseline. Surveys establish required data items along with minimally sufficient condi-tions for categorization as a response.
SURVEYS
The Quarterly Services Survey (QSS) is a principal economic indicator that produces quarterly estimates of total operating revenue for businesses and the percentage of revenue by class of customer (government, business, consumers, and individuals) for selected services industries in the United States, as well as estimates of total operating expenses from tax-exempt businesses in industries that have a large not-for-profit component. Participation is voluntary.
The QSS sample includes approximately 19,000 service businesses with paid employees. The QSS sample is a subsample of the Service Annual Survey (SAS) sample, whose frame is the Census Bureau’s Business Register (BR); the BR contains all Employer Identification Numbers (EINs) for listed
Figure 2. Illustration of Single Reporting Unit with Multiple Tabulation Units. The tabulation units are “artificial” entities created for tabulation.
at New York University on February 10, 2016
http://poq.oxfordjournals.org/
businesses and locations of multi-establishment companies. EINs may repre-sent one or more establishments (physical locations of business), and com-panies may have one or more EINs. New SAS and QSS samples are selected every five years. These samples are updated quarterly to reflect births (new businesses since the original sample selection) and deaths (businesses that are no longer in operation).
The QSS reporting unit is the survey unit (company or EIN), and tabulation units are created to house industry-level data (see figure 2). Survey units are stratified by industry group and are further sub-stratified by a measure of size related to their annual revenue. The QSS is a stratified systematic probability proportional-to-size sample, taken independently within substratum. The larg-est companies (exceeding predetermined size cutoffs) are included with cer-tainty (sampling probability = 1); otherwise, the sampling unit is an EIN. See
http://www.census.gov/services/qss/qsstechdoc.html for more details.
The QSS businesses may respond by web, mail, fax, or telephone (analyst phone contact, clerk phone contact, respondent phone-in, and touchtone data entry). We examine the first three modes separately, grouping the telephone methods into a single “other” category. The QSS collects revenue from all sampled units and operating expenses from a subset of units, depending on the industry in which the unit operates. (See the online appendix for examples.) Administrative data for revenue are often available for the large sampled QSS businesses and are considered to be of equivalent quality as the collected data. Large companies may offer additional alternative sources of available data for replacement values or for validation of either reported or administrative values.
Comparable administrative data for the smaller units are likewise available, but are less easily verifiable. Because there are very few sources of alternative data to use for verification or substitution with the smaller units, analysts are unlikely to examine a processed value from a noncertainty unit; the generally practiced procedure is to accept the machine impute.1
These analyses examine survey data from the first quarter of 2009 (2009Q1) to the last quarter of 2011 (2011Q4).
The Annual Capital Expenditures Survey (ACES) provides data on capital spending for new and used structures and equipment by US businesses (non-farm) with and without employees. Participation is mandatory.
Each year, ACES selects a new sample of companies using the BR as a frame. The ACES universe comprises two separate populations, each sampled independently with a stratified simple random sample design. The larger sam-ple (ACE-1) comprises 46,427 companies with paid employees. Companies are stratified by industry based on the primary business activity. All companies
1. As one referee pointed out, this lack of available alternative data for independent verification could cause differential bias or measurement error effects, as larger units are systematically exam-ined and treated in a different way than the smaller units.
at New York University on February 10, 2016
http://poq.oxfordjournals.org/
that employ 500 or more employees are included with certainty. The remain-ing companies are grouped into substrata within industry based on size deter-mined by BR payroll and sampled. The smaller sample (ACE-2) comprises 14,981 businesses without paid employees. These companies are grouped into four strata, each sampled independently. Reporting units are established by the company in collaboration with the Census Bureau; the reporting-unit data are aggregated to create tabulation units (see figure 1). For more details on the ACES design and estimation procedures, see http://www.census.gov/econ/ aces/.
The ACES collection instrument is complex. Answering between two and five separate items, each company reports its total capital expenditures value2
during the studied time period. Further on, ACE-1 businesses that operate in more than one industry are asked to break down the aggregate company level totals by industry. The more detailed breakdown values must add to the earlier reported totals collected. (See the online appendix for examples.) ACES adds a more detailed data collection every five years, where the industry data are fur-ther broken down by structures and equipment purchase categories. Response rates for ACES tend to decline during these more detailed collection years (2003, 2008, and 2012 were such years). Unlike the QSS, administrative data are not available for the ACES sample units, although some of the larger pub-licly held companies may publish their annual capital expenditures, which the analysts may use for validation.
Currently, the most prevalent modes of collecting respondent data are mail, the web, and fax (again, to a lesser extent than the other modes). We grouped analyst phone contact, clerk phone contact, and respondent phone-in into a single “other” category. We use historical data from the 2002 through 2011 data collections, but note that ACES introduced web collection in 2006.
DATA-QUALITY MEASURES
To assess the differences in quality across modes and to see if those differ-ences are limited to larger businesses, we examine three quality measures: the Unit Response Rate, the Quantity Response Rate, and the Source of Data Item. Each measure can be produced at the survey level as a single measure or for mutually exclusive domains such as sampling unit type (certainty or non-certainty3) or modes of data collection. Wagner (2012) presents a typology of
indicators for assessing and monitoring nonresponse bias. Our proposed qual-ity measures fall into all three categories: (1) response indicator; (2) response
2. The value is first collected as a component of the “Domestic Depreciable Asset Data” complex. This value is the overall total of the “Domestic Capital Expenditures Data,” a 2 x 3 matrix with the total capital expenditures value broken down by expenditures on Structures, Equipment, and Other categories (rows) and by New and Used Structures or Equipment (columns).
3. We use certainty status (certainty units versus noncertainty units) as a proxy for unit size, as they represent the largest businesses in the QSS and ACES samples.
at New York University on February 10, 2016
http://poq.oxfordjournals.org/
indicator and sampling frame data/paradata; and (3) response indicator, sam-pling frame data/paradata, and survey data.
The Unit Response Rate (URR) is the unweighted proportion of responding reporting units, computed as
where R is the number of reporting units that were classified as respondents,
E is the number of reporting units, and U is the number of survey units whose eligibility could not be determined. This is a conservative response rate that is not expected to reach 100%, as the units in U may not all be in-scope for the survey. Units that are validated as out-of-scope are dropped from the denomi-nator. Computed at the survey level, this is a Type 1 indicator, as described in
Wagner (2012); subgroup rates are Type 2 indicators.
Examining the URR at the total survey level is, at best, a poor indicator of survey quality (Peytcheva and Groves 2009), but provides insight into the effectiveness of the overall collection. By comparing the contribution to the URR by modes of data collection, we can assess preference for a particular mode. By examining the interaction between mode of data collection and unit size, we can assess whether the preference for a given mode is confined to a particular category of unit. If large and small businesses are using the web at equal rates, then we would expect to see approximately equal web URR values for the large and small units.
Since smaller units tend to have large sampling weights, computing an
unweighted rate reduces the influence of small units on the program-level URR. However, it ignores the varying effects on the estimates of totals from the larger units. This deficiency is addressed by the Quantity Response Rate (QRR). The QRR is the weighted proportion of an estimated total obtained from
reported data. Unlike the URR, each data item has its own QRR, so there may be several QRR measures per survey. The QRR for a given item y is given by
QRR Y
where YˆR is the unbiased sample-weighted estimate for item y obtained from
respondent data and Yˆis the survey total estimate of the item obtained using the item’s final (edited/imputed) value weighted by the sampling weight and a nonresponse adjustment factor (as applicable). These are Type 3 indicators in the Wagner nomenclature.
The QRR for an item approaches 100 percent when the majority of the esti-mated total is obtained from reported data. Some cautions must be used in inter-preting the QRR. First, if the largest units in the survey provide the majority of the tabulation data for an item, then the QRR could approach 100 percent, while
at New York University on February 10, 2016
http://poq.oxfordjournals.org/
the realized URR could be quite low if a high percentage of the smaller units did not respond. Second, the denominator of a QRR for an item will change by statistical period, and consequently comparability of this measure over time is slightly compromised. By comparing the contribution to the QRR of an item by data-collection mode, we can assess the quality of the data that was obtained via the considered mode. If a given mode is obtaining more accurate response data compared to other modes, then we would expect the QRR for a given collection mode to be higher than the QRR obtained from the other modes.
Our case studies use their surveys’ respondent classifications. The QSS respondents have a valid reported value of revenue after processing. Consequently, corresponding URR and QRR values tend to be very close. Large and small busi-nesses in the QSS tend to report at the same rates: During the studied collection periods, the average URR is 63.8 percent, with the certainty unit and noncertainty unit average URR values equaling 69.0 and 62.2 percent, respectively. The corre-sponding average QRR values for revenue are 67.8 percent (survey), 67.3 percent (certainty units), and 68.5 percent (noncertainty units), respectively.
The ACES respondents have a valid value for at least one of the requested capital expenditures items. We present results for total capital expenditures, as we obtained very similar results for capital expenditures on structures and capital expenditures on equipment. The ACES response classification proce-dure depends on a combination of item responses, and selected key items can have relatively low QRR after processing.
In contrast to the QSS, corresponding URR and QRR values for ACES can be quite different. Historically, larger sampled units report the majority of the tabulated capital expenditures for the survey; reported values of zero capital expenditures are legitimate and expected from the majority of small noncertainty units. During the studied collection periods, the average URR is 73.8 percent, with the certainty unit and noncertainty unit average URR values equaling 85.8 and 69.02 percent, respectively. However, the corresponding average QRR values for total capital expenditures are 90.4 percent (survey), 96.7 percent (certainty units), and 75.9 percent (noncertainty units), respec-tively. In short, the noncertainty cases report at a much lower rate than the certainty cases, but the majority of the capital expenditures values are reported by the large certainty companies. Consequently, the majority of the survey’s tabulations are obtained from directly reported values.
Finally, the Source of Data Item (SDI) measures the proportion of respond-ing units that retain their reported data (i.e., reported value equals edited value) for an item. Similar to the URR, this proportion uses unweighted counts. The SDI is a Type 2 indicator in the Wagner nomenclature, even though response status for an item depends on the survey data collection. For multimode data collection, we compare the SDI for a given item by mode to determine whether there are particular modes of data collection that retain a higher proportion of the reported data. If the mode of data collection is resulting in higher-quality data, then the SDI will approach 100 percent.
at New York University on February 10, 2016
http://poq.oxfordjournals.org/
Results
The first goal of our study was to determine whether the increased use of web collection in the QSS and the ACES programs is an across-the-board phenom-enon or is confined to the larger businesses. We begin by examining the URR for each program by mode of data collection (mail, web, fax, other) to deter-mine whether a particular mode is preferred for reporting. Then we exadeter-mine the percentage of retained reported data in the tabulated totals (QRR). Recall that the number of large (certainty) units in each program represents a fairly small fraction of the total number of sampled units in these programs. Thus, a specific mode that accounts for a high percentage of the responding cases provides preliminary evidence that size of unit is not a factor in mode choice. Given the disproportionate contribution to survey totals from the certainty businesses, a collection mode that accounts for a low percentage of the URR and a high percentage of the QRR for a key item suggests that the referenced mode of collection is primarily preferred by the larger units.
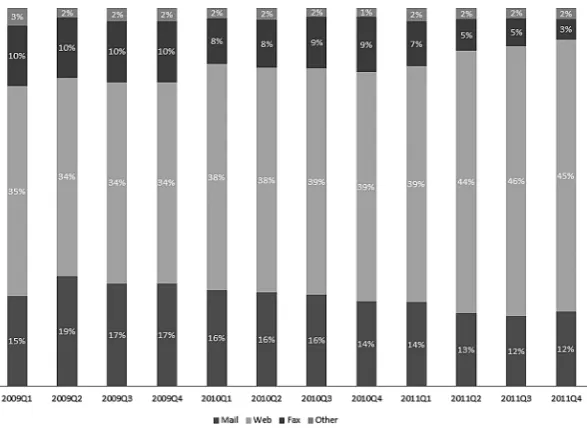
Figure 3 presents the contribution of each mode of data collection to the program-level URR for the QSS. The presented values add to the QSS URR for the statistical period, not to 100 percent; the contribution to the URR by mode within quarter is computed as the number of respondents using mode divided by the total number of eligible units in the statistical period. (Note: The QSS URR process is quite stable, so the heights of the bars may appear to be the same.) Since the first quarter of 2010, web collection has steadily increased, and mail and fax collection have likewise decreased. The relatively
Figure 3. QSS URR by Mode of Data Collection (2009–2011).
at New York University on February 10, 2016
http://poq.oxfordjournals.org/
large increase in the percentage of units reporting by web in the second quarter of 2011 (2011Q2) corresponds with a change in the QSS collection process. Prior to this quarter, the first follow-up procedure for nonresponding cases was to fax a questionnaire. From 2011Q3 onward, the QSS changed the pro-cedure and now only faxes a username and password to these cases. Although the results are not presented here, the QSS QRR for receipts shows the same stable pattern.
The preceding analyses demonstrate that web reporting is consistently the most prevalent mode of data collection for the QSS. However, they do not tell us whether this prevalence is related to the size of the reporting unit. Logically, one might consider examining the URR by size of unit (certainty/noncertainty) and collapsed mode of data collection (web versus non-web). However, the number of certainty cases in the QSS sample is relatively small, as is typical of a business survey, and therefore could be easily affected in either direction by the inclusion or deletion of a few reporting units. Instead, we examine the QRR. Table 1 presents the QSS QRR by mode of collection at the survey level and by size of unit.
Regardless of unit size category, after 2009Q2, the QRR percentage of rev-enue obtained by web collection is consistently much higher than the percent-ages obtained from the other collection methods. For QSS, data collection by web appears to be unrelated to unit size, with generally marginal differences between corresponding values for certainty and noncertainty units. However, the percentage of retained reported revenue values is generally not high, with the maximum value for the program at 76 percent over the studied time period.
Turning to the ACES, figure 4 presents the contribution of each mode of data collection to the program-level URR. The percentage values collected by fax and the other modes are not displayed but together contribute less than 2 percent. The usage of web collection has been climbing steadily since its introduction to ACES in 2006, while the other modes of data collection have been simultaneously declining. However, mail collection remained the most prevalent method of data collection until 2011.
Figure 5 examines ACES QRR for total capital expenditures by mode of data collection. Here, we find indications of a relationship between unit size and selected mode of data collection. Web response accounts for an increasing percentage of retained reported data, but the majority of the tabulated capital expenditures values are generally provided by the certainty units. Considering the high proportion of reporting units that respond by mail (see figure 4), this provides an indication that the smaller businesses (comprising the majority of the sampled units) are using the web for data collection at a lesser rate than the larger businesses.
The QRR values provided in table 2 support this conclusion. The contribu-tion to the certainty unit QRR for total capital expenditures from web collec-tion has steadily increased since 2008, whereas the noncertainty units appear
at New York University on February 10, 2016
http://poq.oxfordjournals.org/
to be utilizing web and non-web collection modes at nearly the same rate. In contrast to the QSS results, the larger businesses tend to retain a high percent-age of reported data (overall), while the percentpercent-ages reported by the noncer-tainty (smaller) units are considerably less.
Examining the QRR by mode of data collection and size of unit indirectly addresses our second research question of whether web collection appears to be improving data quality in terms of preserved reported data in key items. To Figure 4. ACES URR by Modes of Data Collection (2002–2011).
Table 1. QSS QRR for Revenue by Mode of Data Collection and Unit Size (2009Q1–2011Q4)
Survey level Certainty units Noncertainty units
QRR %
Web %
Non- web %
QRR %
Web %
Non- web %
QRR %
Web %
Non- web %
2009Q1 72 40 32 77 39 38 68 40 28
2009Q2 63 27 36 56 23 33 69 30 39
2009Q3 76 48 29 83 55 29 71 43 28
2009Q4 64 42 22 61 40 21 67 44 23
2010Q1 67 45 22 66 45 21 68 45 23
2010Q2 68 47 21 67 49 18 70 46 24
2010Q3 69 48 21 68 49 19 69 46 24
2010Q4 65 46 19 64 46 18 67 46 21
2011Q1 67 48 19 66 48 18 67 47 21
2011Q2 69 54 15 68 54 15 69 54 15
2011Q3 69 56 14 70 58 13 68 53 15
2011Q4 64 51 13 60 49 11 67 52 15
at New York University on February 10, 2016
http://poq.oxfordjournals.org/
directly address this, we examine the SDI by collection mode and unit size.
Table 3 presents the QSS SDI for revenue and the ACES SDI for total capital expenditures, using measures from the five most recent statistical periods.
The percentage of retained reported QSS data is extremely high regardless of mode of collection or unit size (93 percent or greater). There is a slightly higher percentage of retained reported data with the noncertainty units regardless of collection mode, consistent with the observation from the survey manager that the analysts are more likely to “accept” a reported value from a noncertainty unit in the absence of other information. Recall that the QSS questionnaire is quite straightforward and collects very few items. Hence, there is very little reporting burden associated with the survey. On occasion, the certainty units have lower retention rates than their noncertainty counterparts within the same Figure 5. ACES QRR for Total Capital Expenditures by Mode of Data Collection (2007–2011).
Table 2. ACES QRR for Total Capital Expenditures by Mode of Data Collection and Unit Size (2007–2011)
Program level Certainty units Noncertainty units
QRR %
Web %
Non- web %
QRR %
Web %
Non-web %
QRR %
Web %
Non-web %
2007 90 47 43 97 54 43 76 32 44
2008 90 57 33 97 64 32 77 41 36
2009 90 61 29 97 71 25 77 39 38
2010 91 66 25 97 77 20 76 39 36
2011 90 70 20 96 81 15 74 43 31
at New York University on February 10, 2016
http://poq.oxfordjournals.org/
Table 3. SDI for Key QSS and ACES Items by Unit Size and Mode of Collection
Unit size
Mode of collection
QSS ACES
2010Q4 %
2011Q1 %
2011Q2 %
2011Q3 %
2011Q4 %
2007 %
2008 %
2009 %
2010 %
2011 %
Certainty Mail 94 97 96 93 96 81 70 80 77 76
Web 94 95 94 94 94 87 78 88 89 90
Fax 96 94 96 94 94 74 65 73 69 78
Other 93 96 98 98 93 52 31 38 27 35
Noncertainty Mail 99 99 98 98 98 80 78 85 83 84
Web 98 98 97 97 97 85 85 91 92 93
Fax 98 99 98 98 97 78 77 80 91 83
Other 97 98 99 97 98 70 26 43 28 43
Thompson, Oliv
er
, and Bec
k
mode. That is, analysts appear to alter or use alternate source data at a higher rate for certainty cases than for noncertainty cases, which makes sense, as large companies are more likely to have valid alternate source data.
For ACES, the corresponding SDI values collected by web or mail are very close regardless of unit size. Again, the reported item values are more consist-ently retained for the noncertainty units. Of course, noncertainty units tend to report zero valued capital expenditures, and it is unlikely that an analyst would impute a non-zero value in the absence of any other evidence, such as direct contact with the respondent. With the certainty units, a higher percentage of reported data are retained under web collection than mail. The majority of the ACES automated edits check for additivity and for consistency (i.e., that the same reported value for total capital expenditures is entered throughout the form). It appears that mail response lends itself to violation of these rules more than web response.
Discussion
In this paper, we apply several measures to historical data from two separate business surveys to evaluate the effects of mixed modes of data collection on data quality. Our metrics include measures of completeness (URR) and accu-racy in terms of obtaining valid reported data (the QRR and SDI) that are easily computed from production data. The QRR and SDI are especially appealing to survey programs that strive to maximize the usage of reported data in the tabulations over imputed values (otherwise, why conduct the survey?).
Both studied surveys have highly stratified sample designs. There are, how-ever, other important differences between the two surveys. First, the revenue data collected by the QSS are expected to be non-zero for the majority of the sampled units, and corresponding values are often available from alternative source data. With ACES, not all companies capitalize their expenditures, many small companies report legitimate zero values, and administrative data are not available. Second, the data-collection instrument for the QSS is straightfor-ward, with few items collected. The ACES data-collection instruments require complex additive matrices. The item definitions (data concepts) for the ACES are also quite complex.
Our analyses assume that the implemented machine edits are very effective in locating erroneous data, and that the retained reported data are valid. With business surveys, program managers strive to reduce the proportion of imputed values in the tabulated totals. Consequently, analysts search for alternative “equivalent quality” values to replace machine-imputed values when possible. Such alternative data sources are more often available for large businesses. As shown with the QSS results, less reported data might actually be retained for the larger cases when viable options for substitution exist; similarly, analysts may restore reported data for a smaller case that fails less important edits instead of accepting a machine-impute.
at New York University on February 10, 2016
http://poq.oxfordjournals.org/
Our analyses demonstrated increased usage of web collection for both programs. Over the past decade, the Census Bureau has made web collec-tion increasingly available and has performed numerous usability studies on the electronic collection instruments (Anderson and Harley 2007; Beck and Sinclair 2012). Although the data-collection instruments are designed primar-ily to make it easier for the larger businesses to provide their data, they are available to all sampled units. Moreover, program managers are encouraged to promote web collection as much as possible.
Mail collection has always been problematic, especially in multimode surveys. Collection is even more challenging with large businesses, since a paper questionnaire may be completed in several different offices before being mailed, faxed, or keyed into the web site. Over 30 years ago, Granquist (1984) advocated “moving editing closer to data collection” by developing electronic questionnaires that performed simple edit checks at data entry. The Economic Directorate of the Census Bureau is moving toward this goal by offering voluntary web collection for many economic programs. With simple questionnaires, few edit checks are required and electronic implementation is straightforward. With more complex questionnaires, form designers must balance usability with accuracy, and some edits may be sacrificed to avoid frustration on the respondents’ part. Guidelines are available to help achieve this balance (Morrison et al. 2008; Morrison, Dillman, and Christian 2010). However, the difficulties experienced by a small business may not be the same as those experienced by larger businesses (Nichols et al. 2005).
By funneling down from detailed response rates to proportions of retained reported data by item, we can assess whether a particular collection mode is improving (or not hurting) data quality. By incorporating unit size in our analy-ses, we can assess whether the improvements, if they exist, are found across the board or are confined to a selected set of cases. When the questionnaire is well designed and the data concepts are straightforward, web response works quite well and does not seem to be affected by the size of unit. On the other hand, when these two conditions do not hold, although valid, voluntary web collec-tion is more confined to larger units. This can have quality implicacollec-tions, as the data collected via web are validated by respondents during data entry, whereas editing is not performed until after data entry with paper form collection.
Business surveys are designed to produce reliable totals. Analyst review procedures are likewise designed to produce reliable totals, and generally focus on obtaining valid data for the largest units. There is a gap in the review procedures for small businesses. In part, this gap could be closed by imple-menting more adaptive collection procedures, such as subsampling small-unit nonrespondents for follow-up, subsampling respondents for re-interview, or developing analyst review protocols that require checking a minimum number of small units. Such changes need to be researched and tested, and budget must be made available. However, web collection is already available, and there is a missed opportunity to self-validate the data when web collection is
at New York University on February 10, 2016
http://poq.oxfordjournals.org/
not used. When any subpopulation does not fully take advantage of a mode of data collection that has demonstrated quality benefits, the administering organization should investigate. If the subpopulation is small businesses, this may represent a major paradigm shift. It is possible that the cost of investigat-ing how to improve web collection instrument usability—or increase desir-ability of web usage—for a nonparticipating subpopulation could be greatly offset by the decrease in cost via web collection. Ultimately, a survey whose collection instrument minimizes the probability of response error for all units maximizes a major component of quality.
Supplementary Data
Supplementary data are freely available online at http://poq.oxfordjournals.org/.
References
American Association for Public Opinion Research. 2008. Standard Definitions: Final
Dispositions of Case Codes and Outcome Rates for Surveys. 5th ed. Lenexa, KS.
Anderson, Amy E., and Diane Harley. 2007. “Using Software to Collect Data Electronically for the Economic Census.” Proceedings of the Third International Conference on Establishment Surveys, American Statistical Association.
Anderson, Amy E., and Jennifer G. Tancreto. 2011. “Using the Web for Data Collection at the United States Census Bureau.” Paper presented at the 58th World Statistics Congress, Annual Meeting of the International Statistics Institute, Dublin, Ireland.
Bavdaž, Mojca. 2010. “The Multidimensional Integral Business Survey Response Model.” Survey
Methodology 36:81–93.
Beck, Jennifer, and Elizabeth Sinclair. 2012. “Developing a User Interface for Large-Scale, Multi-Mode Survey Data Collection.” Paper presented at the 2012 DC Usability Processional Association User Focus Conference, Chevy Chase, MD, USA.
Biemer, Paul P., and Lars E. Lyberg. 2003. Introduction to Survey Quality. New York: John
Wiley.
Bremner, Catherine. 2011. “An Investigation into the Use of Mixed-Mode Data-Collection Methods for UK Business Surveys.” Proceedings of the BLUE-ETS Conference on Burden and Motivation in Official Business Surveys, edited by Deirdre Geisen and Mojca Bavdaž, 217–20. Heerlen: Statistics Netherlands.
Charlton, John, 2004. “Evaluating Automatic Edit and Imputation Methods, and the EUREDIT
Project.” Journal of the Royal Statistical Society, Series A (Statistics in Society) 167:199–207.
Christianson, Anders, and Robert Tortora. 1995. “Issues in Surveying Businesses: An International
Survey.” In Business Survey Methods, edited by Brenda G. Cox, David Binder, B. Nanajamma
Chinnappa, Michael Colledge, and Philip Kott, 237–56. New York: Wiley.
Couper, Mick P. 2000. “Web Surveys: A Review of Issues and Approaches.” Public Opinion
Quarterly 64:464–94.
———. 2008. Designing Effective Web Surveys. New York: Cambridge University Press.
———. 2011. “The Future of Modes of Data Collection.” Public Opinion Quarterly 75:889–908.
de Leeuw, Edith. 1992. Data Quality in Telephone, Mail, and Face-to-Face Surveys. Amsterdam:
TT Publications.
———. 2005. “To Mix or Not to Mix Data-Collection Modes in Surveys.” Journal of Official
Statistics 21:233–55.
Eurostat. 2003. “Item 4.2: Methodological Documents: Definition of Quality in Statistics.” Sixth Working Group Meeting of Assessment of Quality in Statistics.
at New York University on February 10, 2016
http://poq.oxfordjournals.org/
Fellegi, Ivan P., and David Holt. 1976. “A Systematic Approach to Automatic Edit and Imputation.”
Journal of the American Statistical Association 71:17–35.
Granquist, Leopold. 1984. “On the Role of Editing.” Stastistisk Tidskrift 2:105–18.
Gravem, Dag, Gustav Haraldsen, and Tora Lofgren. 2011. “Response Burden Trends and Consequences.” Proceedings of the BLUE-ETS Conference on Burden and Motivation in Official Business Surveys, edited by Deirdre Geisen and Mojca Bavdaž, 221–35. Heerlen: Statistics Netherlands.
Haraldsen, Gustav. 2013. “Questionnaire Communication in Business Surveys.” In Designing
and Conducting Business Surveys, edited by Ger Snijkers, Gustav Haraldsen, Jacqui Jones, and Diane Willimack, 303–59. Hoboken, NJ: John Wiley and Sons.
Haraldsen, Gustav, Jacqui Jones, Deidre Geisen, and Li-Chun Zhang. 2013. “Understanding and
Coping with Response Burden.” In Designing and Conducting Business Surveys, edited by
Ger Snijkers, Gustav Haraldsen, Jacqui Jones, and Diane Willimack, 219–52. Hoboken, NJ: John Wiley and Sons.
Holbrook, Allyson L., Melanie C. Green, and Jon A. Krosnick. 2003. “Telephone versus Face-to-Face Interviewing of National Probability Samples with Long Questionnaires: Comparisons of
Respondent Satisficing and Social Desirability Bias.” Public Opinion Quarterly 67:79–125.
Hoogland, Jeffrey, and Roos Smit. 2008. “Selective Automatic Editing of Mixed-Mode Questionnaires for Structural Business Statistics.” Proceedings of the United Nations Economic Commission for Europe Work Session on Statistical Data Editing.
Jäckle, Annette, Caroline Roberts, and Peter Lynn. 2010. “Assessing the Effect of Data Collection
Mode on Measurement.” International Statistical Review 78:3–20.
Kaplowitz, Michael D., Timothy Hadlock, and Ralf Levine. 2004. “A Comparison of Web and
Mail Survey Response Rates.” Public Opinion Quarterly 68:94–101.
Kerwin, Jeffrey, Andrew Wang, Stephen Shipp, and Stephanie Campbell. 2004. “A Comparison of Strategies for Reducing Item Nonresponse in Web Surveys.” Paper presented at the Joint Statistical Meetings of the American Statistical Association, Seattle, WA, USA.
Kreuter, Frauke, Stanley Presser, and Roger Tourangeau. 2008. “Social Desirability Bias in CATI,
CAPI, IVR, and Web Surveys: The Effects of Mode and Questions Sensitivity.” Public Opinion
Quarterly 72:847–65.
Lofgren, Tora. 2011. “Burden Reduction by Instrument Design.” In Response Burden in Official
Business Surveys: Measurement and Reduction Practices of National Statistical Institutes, Deliverable 2.2, edited by Deirdre Geisen, 43–50. BLUE—Enterprise and Trade Statistics Project, European Commission, European Research Area.
Manfreda, Katja, and Vasja Vehovar. 2008. “Internet Surveys.” In The International Handbook
of Survey Methodology, edited by Edith de Leeuw, Joop Hox, and Don Dillman, 264–85. New York: Lawrence Erlbaum Associates.
Marquette, E., and Michael Kornbau. 2013. “Testing Contact and Response Strategies to Improve
Response in the 2012 Economic Census.” Proceedings of the Federal Committee on Statistical
Methodology, available at http://www.fcsm.gov/13papers/F3_Marquette_2013FCSM.pdf. Medway, Rebecca L. and Jenna Fulton. 2012. “When More Get You Less: A Meta-Analysis of
the Effects of Concurrent Web Options on Mail Survey Response Rates.” Public Opinion
Quarterly 79:733–46.
Methodology and Statistics Council. 2012. US Census Bureau Statistical Standards. Washington,
DC: US Census Bureau.
Millar, Morgan M., Allison C. O’Neill, and Don A. Dillman. 2009. “Are Mode Preferences
Real?” Technical Report 09-003. Social and Economic Sciences Research Center. Pullman: Washington State University.
Morrison, Rebecca L., Don A. Dillman, and Leah M. Christian. 2010. “Questionnaire Design
Guidelines for Establishment Surveys.” Journal of Official Statistics 26:43–85.
Morrison, Rebecca L., Samantha L. Stokes, James Burton, Anthony Caruso, Kerstin K. Edwards, Diane Harley, Carlos Hough, Richard Hough, Barbara A. Lazirko, and Shelia Proudfoot. 2008.
at New York University on February 10, 2016
http://poq.oxfordjournals.org/
“Economic Directorate Guidelines on Questionnaire Design.” Washington, DC: US Census Bureau.
Nicholls, William, Thomas L. Mesenbourg, Steven H. Andrews, and Edith de Leeuw. 2000.
“Use of New Data-Collection Methods in Establishment Surveys.” Proceedings of the Second
International Conference on Establishment Surveys, American Statistical Association. Nichols, Elizabeth M., Elizabeth D. Murphy, Amy E. Anderson, Diane K. Willimack, and Richard
S. Sigman. 2005. “Designing Interactive Edits for US Electronic Economic Surveys and Censuses: Issues and Guidelines.” Internal Census Bureau report.
Paxson, M. Chris, Don A, Dillman, and John Tarnai. 1995. “Improving Response to Business Mail
Surveys.” In Business Survey Methods, edited by Brenda G. Cox, David Binder, B. Nanajamma
Chinnappa, Michael Colledge, and Philip Kott, 303–16. New York: Wiley.
Peytchev, Andy, and Scott Crawford. 2005. “A Typology of Real-Time Validations in Web-Based
Surveys.” Social Science Computer Review 23:235–49.
Peytcheva, Emilia, and Robert M. Groves. 2009. “Using Variation in Response Rates of
Demographic Subgroups as Evidence of Nonresponse Bias in Survey Estimates.” Journal of
Official Statistics 25:193–201.
Sigman, Richard S. 2001. “Editing and Imputation in a Standard Economic Processing System.”
Proceedings of Statistics Canada Symposium, Statistics Canada.
Sudman, Seymour, Diane K. Willimack, Elizabeth Nichols, and Thomas L. Mesenbourg. 2000. “Exploratory Research at the US Census Bureau on the Survey Response Process in Large
Companies.” Proceedings of the Second International Conference on Establishment Surveys,
American Statistical Association.
Thompson, Katherine J., and Broderick Oliver. 2012. “Response Rates in Business Surveys:
Going Beyond the Usual Performance Measure.” Journal of Official Statistics 28:221–37.
Thompson, Katherine J., and Katrina T. Washington. 2013. “Challenges in the Treatment of Unit
Nonresponse for Selected Business Surveys: A Case Study.” Survey Methods: Insights from
the Field. Available at http://surveyinsights.org/?p=2991.
Tuttle, Alfred, Rebecca Morrison, and Diane K. Willimack. 2010. “From Start to Pilot: A Multi-Method Approach to the Comprehensive Redesign of an Economic Survey Questionnaire.”
Journal of Official Statistics 26:87–103.
Wagner, James. 2012. “A Comparison of Alternative Indicators for the Risk of Nonresponse Bias.”
Public Opinion Quarterly 76:555–75.
Willimack, Diane K., Amy Anderson, and Katherine J. Thompson. 2000. “Using Focus Groups
to Identify Analysts’ Editing Strategies in an Economic Survey.” Proceedings of the Second
International Conference on Establishment Surveys, American Statistical Association. Willimack, Diane K., and Elizabeth Nichols. 2010. “A Hybrid Response Process Model for
Business Surveys.” Journal of Official Statistics 26:3–24.
at New York University on February 10, 2016
http://poq.oxfordjournals.org/