This study aims to investigate the corporate governance practices on State-Owned Enterprises (SOEs) and to find out their impacts on the operating performance of the firms. This study finds out the substantial improvements of the quality of corporate governance practices in public-listed Indonesian SOEs. Total corporate governance (CG) compliance score and each component score show an upward trend improvement. With regard to the relationship between CG compliance and operating performance, as represented by Return on Assets, Net Profit Margin, and Assets Turnover, this study finds out that there is a direct relationship between the governance quality and operating performance. This positive relationship is cpused by the reduction of the operating cost and not coused by the increase of sales or the better use of assets.
© 2012 IRJBS, All rights reserved. Received: September 18, 2011
Final revision: January 29, 2012
Keywords:
Corporate Governance, Operating Performance, SOEs,Indonesia
Corresponding author:
* [email protected] ** [email protected] *** [email protected]
Dezie L. Warganegara
*, Firdaus Alamsjah
**, Melisa Soentoro
****, **BINUS University, Jakarta ***Stern Stewart & Co., Jakarta
A R T I C L E I N F O A B S T R A C T
T
he term corporate governance began to spread in corporate circles in Indonesia after the Asian Financial Crisis in the late 1990s. Ito (2007) suggests that the repercussions hit Indonesia more than the other affected Asian countries because of poor governance practices, including lack of transparency, weak supervision and poor regulatory systems. To accelerate recovery and to anticipate the negative effects of similar economic crises in the future, the Indonesiangovernment and relevant agencies have issued regulations and established systems to formulate, socialize, and monitor the implementation of Good Corporate Governance (GCG) in Indonesia’s public and private sectors.
The Indonesian Security Exchange Commission (BAPEPAM-LK) announced that the market capitalization of publicly listed SOEs in 2010 was 24.7% of total market capitalization of the Indonesia Vol. 5 | No. 1 ISSN: 2089-6271
The Impact of Governance Practices
on the Operating Performance:
Stock Exchange. This massive economic force, coupled with the state’s majority ownership in each company, makes SOEs a primary target for state directives on the implementation of better corporate governance, particularly the Ministry of State-Owned Enterprises (MSOEs) 2002 decree that compelled all SOEs to implement GCG. The first objective of this study, therefore, is to investigate the extent of corporate governance implementation by Indonesia’s publicly listed, state-owned enterprises (SOEs).
This study finds improved levels of corporate governance (CG) in Indonesian SOEs. The CG compliance score and its component scores show a significant, generally upward trend during the period being studied, from 2004 and 2007. The results of this study support the Lehmann and Weigand study (2000) which suggests that the majority shareholder power is the most influential element in corporate management.
This study also examines the relationships between corporate governance strength and operating performance. Jensen (1993) argues that well-governed firms operate more efficiently and, as a result, have higher financial performance levels. This study, however, finds a weak positive relationship between corporate governance quality and year-ahead ROA. To analyze the sources of this weak relationship, the study separated two ROA elements: operating profit margin (OPM) and assets turnover (ATO). Analysis revealed that corporate governance strength positively affects OPM but not ATO. In other words, the quality of corporate governance implementation did reduce business expenses but did not increase revenues. A previous report on CG compliance costs supports these findings; adopting good corporate governance may result in diminishing marketplace initiative or slower reactions to competition and may hamper revenue-generating abilities (Reddy, et. al, 2008).
Four sections comprise the rest of this study. Section II briefly explains the hypothesis development and
research methodology. Section III discuses the empirical results Section IV presents the managerial implications. Section V concludes the study.
METHODS
The Asian Financial Crisis and Corporate Governance in Indonesia
The devaluation of the Thai baht in July 1997 triggered the Asian financial crisis which unleashed devastating repercussions all over East Asia, but the debilitating effects were felt deepest and lasted the longest in Indonesia (Ito, 2007). The following year, the Indonesian economy contracted by more than -13%. The Indonesian Rupiah (IDR) depreciated to IDR17,000 per USD compared to IDR 2,000 per USD in 1996. The crisis wreaked havoc from Jakarta and unleashed economic, social and political crises as well as waves of riots throughout the archipelago, which resulted in thousands of casualties (Hill and Shiraishi, 2007). Since its independence in 1945 until 1997, Indonesia had one reigning president. During and after the 1997 crisis, the country underwent four changes of government. These preceding events led to Indonesia’s first-ever presidential election in 2004. A 1999 survey of corporate governance in the region revealed that Indonesia had the weakest standards of disclosure and transparency (PricewaterhouseCooper, 1999). A study shows that there was widespread expropriation of firms’ assets by managers and majority shareholders in countries with weak corporate governance (Claessens, Djankov, and Lang 2000). Such assets expropriation result in greater economic downturns and larger fall in asset prices in countries during a crisis. (Johnson, Boone, Breach, and Friedman 2000).
The Asian financial crisis exposed the weaknesses of corporate governance in Indonesia, particularly the lack of transparency, poor control and supervision, and weak regulatory structures. In an effort to accelerate recovery and to lessen the debilitating effects of future financial crises, the International Monetary Fund (IMF) tied financial assistance to Indonesia with specific reforms in corporate governance (Fischer, 1998). Indonesia eventually
has fully repaid the IMF and, in 2003, the nation withdrew from the IMF Crisis Recovery Program.
These series of difficult events forced the country’s leadership to take decisive actions, particularly towards the institutionalization of good corporate governance. Since then, other regulations, decrees and structures have been organized and socialized for the purpose of monitoring the implementation of Good Corporate Governance (GCG) in the public and private throughout the country. For instance, in 2000, the Indonesia Stock Exchange (IDX) required public listed companies to implement good corporate governance by December 31, 2001. Also in 2002, the Minister of State-Owned Enterprises issued a decree (Surat Keputusan Menteri BUMN no Kep-117/M-MBU/2002) to compel all SOEs to implement GCG.
Hypothesis Development
Since over two centuries ago, the efficacy of hired managers in running businesses has been questioned. It has been suggested that professional managers lack the motivation and incentives required to effectively run a business the way business owners would (Adam Smith 1776/1952). It has also been suggested that this owners-manager gap allows professional managers to pursue their own interests, to the shareholders’ disadvantage (Berle and Means, 1932). In addition, it has been noted that the expropriation of a firm’s assets is more severe when a company’s ownership is dispersed among small investors lack the collective power to exercise control over hired managers (Berle and Means, 1932).
The fact that public corporations survive as a form of business organization - and even as one of the distinctive features of modern society - suggests that company owners have found ways to make professional managers run their companies responsibly and accountably. One way is the transformation of managers into part-owners by increasing their equity ownership (Jensen and Meckling, 1976). Another way is the implementation
of a set of mechanisms that govern resource allocations and managerial decisions (Jensen, 1993).
According to article 1 of the SOE Act (UU No. 19/2003/BUMN), the government must have at least 51% interests in SOEs. Consequently, SOEs are within the direct command and control sphere of the Indonesian government. The power of majority shareholders in influencing the way companies run their businesses is not negligible. As one study puts it, a large body of shareholders is the most effective force in influencing a company’s management (Lehmann and Weigand, 2000). Pound (1995) has suggested that implementing stronger governance requires committed owners who actively participate in overseeing the firm. These committed owners must be a large shareholder so that they have sufficient control over the firm’s assets and activities. The commitment increases with the investor’s ownership size (Shleifer and Vishny, 1986).
H1: Following the decree issued by the Minister of State-Owned Enterprises, all SOEs implement stronger corporate governance.
The positive relationship between corporate governance and operating performance is based on the argument that firms with stronger governance system operate more efficiently and therefore increase their operating performance. A more effective governance system leads to better business results because it reduces conflicts of interests among the firm’s key players, protects all rights of stakeholders and structures all governing bodies to act independently from management (Jensen, 1993). A strong corporate governance system prevents managers from expropriating a firm’s financial and physical assets (Johnson, et. al., 2000). Abdullah, Shah, and Hassan (2008) and Goergen, Manjon, and Renneboog (2008) argue that strong governance increases firm’s operating efficiency because it ensures that commissioners and management act in the best interest of shareholders and the company has better reputation because it acts appropriately in terms of legal and ethics when dealing with all stakeholders. In addition, strong governance ensures that all shareholders participate in governing the company and place appropriate controls and procedures to guide management’s activities in running the company. Finally, strong governance provides an early warning system before difficulties reach a disastrous phase (Jensen, 1993).
Several studies support the case for the notion that stronger governance leads to higher operating performance. A study of 495 firms in 25 developing countries including Indonesia found that better-governed firms show higher profitability or return on assets (Klapper and Love, 2004). A study of conflicts of interests in almost 6,000 Korean companies found various degrees of reduction in profits (Joh, 2003). A Governance Index ranked some 1,500 US firms and found that less-governed firms show negative correlations with two measures of operating performance: net profit margin (NPM) and sales
growth (Gompers, Ishii, and Metrick, 2003). In a study of governance and operating performance levels of 50 Pakistani companies, Abdullah, Shah, and Hassan (2008) found that better-governed firms correlate with higher return on asset (ROA) and return on equity (ROE).
However, other studies found a non-positive relationship between governance compliance and operating performance. A study of governance levels in Malaysian firms showed no evidence that good governance increased company ROA or ROE (Ponnu, 2008). Likewise, a study of firms in New Zealand showed no relationship between governance and operating performance (Reddy, Locke, Scrimgeour, and Gunasekarage, 2008). In fact, a study of European firms showed that better-governed firms have worse profitability in terms of NPM and ROE (Bauer, Günster and Otten, 2004). In the case of this last study, however, a later analysis of the same set of data neutralized the effects of asset disposals and found a positive relationship between governance and profitability (Bauwhede, 2009).
While these previous studies yield differing empirical data on the effect of governance compliance in improving operating performance, this paper examines some unexamined factors: variables within public listed SOEs where the state is the majority owner. The state ownership leads to a clear separation between the owner and professional manager that result in typical conflicts of interests between principal and agent. With stronger governance mechanisms, SOEs reduce the potential conflicts and therefore operate more efficiently so that their operating performance increases. The formal hypothesis regarding the relationship between governance and operating performance is stated in the in the alternate form as follows:
H2: There is a positive relationship between the qualities of corporate governance practices and operating performance.
Data Collection and Statistical Models
After the Asian financial crisis, the year 2004 was the start of a period of stability and normalcy. This was the first year after Indonesia withdrew from the IMF Crisis Recovery Program, and the year when the country directly elected a president for the first time. Thus, 2004 is selected as the starting point of this study. Of the one hundred and forty-one (141) SOEs in Indonesia, fourteen (14) SOEs were listed in the Indonesian Stock Exchange in 2008. Of these, three (3) were financial and eleven (11) were non-financial firms. The final samples selected for this study are only the non-financial SOEs with complete data on corporate government implementation between the years 2004 and 2007.
To uncover evidence on the extent of corporate governance implementation, this study utilizes the Corporate Governance (CG) Questionnaire developed jointly by the Indonesian Ministry of State-Owned Enterprises (MSOEs) and the Board of Finance and Development Control (BPKP), a state agency under the Indonesian Ministry of Finance. This official questionnaire for the assessment of CG implementation in Indonesia has five (5) categories: Shareholders’ Rights, CG Policy, CG Practices, Disclosure & Transparency, and Commitment. These five categories comprise fifty (50) indicators which, in turn, comprise one hundred and sixty (160) elements (See Appendix).
Each category is weighted according to its influence on GCG implementation, as determined jointly by BPKP and MSOEs. The weights are 9% for Shareholders’ Rights; 8% for CG Policy; 66% for G Practices; 7% for Disclosure & Transparency; and 10% for Commitment. Moreover, CG Practices is divided into four (4) parts: 27% for the Board of Commissioners (BOC); 6% for the Committees under the Board of Commissioners (CBOC); 27% for the Board of Directors (BOD); and 3% each for Internal Audit and for Corporate Secretary.
To create a scoring structure, the study examined the annual reports of the sample firms and assigned
a score of 1 (one) for each activity aligned with a CG element in the questionnaire, or 0 (zero) otherwise. A firm that implements all 160 CG elements earns a maximum score of 100 points. A score of zero (0) signifies that the firm has not implemented any CG element. To assign a CG score for each firm-year, the researchers independently examined annual reports and used a coding sheet to tally data under the various questionnaire components. To ensure reliability of CG scores, the research team discussed questionable points and, where necessary, introduced new coding rules (Striukova, Unerman, and Guthrie, 2008).
To test the first hypothesis that all SOEs implement stronger corporate governance throughout the sample period, this study utilizes the two-independent- sample t-test. The total CG scores and each of their components scores in year 2004 and 2007 are compared to find the evidences. To test the relationship between the extent of CG implementation and operating performance, this study utilized multiple regression analysis. The operating performance of each firm-year is reflected by its Return on Assets (ROA), which is estimated by dividing operating profit at time t+1 with average total assets from times t to t+1 (Larcker, Richardson and Tuna, 2006; Bauwhede, 2009). ROA is considered the most suitable proxy for operating performance because it is less affected by the discretionary items in financial statements (Barber and Lyon, 1996; Core, Guay, and Rusticus, 2006). To investigate further the source of increases in operating performance from implementing corporate governance in those SOEs, the analysis divided the ROA into its two components: Operating Profit Margin (OPM), and Asset Turnover (ATO). OPM is measured by dividing operating profit at time t+1 with net sales at time t+1, and ATO is measured by dividing net sales at time t+1with average total assets from times t to t+1.
profitable firms may self-select into a group with stronger corporate governance practice or vice versa (Borsch-Supan and Koke, 2002; Renders and Gaeremynck, 2006). This endogeneity factor results in bias and inconsistency in the OLS parameter estimates. By measuring CG components at time t and the operating performance at time t+1, the endogeneity factor can be avoided (Bauwhede, 2009). This method ensures that, at the time when operating performance is being measured, the governance components reflected in the scores are already in place and working.
Following Bauwhede (2009), this study utilizes the control variables of size and leverage that can affect the operating performance of firms in the regression models. The size and leverage are proxied by market share and ratio of total debt to total assets. Several reports support the concept of market share as indicative of the actual operational size of a firm that translated directly into the ability of a firm to control and influence over its environment, such as competitors and suppliers. A large market share, for instance, enables a company to reduce cost per unit of output and stabilize output prices by spreading its fixed costs over larger output. This is achieved by preventing competitors from reducing prices, and by purchasing inputs in large quantity at discount prices (Jagiello and Mandry, 2004; Hawawini and Viallet, 2007).
On the other hand, the same researchers contend that highly leveraged firms with large fixed costs usually fail to produce adequate profits to compensate for those fixed charges. In addition, a firm with large fixed costs tends to engage in price and marketing wars that, in turn, erode resources and affect the firms operating performance. From these concepts, the effects of market share and leverage on operating performance are hypothesized to be positive and negative respectively. Thus, the regression model in this study has operating performance as a dependent variable and three independent variables. The operating performance is proxied by one
year-ahead ROA, OPM, and ATO. The independent variables are corporate governance score, market share, and financial leverage. The model is formally expressed as follows:
Performancei,t+1 = ß0 + ß1 CGit + ß2 MktShareit - ß3 Leverageit
Where:
Performanceit+1 = ROA, OPM, or ATO of SOE i at time t+1. ROA is estimated by dividing operating profit at time t+1 with average total assets from times t to t+1; OPM is measured by dividing operating profit at time t+1 with net sales at time t+1; ATO is found by dividing net sales at time t+1 with average total assets from times t to t+1.
CGit = Corporate governance score of SOE i at time t.
MktShareit = Net sales of SOE i at time t divided by total net sales of firms in the same industry at time t.
Leverageit = Sum of short-term and long-term debt divided by total assets, for SOE i in year t.
ε
it = An error term.
To reprise, this study investigates annual reports of SOEs over a period of four (4) years. The repeated observations on the same companies, however, may create another econometrics problem: that the observations may be independent across companies but not independent within firms. In assessing the relationship between a dependent variable and a set of independent variables, ordinary least squares (OLS) assume that the error terms are independent and identically distributed. If there is an autocorrelation between the error terms and independent variables, least squares estimates of the standard errors are biased and understate the true standard errors. To solve this econometric bias, this study employs the cluster-robust standard
errors suggested by Petersen (2009). Cluster-robust standard errors are created by relaxing the assumption of error independence and allowing correlation from observations on the same company in different years.
RESULTS AND DISCUSSION
The extent of Corporate Governance Compliance
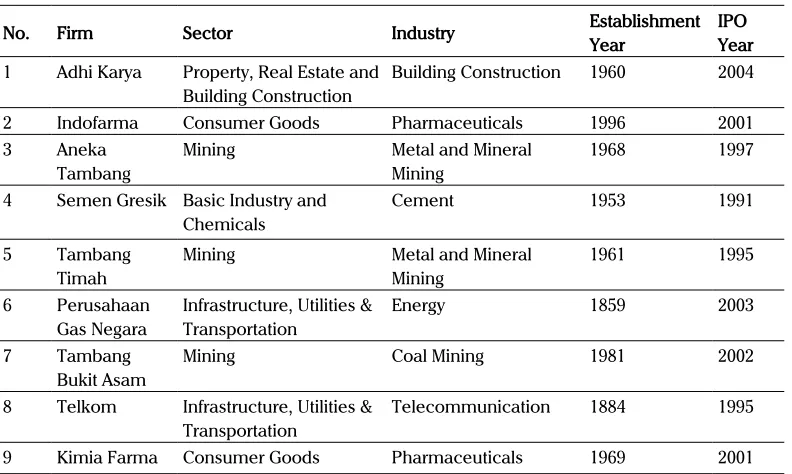
The main objective of this study is to investigate the extent and the effect of implementation of good corporate governance from 2004 to 2007, particularly in selected Indonesian SOEs with a state-ownership majority. The parameters for sample selection stated in the previous section resulted in a population sample of nine (9) firms for total thirty-six (36) firm-year observations. The sample SOEs used in this study can be seen on Table 1.
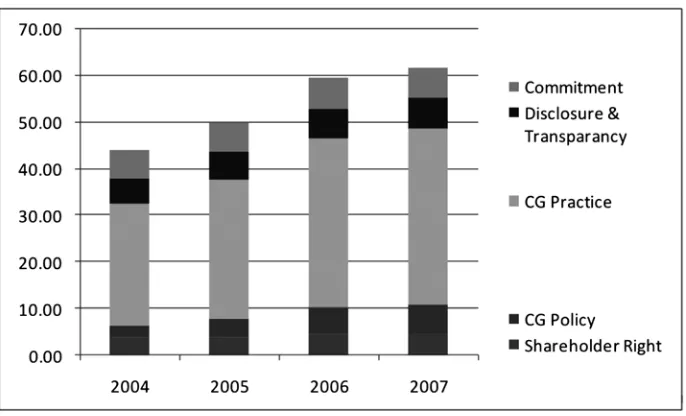
Figure 1 depicts the total CG and its components scores of the sample SOEs from year 2004 to year 2007. On average, the total CG scores on Figure I show a positive trend. The highest increase was in 2006, when the CG score increased by 19.6%. The lowest increase was in 2007; after progressing in
double digits for two consecutive years, the average CG score increased by a mere 3.6%.
Figure 1 also shows a general upward trend in all the CG component scores for the sample firms from 2004 to 2007. In 2006, all component scores showed the highest increase levels. Scores increased from 2005 to 2006 in Shareholders’ Rights (19.3%), CG Policy (43.6%), CG Practice (20.4%), Disclosure & Transparency (12.4%), and Commitment (7.9%). In contrast, the last year of the sample period (2007) showed the lowest increases in all components. The increase in scores from 2006 to 2007 were: Shareholders’ Rights (5.2%), CG Policy (7.3%), CG Practice (4.6%), Disclosure & Transparency (1%), and Commitment (-2.6%).
An analysis of individual CG components shows that CG Policy has the highest improvement; the highest increases in CG Policy were: 52% from 2004 to 2005, 43.4% from 2005 to 2006, and 7% from 2006 to 2007. In comparison, Commitment yielded the lowest scores: 3.7% from 2004 to 2005, 7.9% from 2005 to 2006, and -2.6% from 2006 to 2007. This analysis only showed one decrease - in
No. Firm Sector Industry Establishment Year IPO Year
1 Adhi Karya Property, Real Estate and Building Construction
Building Construction 1960 2004
2 Indofarma Consumer Goods Pharmaceuticals 1996 2001
3 Aneka
Tambang
Mining Metal and Mineral
Mining
1968 1997
4 Semen Gresik Basic Industry and Chemicals
Cement 1953 1991
5 Tambang
Timah
Mining Metal and Mineral
Mining
Mining Coal Mining 1981 2002
8 Telkom Infrastructure, Utilities & Transportation
Telecommunication 1884 1995
9 Kimia Farma Consumer Goods Pharmaceuticals 1969 2001
Commitment. Thus, in general the total scores for CG and its five components (See Figure 1) indicate an upward trend during the period.
To find further evidence on the improvement of the implementation of CG in the sample firms, the study compared the total CG score and its five component scores in 2004 and 2007. To validate the normality assumption of the data, the study applied the Kolmogorov-Smirnov tests. The resulting statistics are: Total CG = 0.688; Shareholders’ Rights = 0.997; CG Policy = 1.083; CG Practice = 428; Disclosure & Transparency = 0.959; and Commitment =0.657. The statistical analysis yielded the following p-values: Total CG = 0.732; Shareholders’ Rights = 0.273; CG Policy = 0.191; CG Practice = 0.993; Disclosure & Transparency = 0.317; and Commitment = 0.781. These statistical results indicate that the null hypothesis that total CG and its all five component scores exhibit normal distribution cannot be rejected.
Table 2 shows that the 2004 and 2007 mean differences for the Total CG score is positive and significant at less than the 1% level. Furthermore, the mean differences in 2004 and 2007 for each of the five component scores are positive. However, the null hypothesis that the observed scores in 2004 and 2007 are equal can only be rejected for Total CG, Shareholders’ Rights, CG Policy, CG Practice, Disclosure & Transparency scores, but not for the Commitment scores. Although, the mean difference in 2004 and 2007 for Commitment is positive, it is not significant at conventional levels. As mentioned earlier, Commitment showed the lowest improvement during the sample period; it even experienced a decrease from 2006 to 2007.
Corporate Governance Quality and Operating Performance
As mentioned earlier, to test the relationship between the quality of CG implementation and operating performance, this study utilized Return
on Assets (ROA) as one of proxies for operating performance. The measure is estimated by dividing operating profit at time t+1 with average total assets from times t to t+1 (Larcker, Richardson and Tuna, 2006; Bauwhede, 2009). To complete the analysis, the ROA into is further divided into its two components: Operating Profit Margin (OPM), and Asset Turnover (ATO). OPM is measured by dividing operating profit at time t+1 with net sales at time t+1, and ATO is measured by dividing net sales at time t+1with average total assets from times t to t+1. Besides CG strength, this study also uses market share and financial leverage as control variables. The descriptive statistics regarding the research variables can be seen in Table 3.
Table 3 shows the descriptive statistics for the dependent and control variables of the regression model. It shows a mean one-year ahead ROA of 23.5% (median 20. 9%) and a mean one-year ahead
OPM of 22.6% (median 23.0%). Since the minimum values of the ROA and OPM are positive numbers, it may be inferred that none of the sample firms suffered losses during the sample periods. Table II also shows a mean one-year ahead ATO of 115.8% (median 122.1%), which is close to 100%. This means that most of the ROA value is determined by OPM value and that, therefore, ATO is not a major factor in the transformation of OPM into ROA for the sample firms in this study.
Table 3 also shows a mean market share of 37.1% and a median market share of 23.6%. In addition, the table shows a minimum market share of 5.6% and a maximum market share of 100%. Furthermore, the mean and median scores for leverage are about 50% with a minimum score of 21.1 % and a maximum score of 87.4%. These variables support the infer-ence that the firms in this study possess consider-able market power in their respective industries. Figure 1. CG scores for the periods of 2004-2007
This graph is based on a five-point questionnaire: Shareholders’ Rights, CG Policy, CG Practice, Disclosure & Transparency, and Commitment. These categories comprise 50 indicators, which further comprise 160 elements. Based on information in annual reports of the sample firms, a score of 1 (one) was assigned each time a firm conducts an activity aligned with a CG element in the questionnaire, and 0 (zero) otherwise. When a firm scores in all 160 CG elements, the maximum score is 100 points. When a firm scores the minimum score of 0, it indicates zero implementation of corporate governance elements.
ROA is estimated by dividing operating profit at time t+1 with average total assets from times t to t+1; OPM is measured by dividing operating profit at time t+1 with net sales at time t+1; ATO is computed by dividing net sales at time t+1with average total assets from times t to t+1; MktShareit is net sales of SOE i at time t divided by total net sales of firms in the same industry at time t; Leverageit is the sum of short-term and long-term debt divided by total assets for SOE i in year t. Table 2. Mean differences in CG scores in 2004 and 2007
Variables Mean Score (% Mean Difference)Mean Difference t-statistic
2004 2007
Total CG 44.080 61.934 17.855 (40.5%) 6.967***
Shareholder Rights 3.868 4.895 1.026 (26.5%) 3.471***
CG Policy 2.560 5.970 3.410 (133.2%) 6.653***
CG Practice 26.168 37.844 11.676 (44.6%) 5.699***
Disclosure &
Transparency 5.458 6.657 1.199 (22%) 4.741***
Commitment 6.025 6.568 0.543 (9%) 0.763
Table 3. Descriptive statistics
Variable Mean Median Std Dev Min. Max
ROA 0.235 0.209 0.170 0.014 0.703
OPM 0.226 0.230 0.148 0.033 0.566
ATO 1.158 1.221 0.446 0.341 2.131
MktShare 0.371 0.236 0.295 0.056 1.000
Table 4 presents the Pearson correlation coefficients of the research variables of the regression models. For the dependent variables, one-year ahead ROA and one-year ahead OPM are positively correlated with CG. One-year ahead ATO, on the other hand, is negatively correlated with CG. However, only the correlation of OPM and CG is statistically significant. The highest absolute value of the correlations among the independent variables is 0.323, which is lower than 0.800. This measure indicates that the regression results are not seriously affected by multicolinearity.
Table 5 Panel A shows the results of the OLS regression analysis using ROA as the dependent variable. The F-statistic for the model is 13.17, which is statistically significant at less than the 1% level. These results provide assurance that the model has been designed properly. The adjusted R-squared showed that the independent variables in the model are able to explain the 14% variations in the ROA, which is quite acceptable given that the model is using cross-sectional data.
Table 5 Panel A also shows the test results for individual independent variables. The main variable in this study is the CG score which, as expected, has a positive relationship with ROA. This positive relationship supports the notion of CG proponents that there is an economic benefit in implementing CG in firms. However, this positive relationship is not as strong as expected. The magnitude of the
Table 4. Pearson correlation coefficients
ROA is estimated by dividing operating profit at time t+1 with average total assets from times t to t+1; OPM is measured by dividing operating profit at time t+1 with net sales at time t+1; ATO is derived by dividing net sales at time t+1with average total assets from times t to t+1; MktShareit is net sales of SOE i at time t divided by total net sales of firms in the same industry at time t; Leverageit is the sum of short-term and long-term debt divided by total assets for SOE i in year t.
Variable ROA OPM ATO CG MktShare Leverage
ROA 1
PM .741 1
ATO 0.215 -.427 1
CG 0.154 .332 -0.251 1
MktShare -0.034 .488 -.660 0.232 1
Leverage -.395 -0.174 -0.088 0.170 0.323 1
coefficient is the smallest among those of the other independent variables and, more importantly, the coefficient is only marginally significant at the 10% level, one-sided.
To further investigate the causes of the weak relationship between corporate governance compliance and operating performance, this study replaces ROA with two operating performance measures, operating profit margin (OPM) and assets turnover (ATO), that represent the building blocks of ROA. These two operating performance models are tested individually against the CG Score as the main independent variable, and then against Market Share and Leverage as control variables.
Table 5 Panel B shows the results of the OLS regression analysis using OPM and ATO as dependent variables. The F-statistics for the OPM regression model is 25.29 and the p-value of this statistic is less than 0.01. Similarly, the F-statistics for the ATO regression model is 37.85 and its p-value is less than 0.01. These results prove that both models have been designed properly. The adjusted R-squared show that the independent variables in the models are able to explain 38% and 42% of variations in OPM and ATO respectively.
CG Score is significant in explaining the variations only in the OPM but not in the ATO operating performance models. As expected, CG Score has
Table 5. Results of the regression analyses Panel A: Return on Asset (ROA)
Panel B: Operating Profit Margin (OPM) and Asset Turnover (ATO)
Performancei,t+1 = ß0 + ß1 CGit + ß2 MktShareit + ß3 Leverageit +
ε
it ; Performanceit+1 = ROA, OPM, or ATO of SOE i at time t+1. ROA is estimated by dividing operating profit at time t+1 with average total assets from times t to t+1; OPM is measured by dividing operating profit at time t+1 with net sales at time t+1; ATO is derived by dividing net sales at time t+1with average total assets from times t to t+1; CGit = Corporate governance score of SOE i at time t; MktShareit = net sales of SOE i at time t divided by total net sales of firms in the same industry at time t; Leverageit = sum of short-term and long-term debt divided by total assets for SOE i in year t.*,** and *** denote statistical significance at the 10%, 5% and 1% level respectively and is based on a one-tailed test if the sign of the coefficient is as expected, and is based on a two-tailed test otherwise. T-statistics are adjusted for in-company dependence by using clustered robust standard errors.
Independent Variable Expected Sign Coefficients t-statistic
Constant ? 0.244 2.64**
CG + 0.003 1.75*
MktShare + 0.035 0.45
Leverage - -0.411 -5.01***
F-statistic(p-value) 13.17 (0.00)
Adjusted R-squared 0.14
Independent
Variable Expected Sign
Operating Profit Margin (OPM) Asset Turnover (ATO)
Coefficients t-statistic Coefficients t-statistic
Constant ? 0.084 0.84 1.616 6.51***
CG + 0.004 2.03** -0.005 -1.11
MktShare + 0.278 3.31*** -1.028 -5.54***
Leverage - -0.318 -2.28** 0.365 1.02
F- statistic (p-value) 25.29 (0.00) 37.85 (0.00)
Adjusted R-squared 0.38 0.42
a positive relationship with OPM and is statistically significant at the 5% level, one-sided. In the ATO operating performance models, the CG Score has a negative relationship with ATO, which is statistically insignificant at conventional levels.
Previous studies found that market leaders have lower and more stable output costs per unit. Dominant firms in their respective industries have ample power to negotiate with suppliers for lower input prices and are able to spread their fixed operating costs over larger output. Table 5 Panel A
shows that the relationship between ROA and market share is indeed positive. The relationship, however, is not significant at conventional levels. Table 5 Panel B shows that the relationship between OPM and market share is positive while the relationship ATO and market share is negative. Both relationships are significant at the 1% level.
relationship between ATO and leverage. These findings support the notion that businesses with large fixed costs usually fail to produce adequate profit margins to compensate for those costs (Jagiello and Mandry, 2004; Hawawini and Viallet, 2007).
MANAGERIAL IMPLICATIONS
The Results on the tests show that in general, SOEs have improved the CG implementations. The only CG component that fails to show an improvement is Commitment. As shown in Appendix, the category commitment comprises three (3) indicators which are further detailed in nine (9) statements. The statements mostly contain formal acknowledgement by key players in SOEs regarding the GCG adoptions and compliances, including socialization, punishment, and reward.
The finding that Commitment does not improve means that the GCG adoption is not expressed formally by individual SOEs in their annual reports. Recall that the implementation of GCG on Indonesian SOEs was triggered by the decree of MSOEs in 2002 (Surat Keputusan Menteri BUMN no Kep-117/M-MBU/2002). Because the government is a majority owner of SOEs and controls SOE management activities, there is the possibility that individual SOEs do not consider formal acknowledgment is important. The SOEs were ordered by the state to implement GCG and therefore SOEs only need to show the government how well it has been implemented as captured successfully by the other CG components in this study. The SOEs, however, should not underestimate the CG commitment component. Information regarding important business activities such as CG quality should be disclosed to stakeholders to reduce information asymmetry in the market. By doing so, all stakeholders including shareholders and customers can appreciate the efforts and reward the SOEs accordingly.
With regard to the relationship between the governance quality and operating performance, the tests show that the existence of positive relationship only occurs when operating performance is proxied
by ROA and OPM but not when it is proxied by ATO. Mechanically, a firm’s return on assets is the product of its OPM and its ATO. Thus, a higher operating profit margin and asset turnover indicate a higher return on assets. This suggests at least two sources for an increase in ROA. First is an increase in the firm’s ability to organize efficient operations, which can be achieved by controlling its operating expenses so that any increase in sales is higher than any increase in expenses. Second is the improvement of a firm’s ability to organize effective operations, which can be obtained by generating higher sales for a given amount of assets under a firm’s control.
Corporate governance is intended to provide mecha-nisms to direct and control business activities. As in other managerial systems, the way corporate gover-nance is run in businesses depend on its implemen-tation objectives. In Indonesia, corporate governance is implemented to prevent and to lessen the negative impacts of a future economic crisis (Fischer, 1998). This objective tends to emphasize more on cost reduction, fraud prevention, and risk management activities than on revenue generating activities. Al-though the adoption of good corporate governance may incur compliance costs such as, among other things, lessened marketplace initiative and slower reactions to competition, as suggested by Reddy et. al (2008), the SOEs should open up a new dimension in their CG practices towards revenue enhancement activities. Corporate governance allows a firm to have suitable systems and procedures in well functioning organs within a firm in friendlier external environ-ments. The SOEs should take full advantage of the benefits for having stronger governance and the In-donesian government, as a majority owner, should include this new dimension, revenue enhancement activities via good corporate governance, in assessing the governance quality in each SOEs.
This study also supports the argument that market leaders have lower operating expenses. The data, however, does not prove that dominant firms in their respective industries have more effective assets utilization. It seems that the more a company
dominates its industry, the bigger are the resources that must be sacrificed to achieve more sales. Most SOEs in this study sample are market leaders in their respective industries. Having dominated their industries for extended time may have resulted in the piling up of unproductive assets. In addition, it is also found that the use of leverage in capital structure incurs expenses such as interest that reduce the profitability of firms. It appears that the failure to produce compensating margins stems from the inability of firms to increase their sales through better use of their assets.
In Indonesia, SOEs are typically older than non-SOEs. Some SOEs were even established in the 1800s, long before the country’s independence. Some fixed-assets acquired in the past might have been obsolete or more useful in new business setting. The SOEs should consider a new way to utilize those fixed-assets. Some fixed assets should be disposed as scraps for cash while others should be used differently. If necessary, these SOEs can seek for new partners in utilizing their misemployed fixed assets in more innovative ways. The proceeds from selling the scraps or from new businesses ventures with partners should be used to retire their debts to improve profitability and sustainability in the future.
CONCLUSION
The Asian financial crisis has sensitized Indonesia to the importance of corporate governance in avoiding or mitigating the effects of future economic crises. In 2000, the Indonesia Stock Exchange (IDX) issued corporate governance regulations for publicly-listed companies and in 2002, the Indonesia Minister of State-Owned Enterprises decreed that all SOEs must observe professional, transparent and efficient, accountable, fair, reliable, and responsible governance in all SOEs affairs. This study investigates the results of those regulations and the effects of compliance on the operating performance of SOEs. This study finds an improvement in the implementation of good corporate governance in Indonesian state-owned enterprises. The compliance scores of total CG and its components show a generally upward trend during the sample period. With regard to operating performance, there is an evidence of a positive relationship between CG Strength and Operating Performance only when the performance is represented by ROA and OPM but no evidence when it is proxied by ATO. Profitability may increase due to reduction in expenses, increase in sales, or both. This study finds that the positive relationship occurs due to reduction in operating expenses and not from increase in sales or from better use of their assets.
R E F E R E N C E S
Abdullah, M. S., Shah, S. Z. A., & Hassan, A. (2008). Impact of corporate governance on financial performance of firms: Evidence from Pakistan. Business Review, 11(2), 282-289.
Bauer, R., Günster, N., & Otten, R. (2004). Empirical evidence on corporate governance in Europe: The effect on stock returns, firm value and performance. Journal of Asset Management, 5(2), 91–104.
Bauwhede, H. V. ( 2009), On the relation between corporate governance compliance and operating performance. Accounting and Business Research, 39(5), 497-513.
Berle, A. A., & Means, G.C. (1932). The Modern Corporation and Private Property. New York: Macmillan.
Borsch-Supan, A., & Koke, K. (2002). An applied econometrician’s view of empirical corporate governance studies. German Econometric Review, 3(3), 295-326.
Claessens, S., Djankov, S., & Lang, L.H.P. (2000). The separation of ownership and control in East Asian Corporations. Journal of Financial Economics, 58, 81-112.
Core, J. E., Guay,W. R., & Rusticus, T. (2006). Does weak governance cause weak stock returns? An examination of firm operating performance and investors’ expectations. Journal of Finance, 61(2), 655-687.
Giroud X., & Mueller, H.M. (2010). Does corporate governance matter in competitive industries? Journal of Financial Economics, 95, 312–331.
Goergen, M., Manjon, M.C., & Renneboog, L. (2008). Recent developments in German corporate governance. International Review of Law and Economics, 28(3). 175-193.
Gompers, P., Ishii, J., & Metrick, A. (2003). Corporate governance and equity prices. Quarterly Journal of Economics, 118(1), 107–155.
Hawawini, G., & Viallet, C. (2007). Finance for Executives. USA: South-Western.
Hill, H., & Shiraishi, T. (2007). Indonesia after the Asian Crisis. Asian Economic Policy Review, 2, 123–141.
Ito, T. (2007). The Asian currency crisis and the IMF, 10 years later: Overview. Asian Economic Policy Review, 2(1), 16–49. Jagiello, K., & Mandry, G. (2004). Structural determinants of performance insight from PIMS data base. In D.F. Channon (Ed.),
The Handbook of Management. USA: Blackwell.
Jensen, M. C. (1993). The modern industrial revolution, exit, and failure of internal control systems. Journal of Finance, 48(3), 831–880.
Jensen, M.C., & Meckling, W. H. (1976) Theory of the firm: managerial behavior, agency costs and ownership structure. Journal of Financial Economics, 3, 305–360.
Joh, W. S. (2003). Corporate governance and firm profitability: evidence from Korea before the economic crisis. Journal of Financial Economics, 68, 287-332.
Johnson, S., Boone, P., Breach, A., & Friedman, E. (2000). Corporate governance in the Asian financial crisis. Journal of Financial Economics, 58, 141-186.
Klapper, L. F., & Love, I. (2004). Corporate governance, investor protection and performance in emerging markets. Journal of Corporate Finance, 10(5), 703–728.
Larcker, D. F., Richardson, S. A., & Tuna, I. (2007). Corporate governance, accounting outcomes, and organizational performance. Working paper, Graduate School of Business Stanford University & The Wharton School, University of Pennsylvania.
Lehmann, E., & Weigand, J. (2000), Does the governed corporation perform better? Governance structure and corporate performance in Germany. European Finance Review, 4, 157-195.
Ministry of State Owned Enterprise. (2002). Keputusan Menteri Badan Usaha Milik Negara, Nomor: KEP-117/M-MBU/2002, Penerapan Praktek Good Corporate Governance Pada Badan Usaha Milik Negara (BUMN).
Petersen, M. A. (2009). Estimating standard errors in finance panel data sets: Comparing Approaches. The Review of Financial Studies, 22(1), 435-480.
Ponnu, C. H. (2008). Corporate governance and the performance of Malaysian publicly-listed companies. International Review of Business Research Papers, 4(2), 217-230.
Pound, J. (1995). The promise of the governed corporation. Harvard Business Review, March– April, 89–98. Pricewaterhouse Coopers in Collaboration with Singapore Exchange. (1999). Survey of institutional investors.
Reddy, K., Locke, S., Scrimgeour, F., & Gunasekarage, A. (2008), Corporate governance practice of small cap companies and their financial performance: An empirical study in New Zealand. International Journal of Business Governance and Ethics, 4 (1), 51-78.
Renders, A., & Gaeremynck, A. (2006). Corporate governance and performance: Controlling for sample selection bias and endogeneity. FETEW Research Report AFI06–06, K. U. Leuven.
Republic of Indonesia. (2003). Undang-Undang Republik Indonesia Nomor 19 Tahun 2003 Tentang Badan Usaha Milik Negara. Jakarta, Indonesia.
Shleifer, A. & Vishny, R. (1986). Large shareholders and corporate control. Journal of Political Economy, 95, 461–488. Smith, A. (1776/1952) An Inquiry into the Nature and Causes of the Wealth of Nations. London: W. Strahan & T. Cadell. Striukova, L., Unerman, J., & Guthrie, J. (2008), Corporate reporting of intellectual capital: Evidence from UK companies. The
British Accounting Review, 20, 1-17
Appendix
Corporate Governance Questionnaire
1. Shareholders’ Rights / Annual General Meeting
1.1 Approval from shareholders
1.1.1 All matters that need the approval of shareholders during the Shareholders Annual General Meeting (AGM) are submitted according to company rules and regulations.
1.1.2 The AGM approves the Corporate Long-Term Plan formulated by the Board of Directors (BOD). 1.1.3 The AGM approves the Annual Plan & Budget proposed by the BOD.
1.1.4 The AGM approves the Annual Report and the Dividends Report.
1.1.5 The AGM approves the selection of the members of the Board of Commissioners (BOC) and the selection of the members of the BOD.
1.1.6 The AGM approves the selection of an external auditor.
1.1.7 The AGM approves the remunerations of the BOC and the BOD members.
1.2 Transparency of the BOC and BOD member selection process
1.2.1 There selection process for BOC members is transparent and uses an appropriate and proper procedure.
1.2.2 There selection process for BOD members is transparent and uses an appropriate and proper procedure.
1.3 Consultation with external parties (i.e., government, Technical Department, etc.)
1.3.1 The company consults with the appropriate parties regarding all activities or transactions that may significantly affect the company and its stakeholders.
1.4 Shareholders’ role in corporate responses to market conditions
1.4.1 The shareholders input feedback to actions taken by the company in response to market conditions.
1.4.2 The shareholders do not interfere with operations that have become BOD responsibilities according to the Corporate Articles of Association.
1.5 Conduct of the AGM
1.5.1 The AGM is conducted on time.
1.5.2 The AGM is conducted to discuss and decide on all important corporate matters. 1.5.3 The AGM uses a fair and transparent decision-making procedure.
1.5.4 The AGM Meeting Report contains all meeting discussions.
1.6 Selection of BOC members
1.6.1 The AGM stipulates an appropriate and proper system for the selection of BOC members. 1.6.2 The AGM approves the composition of the BOC, and the criteria for the selection of qualified
BOC members.
1.6.3 The AGM stipulates that a minimum of 20% of the BOC membership is independent
1.6.4 The AGM stipulates the regulations concerning any BOC member who holds multiple positions.
1.7 BOC evaluation
1.7.1 The AGM stipulates a formal BOC evaluation system. 1.7.2 The AGM evaluates the performance of the BOC as a team.
1.8 Selection of BOD members
1.8.1 The AGM stipulates an appropriate and transparent system for the selection of BOD members. 1.8.2 The AGM approves the composition of the BOD, and the criteria for the selection of qualified
BOD members.
1.8.3 The AGM stipulates that a minimum of 20% of the BOD membership is independent.
1.9 BOD evaluation
1.9.1 The AGM stipulates a formal BOD evaluation system. 1.9.2 The AGM evaluates the performance of the BOD as a team.
1.9.3 The AGM conducts a performance evaluation for each member of the BOD.
1.10 BOC and BOD remuneration systems
1.10.1 The AGM stipulates the remuneration systems of the BOC and of the BOD.
1.10.2 The AGM implements the approved remuneration systems of the BOC and of the BOD.
2. GCG Policy
2.1 A GCG Policy Manual is available.
2.1.1 The company has a Code of Corporate Governance.
2.1.2 The company has a Code of Ethics and/or a written Code of Conduct. 2.1.3 The company has an Audit Committee Charter.
2.1.4 The company has an Internal Audit Charter. 2.1.5 The company has an Internal Audit Policy Manual. 2.1.6 The company has a Risk Management Policy Manual. 2.1.7 The company has an Information Technology Policy.
2.1.8 The company has a policy manual concerning employee rights and obligations. 2.1.9 The company has a policy manual concerning customer rights and obligations. 2.1.10 The company has a policy manual concerning supplier rights and obligations. 2.1.11 The company has a policy manual concerning creditor rights and obligations. 2.1.12 The company has a policy manual concerning Corporate Social Responsibility (CSR)
2.2 GCG Manual Contents
2.2.1 The Code of Corporate Governance contains information such as: 2.2.1.1 a. Rights and obligations of the Shareholders’ AGM
2.2.1.2 b. Rights and obligations, tasks and responsibilities of each corporate function
2.2.1.3 c. Share ownerships, holding of multiple positions, and other matters with potential conflicts of interest
2.2.2 The Code of Conduct contains information such as: 2.2.2.1 a. Corporate values
2.2.2.2 b. Corporate behavior related to conflicts of interest, along with solutions and report mechanisms
2.2.2.3 c. Company policy regarding bribery
2.2.2.4 d. Company policy regarding the receiving and/or giving of gifts 2.2.2.5 e. Company policy regarding the receiving and/or giving of donations 2.2.2.6 f. Company policy and/or system regarding employee incentives
2.2.2.7 g. Company policy and/or system regarding enviromental matters, concerns, and corporate social responsibility
2.2.2.8 h. Company policy and/or system regarding employment, promotions, and retirement 2.2.2.9 i. Company ethics related to stakeholders (i.e., employees, customers, creditors, etc.) 2.2.2.10 j. Company mechanism for reporting violations of the Code of Conduct
3a. GCG Implementation: The Board of Commissioners (BOC)
3a 1. BOC induction and training procedures
3a 1.1 The BOC structures and conducts induction programs for new BOC members.
3a 1.2 The BOC conducts knowledge- and skill-enhancing or training programs for BOC members.
3a 2. Functions, segregation of duties, authority, and responsibilities 3a 2.1 The BOC stipulates decision-making mechanisms.
3a 2.2 The BOC delineates duties.
3a 2.3 The BOC formulates an annual work plan that include BOC targets, and reports results to shareholders.
3a 3. BOC planning
3a 3.1 The BOC provides advice during annual and long-term planning sessions. 3a 3.2 The BOC approves Corporate Long-Term Plans, Annual Plans, and
Annual Budgets.
3a 4. The BOC directs the BOD on the implementaton of plans and policies. 3a 4.1 The BOC evaluates the Corporate Vision and Mission, and provides
advice when necessary.
3a 4.2 The BOC provides advice regarding corporate risk management systems. 3a 4.3 The BOC provides advice regarding corporate information technology
systems.
3a 4.4 The BOC discusses and evaluates in an accurate, relevant, and timely manner all matters that require BOC attention or approval.
3a 4.5 The BOC maintains effective communications with the BOD outside of meetings (i.e., through email, gatherings, coffee mornings, teleconferences, etc.).
3a 4.6 The BOC authorizes transactions and activities that need BOC approval.
3a 4.7 Per advice of the Audit Committee, the BOC proposes a candidate for the position of External Auditor to the AGM.
3a 4.8 The BOC is actively involved in building up the corporate reputation.
3a 5. The BOC controls BOD implementaton of strategy and corporate policies.
3a 5.1 The BOC controls and monitors BOD compliance with state laws and regulations. 3a 5.2 The BOC controls and monitors BOD compliance with annual plans, long-term plans, and
management contracts.
3a 5.3 The BOC evaluates BOD business performance and submits evaluation results to shareholders. 3a 5.4 The BOC reports extraordinary activities and/or transactions to shareholders, and implements
corrective actions according to BOC regulations.
3a 6. BOC information access
3a 6.1 The BOC actively searches for alternative information sources to overcome any barriers to effective information dissemination with the BOD.
3a 7. The BOC role in BOD member selections
3a 7.1 The BOC follows a criteria for the selection of candidates for BOD membership, and proposes such candidates to shareholders.
3a 8. The BOC and conflicts of interest
3a 8.1 Each BOC member signs a letter confirming the non-existence of potential conflicts of interest. 3a 8.2 Each BOC member submits to shareholders a written statement in the event of any activities or
transactions that may result in conflicts of interest.
3a 9. The BOC and transparency
3a 9.1 The BOC disseminates relevant information to shareholders and stakeholders as authorized, according to company rules and regulations.
3a 9.2 The BOC observes equality and fairness in disseminating information to stakeholders.
3a 10. Monitoring effectiveness of GCG practice
3a 10.1 The BOC monitors company implementation of GCG principles (i.e., accountability, responsibility, fairness, independence). When possible, monitoring is conducted by a GCG Committee. 3a 10.2 The BOC conducts self-assessments on the BOC performance evaluation.
3a 11. The BOC and routine meetings
3a 11.1 The number of BOC meetings are based on the company’s Articles of Association. 3a 11.2 The BOC establishes meeting rules and regulations.
3a 11.3 BOC members attend BOC meetings.
3a 11.5 An evaluation of the implementations of previous meeting decisions is conducted in every BOC meeting.
3a 11.6 Every BOC member who attends a BOC meeting must input concurrence, objections, or suggestions regarding the contents of the meeting report, within 14 days after the report’s delivery date.
3a 12. The Secretary to the Commissioner
3a 12.1 There is a clear job description for the position of Secretary to the Commissioner.
3a 12.2 The Secretary to the Commissioner conducts administrative duties, including the correct filing and classification of BOC documents.
3a 12.3 The Secretary to the Commissioner prepares meeting invitations, attends BOC meetings and prepares meeting reports.
3b. GCG Implementation: The BOC Committees
3b1. Availability of BOC Committees
3b1.1 The company has established BOC Committees (i.e., Audit Committee, etc.) according to company rules and regulations.
3b2. BOC Committee membership criteria
3b2.1 All committee members possess knowledge appropriate and experience relevant to their tasks in their BOC committees.
3b3. BOC Committee members’ independency
3b3.1 Committee members are from external parties and are independent of management operations, share ownerships.
3b4. Duty Framework
3b4.1 There is a clear job description for each position in the BOC Committees.
3b4.2 The BOC implements the selection and dismissal of the heads and members of each BOC Committee, and reports such activities to the shareholders or the AGM.
3b4.3 The head of each BOC Committee is a member of the BOC.
3b5. BOC Committee activities
3b5.1 The Audit Committee controls all internal and external audits, according to company regulations. 3b5.2 The Audit Committee conducts routine internal meetings and joint meetings with internal auditors. 3b5.3 The Nomination Committee stipulates the selection criteria and the nomination procedure for the
selection of BOC and of BOD members, evaluates and submits recommendations regarding the total number of board members.
3b5.4 The Remuneration Committee designs an incentives system and evaluates existing remuneration systems (i.e., pension plans, stock options,etc).
3b5.5 The Insurance and Business Risk Committee conducts periodic evaluations on business risks and provide recommendations regarding risk mitigation and control.
3b6. BOC Committees and routine meetings
3b6.1 All BOC Comittees plan activities at the start of a year and implements these activities, as planned. 3b6.2 All BOC Committee Meeting Reports summarize all discussions in the meetings.
3b7. Reporting to the BOC
3b7.1 All BOC Committees periodically report their activities to the BOC.
3c. GCG Implementation: The Board of Directors (BOD)
3c1. BOD and training programs
3c1.1 The BOD conducts induction programs for new BOD members
3c1.2 The BOD conducts knowledge- and skill-enhancement or training programs for BOD members
3c2. Function, segregation of duties, authority, and responsibilities 3c2.1 The BOD creates a clear organizational structure.
3c2.2 The BOD defines the roles and responsibilities of subordinates. 3c2.3 The BOD hires qualified corporate managers.
3c3. BOD and corporate planning
3c3.1 The BOD distributes a Long-Term Plan to the BOC or the shareholders, which comprise the following minimum information:
a. Evaluation of results of previous Corporate Long-Term Plans. b. Current corporate market position.
c. Assumptions used in the formulation of the current Corporate Long-Term Plan. d. Corporate strategies, targets, policies, and work plans.
3c3.2 The BOD formulates an Annual Work Plan & Budget based on the Corporate Long-Term Plan 3c3.3 The BOD submits the Corporate Long-Term Plan to the BOC or to shareholders, which comprise
information such as:
a. Corporate vision, mission, strategy, policies, and work programs b. Budget for each work program
c. Corporate financial projections and budgets for its subsididaries d. Other acivities that need shareholders’ approval
3c3.4 The BOD establishes formal Standard Operating Procedures (SOPs) for the conduct of all business activities.
3c3.5 The BOD identifies all relevant business opportunities.
3c3.6 The BOD creates a succession plans for each key corporate managerial position, and reports these plans to the BOC.
3c4. BOD and performance targets
3c41. The BOD establishes corporate performance indicators.
3c42. The BOD establishes performance indicators for each business unit. 3c43. The BOD conducts analysis of corporate performance achievements. 3c44. The BOD conducts appropriate analysis for every corporate decision.
3c45. The BOD creates a statement or certification regarding internal audit effectiveness.
3c46. The BOD establishes a risk management system, according to company rules and regulations. 3c47. The BOD establishes an information technology system, according to company rules and regulations. 3c48. The BOD implements a quality assurance system for all corporate products and services.
3c49. The BOD procures goods and services according to the rules and regulations.
3c5. The BOD and work plan implementation
3c51. The BOD reports on risk management practices to the BOC.
3c52. The BOD reports on information technology system practices to the BOC.
3c53. The BOD reports on the implementation of corporate performance management systems to the BOC. 3c5.4 the BOD follows up on internal and external audit recommendations.
3c6. The BOD and conflicts of interest
3c61. The BOD establishes policies concerning conflicts of interests.
3c62. Each BOD member submits a signed, written statement verifying the absence of potential conflicts of interest.
3c63. Each BOD member provides a written statement regarding activities and transactions that may result in conflicts of interest, and submits these statements to the BOC.
3c6.4 The BOD establishes a mechanism to help board members and senior managers avoid practices related to corporate fraud.
3c7. The BOD and transparency
3c73. The BOD observes a policy of fairness and transparency in disseminating information to shareholders, the BOC, and to stakeholders.
3c8. The BOD and routine meetings
3c8.1 Each BOD member attends BOD meetings, as well as BOC and BOD joint meetings. 3c8.2 The BOD establishes and implement meeting rules and regulations.
3c8.3 Each BOD Meeting Report contains all discussions of each meeting.
3c8.4 The BOD evaluates the implementation of previous BOD meeting decisions.
3c8.5 Each BOD member who attends a BOC meeting inputs agreements, objections, or advice regarding the Meeting Reports, within 14 days after the report’s delivery date
3d. GCG Implementation: The Internal Audit Unit (IAU)
3d1. The Internal Audit Unit
3d1.1 In the organizational structure, the Internal Audit Unit (IAU) is directly under the company president or director.
3d1.2 Each member of the IAU is qualified to implement individual duties.
3d1.3 There is an audit manual, established work mechanisms, and appropriate supervision for the IAU.
3d2. IAU evaluation and monitoring functions
3d2.1 The IAU carries out its activities as specified in the Annual Work Plan.
3d2.2 The IAUreports to the company president/director, and to the Audit Committee. 3d2.3 The IAU conducts effectiveness tests on internal corporate controls.
3d2.4 Per previous audit recommendations, the IAU controls and monitors corrective activities.
3d3. The Internal Audit Unit (IAU) as a strategic management partner
3d3.1 The IAU provides advice on procedures and on business process controls.
3d3.2 The IAU provides advice and recommendations on business strategy implementation.
3e. GCG Implementation: The Corporate Secretary
3e1. The Corporate Secretary
3e1.1 The Corporate Secretary is qualified to implement the functions of the position. 3e1.2 In the organizational structure, the Corporate Secretary is directly under the BOD.
3e2. The Corporate Secretary: Activities
3e2.1 The Corporate Secretary distributes relevant information to the company stakeholders. 3e2.2 The Corporate Secretary undertakes the role of liason.
3e2.3 The Corporate Secretary performs roles and responsibilities including AGM documentation. 3e2.4 The Corporate Secretary reports to the BOD.
4 Disclosures
4.1 Stakeholder access to corporate information
4.1.1 Information regarding GCG implementation has been disclosed and distributed to all company stakeholders, including shareholders.
4.2 Access to information regarding GCG policies and practices
4.2.1 The company provides a medium of communication to stakeholders regarding the Code of Conduct.
4.2.2 The company provides a medium of communication to stakeholders regarding GCG implementation.
4.2.3 The company publishes a public Annual Report.
4.3 Annual Reports: Disclosures
4.3.1 The Annual Report contains information regarding GCG implementation, including: a. Vision and mission
b. Strategy and objectives
c. Composition of share ownerships
d. BOC Member Profiles e. BOD Member Profiles
f. Number of meetings and attendance
g. Remuneration of each BOC and BOD member
h. Description of supporting units for GCG implementation i. Descriptions of the Independent Commissioner
j. CSR
k. Corporate Profile l. Risk Management System m. Audited Financial Report n. Corporate Performance
o. Corporate Responsibility regarding Stakeholder Rights p. Independent Assessments from External Parties q. Disclosures on litigation materials
r. Material transactions with external parties and affiliates s. Stocks owned by BOC and BOD members
5 Commitments
5.1 Signed commitments
5.1.1 Each corporate member has signed a letter of compliance with the Code of Conduct. 5.1.2 Each BOC member, BOD member, and shareholder has signed a Management Contract. 5.1.3 Each BOC member, BOD member, and shareholder has signed a Statement of Corporate Intent.
5.2 GCG conduct
5.2.1 The company has formed a team to monitor and control GCG implementation, and to submit reports to the BOC and the BOD.
5.2.2 Each corporate member has received and understood the contents of the Code of Corporate Governance.
5.2.3 Each corporate member has received and understood the contents of the Code of Conduct. 5.2.4 The company has established a reward and punishment systems to support the implementation
of the Code of Conduct.
5.2.5 There is a standard mechanism for handling stakeholder complaints.
5.3 Corporate compliance with rules and regulations