Accepted Manuscript
Integrating particle physical geometry into composting degradation kinetics Yongjiang Wang, Ping Ai
PII: S0960-8524(15)01476-5
DOI: http://dx.doi.org/10.1016/j.biortech.2015.10.073
Reference: BITE 15698
To appear in: Bioresource Technology Received Date: 31 August 2015
Revised Date: 19 October 2015 Accepted Date: 20 October 2015
Please cite this article as: Wang, Y., Ai, P., Integrating particle physical geometry into composting degradation kinetics, Bioresource Technology (2015), doi: http://dx.doi.org/10.1016/j.biortech.2015.10.073
Integrating particle physical geometry into composting degradation kinetics
Yongjiang Wang*†, Ping Ai*
* Huazhong Agricultural University, College of Engineering, 1 Shi-zi-shan Street, 430070, Wuhan, China
†
Corresponding author. Tel.: +86 131 2501 3679. Email address: [email protected]
Abstract:
The study was carried out to integrate physical geometry of compost particle with
degradation kinetics to model biological reactions, which revealing additional dynamic
approaches. A sphere and its circumscribing cube were used to represent compost
particles. An inner sphere, representing anaerobic zone, was introduced to describe
variations of substrate volume without sufficient oxygen supply. Degradation of soluble
substrates and hydrolysis of insoluble substrates were associated with the particle
geometry. Transportation of soluble substrates produced from hydrolysis was expressed
using Fick’s law. Through the integration of degradation kinetics with geometry models,
degradation models could describe varying volume of composting materials involving
aerobic or anaerobic digestion and transportation of soluble substrates in a unit compost
particle.
Keywords:
1 Introduction
Composting is a practical treatment method for various organic wastes such as
manure and straws (Talib et al., 2014; Zhang & Sun, 2014; Zhou et al., 2014). These
wastes can be converted through composting to form stabilized fertilizer or soil
supplement, which is beneficial to plant growth and helps alleviate environmental
pressure. Substrate degradation produces heat, carbon dioxide, and water while
consuming oxygen, which is one of the main components driving the composting
process (Lin et al., 2008; Talib et al., 2014; Tognetti et al., 2008; Woodford, 2009; Zhou
et al., 2014). Substrate degradation is a rather complex process that involves
heterogeneous substrate variations and diverse groups of microorganisms coupled with
physical and biochemical reactions, which makes the process hard to understand.
Mathematical modeling of composting degradation provides an approach of systematic
thinking and a way of understanding the complex process. A number of models have
been reported by different researchers (Chai et al., 2013; Hamelers, 2001; Hamelers,
2004; Kaiser, 1996; Li et al., 2013; Talib et al., 2014; Vlyssides et al., 2009; Wang et al.,
2013; Wang et al., 2014; Woodford, 2009). In most cases, the following degradation
related modeling state variables are considered: temperature, moisture content, substrate
properties, free air-space, and oxygen content. Besides particle form and compaction,
previous studies also reported that particle size of composting material had influences
on free air-space and aerobic layer thickness, both of which could affect substrate
degradation (Ge et al., 2014; Hamelers, 2001; Huet et al., 2012). In the study to develop
a theoretical model of a single composting particle, geometric structure of the
composting particle was presented as a two-sided flat plate where substrate degradation
of the dynamic thickness of the aerobic layer found an exponential increase of aerobic
layer thickness during composting process (Ge et al., 2014). However, few studies have
included comprehensive physical geometry of compost particle into degradation
kinetics.
The purpose of this study was to develop a physical model that incorporates the
physical geometry of compost particles into composting degradation kinetics that takes
into account the amount of soluble and insoluble substrates. The main goal is to relate
the physical state of compost material with its biochemical reactions.
2 Materials and Methods
2.1 Problem definition
Composting is the aerobic digestion of organic substrates. Sludge and wet manure,
in which the pore spaces can be reasonably assumed to be zero, should be mixed with
bulking agents (Haug, 1993). Bulk particles formed during this mixing process and the
shape and/or size of the compost particles could have important effects on organic
matter degradation.
Of interest in this study is the mathematical description of the physical state of
composting material, or bulk particles, and to illustrate the relationship of the physical
state with the degradation kinetics. The composition of composting mixture (fractions of
gas, water, and solids in this case) is of great importance to determine its physical
characteristics geometrically.
Previous study by Haug (1993) considered the composting mixture as a
three-phase porous substrate of solids, water, and gas. Also considering compost as
porous substrate in this study, a schematic representation of a composting sample is
a volume of 1/6· ·d3. If all this volume is filled with solids and water, the gas volume
should be d3-1/6· ·d3, as shown in Figure 1(B). Under such assumptions and
simplifications, it can be concluded that
The free air-space is about 47.65% (Free air-space is defined as the ratio of gas
volume to total volume while porosity is defined as the ratio of void volume,
including gas volume and water volume, to total volume. To avoid possible
misunderstanding the concept of free air-space is used in this study);
The density (or bulk weight) of the composting materials is 523.6 kg m-3 if the
sphere is filled with water only. The density would actually be greater than
523.6 kg m-3 since normally the specific density (or gravity) of composting
solids is greater than that of water (Van Lier et al., 1994);
The free air-space doesn’t vary with compost particle size.
The model was promising in providing a method to calculate free air-space, as well
as clearly describing how compost particles are bonded to and supported by each other.
In addition, making the diameter (referred to as apparent diameter here) equal to the
side length of the cube was practically meaningful, since the diameter was measurable
and related to particles size. However, there are limitations in the model as illustrated by
the following cases:
Trial A: In a previous study (Wang et al., 2011) to research the effects of initial free
air-space on co-compost of swine manure and wheat straw at a mass ratio of 1: 0.086
and with a straw size of about 0.3-1 cm, a free air-space of 56.70% could be obtained.
The total solids content, volatile solids content, and density of the compost mixture
were 33.2%, 0.86, and 420 kg m-3, respectively. Since straw size as long as 1 cm could
form more ratio of gas volume to total volume, the assumption of one apparent sphere
Trial B: Based on composting practice and literature analysis, Haug (1993) pointed
out that free air-space of about 30% was recommended for composting system. As an
example, if organic slurry was dewatered to a total solids content of 30% and mixed
with recycling compost to gain a total solids content of 45%, considering a free
air-space of 30%, the density could be as high as 850 kg m-3 (assuming a volatility of
0.50). Under such conditions, the geometric simplification of equal diameter and side
length of the cube would not be applicable.
Trial C: Taking fresh swine manure as an example, the total solids and volatile
solids were about 30% and 0.85 (fraction, dry based), respectively (Wang et al., 2011)
(assuming a unit bulk weight of 1100 kg m-3). The total volume of the manure was made
up of both the volume of solids and water. Applying Haug’s weight-and-volume
relationship to swine manure (Haug, 1993), the unit dry solid weight was calculated to
be 330 kg m-3, which was less than 523.6 kg m-3.
It can thus be seen that the fixed sphere geometry, describing three-phase
composition of composting mixture, could not be applied to actual cases. Changes were
needed to improve the physical model.
The solids and water fraction in Trial A should be lower. A way to lower solids and
water fraction while keeping the apparent sphere was to create an inner sphere, diameter
d1, that had no gas fraction. The space between inner and apparent sphere, however, had
solids, water, and gas phases (Figure 1(C)). The gas volume in the space between the
inner and apparent sphere could be determined with free air-space calculation. Particles
geometry could be further broken down into a comb-like shape (Figure 1(D)), which
could supply a model for calculating the convective surface area.
In contrast to Trial A, solid and water fractions in Trial B should be higher. This
up space between the apparent sphere and the cube (Figure 1(E)). According to the
analysis in Trial C, the inner sphere had enough volume for solids fraction of swine
manure but was unable to accommodate both solids and water, and this was also true for
most manure materials. Thus, it could be assumed some extra water would take up the
volume within the apparent sphere and the cube, and this was a different situation from
Trial A (Figure 1(E)). Both Trial B and Trial C will not be covered in this current study.
To sum up, the following discussion about geometric modeling of compost
particles was conducted only for Trial A or composting process with free air-space
greater than 47.65% and a bulk density less than
3
Where δs defined_ is the defined unit bulk weight of the substrate solids
(Numerically equals to the volumetric weight of water with a free air-space of 47.65%);
w
δ is the unit weight of water (kg m-3); s
S is the fractional solids content of the
substrate or mixture (-); Gs is the specific density or gravity of the substrate solids (kg
m-3); d is the diameter of the sphere or the side length of the cube (m).
2.2 Model development
2.2.1 Physical consideration
Maintaining proper free air-space is essential during composting process. Oxygen
transportation will be restricted if free air-space is not enough. However, too much free
air-space means relatively lower portion of substrate and water available for biomass
growth. Thus, free air-space is an important variable for degradation model
development. Considering the compost mixture as a three-phase system of gas, water,
As presented in Figure 1, free air-space was schematically divided into fc and fs,
which were free air-space in between the cube and apparent sphere and free air-space in
between apparent and inner sphere, respectively. The free air-space in between the
apparent and inner sphere could be expressed as:
s c
f = f − f (3)
The free air-space in between the cube and apparent sphere was calculated using
the following equation:
Maintaining proper free air-space is very important for aerobic composting process.
It makes sufficient oxygen transportation possible. The inner sphere has solids and
water phases, containing little or no gas volume, which made the biological reactions in
it very different from the reactions in between the apparent and inner sphere. The
volume of the inner sphere could be expressed as:
Where
i
v is the volume of the inner sphere (m3); vs is the volume of apparent sphere
(m3); vc is the volume of the cube (m3); fs is the free air-space ratio in between
apparent and inner sphere (-); rf is the fractional gas content of volume in between the
apparent and inner sphere (-). Of model development strategies in this study, vi is the
space where anaerobic digestion takes place while (vs−vi) is the space where aerobic
degradation occurs. As in Figure 1, d represents physical particle size of composting
materials which affects variations of vi and vs. Here rf determines fractional
volume of gas, water and solid of a composting particle. Those parameters are
geometrically important to biological degradation.
With the volume of the inner sphere determined, its diameter could therefore be
expressed as:
The volume of solids and water in between the apparent and inner sphere was
calculated as:
v is the volume of solids and water in between the apparent and inner sphere (m3);
s
v is the volume of apparent sphere (m3); vi is the volume of the inner sphere (m3);
f
2.2.2 Biological consideration
ADM 1 was an advanced anaerobic digestion model developed by International
Water Association group for mathematical modeling of anaerobic digestion processes,
in which the substrates such as manure and food waste, was divided into soluble
substrates and insoluble substrates (Batstone et al., 2002). Soluble substrates were
involved with biological reactions directly, while the disintegration of insoluble
substrates was incorporated into steps that include phase separation and physical
breakdown. A composting model, to simulate substrate degradation and oxygen
consumption, was developed with soluble and insoluble substrates (Lin et al., 2008).
Woodford (2009) adopted the notion of soluble and insoluble substrates too, but further
distinguished the substrates into ready-to-degrade substrates, slower-to-degrade
substrates, and resistant-to-degrade substrates.
Biological degradation in this study used the concept of soluble and insoluble
substrates but the biochemical reactions in the fields of vb and vi were different. The
solids and water in between the apparent and inner sphere, vb, was more likely supplied
with sufficient oxygen, and therefore allowed aerobic digestion to occur. The solids and
water in the inner sphere, vi, was more likely degraded via anaerobic digestion.
2.2.2.1 Degradation in v b
The consumption of the soluble substrates could be written as:
1
S is the concentration of soluble substrates in between the apparent and inner
self-feeding rate from hydrolysis of insoluble substrates in this volume (kg m-3 h-1); Ysi
is the conversion rate from insoluble substrates to soluble substrates (-); vb is the
volume of solids and water in between the apparent and inner sphere (m3); tbi is the
transfer rate of soluble substrates from the inner sphere (kg h-1).
The degradation rate was expressed as a first-order kinetic:
20 60
adjustment factor (-); Ssb is the concentration of soluble substrates in between the
apparent and inner sphere (kg m-3).
The moisture adjustment factor was calculated using an empirical equation (Haug,
1993):
S is the fractional solids content of the substrate (-).
The rate of hydrolysis for the conversion of insoluble substrates to soluble
substrates could be expressed as:
( )
the concentration of insoluble substrates in between the apparent and inner sphere (kg
m-3); Ki is the half saturation constant of insoluble substrates (kg m-3). h T( ) is the
range from 5 to 75 ºC as (Lin et al., 2008):
0.0182
( )T T
h = ⋅ (12)
According to Fick’s law, the net transfer rate of soluble substrates from the inner
sphere to vb could be written as:
substrates in the inner sphere (kg m-3); Ssb is the concentration of soluble substrates in
between the apparent and inner sphere (kg m-3); d is the diameter of the sphere or the
side length of the cube (m); d1 is the diameter of inner sphere (m).
The variation of insoluble substrates in vb could be calculated as:
ib
Similarly, the variation of insoluble substrates in the inner sphere could be
expressed as:
the hydrolysis rate for conversion of insoluble substrates to soluble substrates in the
inner sphere, which could be calculated with Equation 11 (in this case, x equals ii).
The rate of change in soluble substrates in the inner sphere was calculated as:
1 si
dS
h Y t
Where
si
S is the concentration of soluble substrates in the inner sphere (kg m-3); t is the
time (h-1); hii is the hydrolysis rate for the conversion of insoluble substrates to soluble
substrates in the inner sphere (-); Ysi is the yield from insoluble substrates to soluble
substrates (-); vi is the volume of solids and water in inner sphere (m3); tbi is the
transfer rate of soluble substrates from the inner sphere to volume between the apparent
sphere and the inner sphere. (kg h-1).
The focus of this study was degradation kinetic based on a proposed theoretical
model of composting geometric particle. It should be noticed that ambient parameters
such as temperature and humidity could also affect the kinetic. Ambient temperature
normally had influence on compost temperature which was incorporated in Equation 9,
11 and 12. Ambient humidity could affect latent heat of water vaporization, affecting
variations of compost temperature. Ambient humidity could also had influences on
moisture content of compost which was included in Equation 9.
2.3 Case study
A real-world composting practice was introduced to employ the model as a case
study. In a previous composting experiment (Wang, 2014), swine manure and wheat
straw were mixed as conditioning to an initial moisture content of 65%. The initial
mixture density was measured to be approximately 420 kg m-3. Woodford (2009) tested
compositions of wheat straw and manure, and found that the ratios of soluble substrates
to insoluble substrates were 22.4:70.6 and 60.3:37.5, respectively. Considering the
compost mixture was made of water, soluble substrates, insoluble substrates, and ash,
the initial concentrations for those components were determined to be 273, 75.6, 50.4
ib
S , Sii, Ssi in Equations 8, 14, 15, 16 were set to be 75.6, 50.4, 50.4, and 75.6 kg m-3,
respectively. The sphere diameter of solid and water fraction, d, was assumed to be
5×10⁻³ m, as the bulking straw size in this case was measured to be 1-10 ×10-3 m.
The temperature, mixture density, and solids content data, referring to previous
study (Wang, 2014), during composting process were fitted with MATLAB ‘Signal
Builder’ function, with results supplied as feeds for Equation 2, 9, 10, 11, 12. Other
important model configuration values can be found in Table 1. Diffusion coefficient was
introduced to describe the transportation of soluble substrates from inner sphere to the
volume in between the apparent and inner sphere. The higher the diffusivity, the higher
rate these substrates diffuse into the different volume (Cussler, 1997). In the case study,
the transportation was assumed to be a one-way diffusion from the inner sphere. Model
sensitivity tests showed that diffusion values mainly had influence on transfer speed,
without affecting much of the degradation kinetics.
For the deterministic model developed, outputs could be presented with a
credibility if average deviation or standard deviation of input data could be included in
the model, which might be of interest for future study. Experimental data in the case
study included parameters, coefficients and variables. Model parameters could be
roughly divided into geometric parameters and degradability parameters. Those two set
of parameters were normally measurable and should be configured specifically for each
simulation run. Input of coefficient values were collected from previous studies while
input of variables such as temperature and moisture variation were fitted with previous
3 Results and discussion
3.1 Changes in d1, vi and vb
1
d was the diameter of inner sphere, in which hydrolysis of insoluble substrates to
soluble substrates occurred. The produced soluble substrates were then transferred to the
field vb where aerobic digestion occurred. Combining Equation 2 to 6, the diameter of
inner sphere could be expressed as:
3
r is the fractional gas content of volume in between the apparent and inner
sphere (-); f is the volumetric fraction of free air-space of the mixture (-); d is the
diameter of the sphere or the side length of the cube (m).
i
v was described as an anaerobic field in this study. The produced soluble
substrates were transferred outside and then involved in aerobic degradation. In this
perspective, anaerobic hydrolysis steps occurred in the simulated inner sphere without
further fermentation of soluble substrates to VFAs and methane, like it did during
anaerobic digestion for biogas (Batstone et al., 2002). The volume variation of inner
sphere could be written as:
3
If the volumetric fraction of gas in between the apparent and inner sphere and the
side length of the cube were constant, the simulated volume of inner sphere would have
b
v was the volume of solids and water in between the apparent and inner sphere,
changing with vi in an opposite manner during the fermentation process. It was the
field where soluble substrates, both from vb itself and vi, were degraded by aerobic
microorganisms, producing carbon dioxide, water, and heat while consuming oxygen.
The change in vb and Ssb both had influences on degradation speed. vb could be
calculated by combining Equation 2-5 and 7:
3
With water evaporation and substrates degradation, the composition of composting
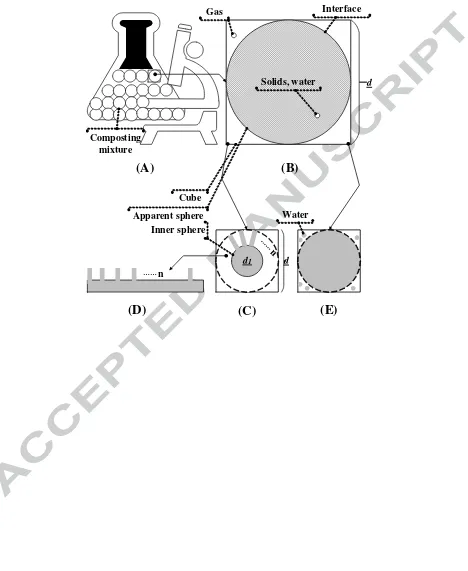
mixture changed over time, leading to variations of d1 which was presented in Figure
2. Starting from about 2.53×10⁻³ m, the diameter decreased to about 2.11×10⁻³ m at the
end of the simulation. It was expected the inner sphere was shrinking due to water
evaporation. This would result in an increase in free air-space during composting
process. In a study to research free air-space and its dynamical changes during
co-composting of sewage sludge and swine manure, free air-space was measured as
18.3%, 26.6%, 42.3%, 52.4% and 54.7% at day 0, 3, 10, 20, and 32, respectively (Chen
et al., 2004). However, free air-space could also decline due to organic wastes
degradation and compaction as composting proceeded (Kulcu et al., 2008; Zhang & Sun,
2014). It should be noted that there was a slight increase at the beginning of the
composting, probably because of the intense water production. Manure itself contained
ready-to-degrade substrates and those substrates would degrade quickly once proper
aerobic environment was achieved. Fast substrate-degradation rate leads to net water
production, filling up some free air-space, and the inner sphere could become relative
2015). The increase in water content was observed in the beginning phase of a
composting practice (Cai et al., 2012). This situation is more likely to happen in reactor
composting system since water evaporation rate is relatively slow when aeration speed
is slow, comparing to that of aerated static pile. Generally, moisture content is
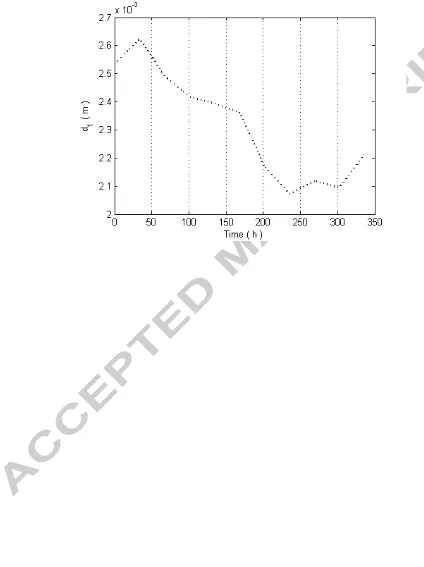
decreasing throughout the composting process. The variations of vi and vb for the
case study were shown in Figure 3. The average volume for vi and vb were 6.75×10⁻⁹
and 1.30×10⁻⁷ m3, respectively. Averaged vb was about 19 times as big as vi which
meant that most of the composting substrates were exposed to aerobic environment in
the case study. Previous study found that adding coal ash had significant influence on
composting of food waste (An et al., 2012). The effects of coal ash to alleviate pH drop
was mentioned in the research. Adding coal ash could also change compost size, leading
to an active aerobic digestion and making accumulation of VFAs impossible. Geometric
features of the compost particles were of interest in this study. Diameter of inner sphere
was evolving during composting process as in Figure 2, showing that the volume of
substrate undergoing anaerobic digestion was changing accordingly. Figure 3 illustrated
the competing changes of anaerobic volume and aerobic volume. The aerobic volume
was increasing with decreasing of inner sphere diameter. This might lead to insights of
enhancing aerobic volume by maintaining proper particle size and free air-space.
3.2 Degradation
In this study, degradable substrates were divided into soluble substrates and
insoluble substrates. Both the degradation of soluble substrates and hydrolysis of
insoluble substrates occurred in vb, while hydrolysis of insoluble substrates to soluble
substrates occurred in vi. The produced soluble substrates in vi could diffuse into vb
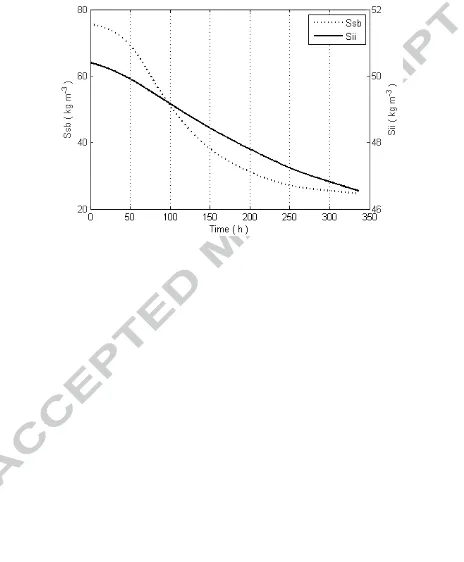
soluble substrates in vb and insoluble substrates in vi are shown in Figure 4. Soluble
substrates tended to decrease throughout the composting process from 75.6 to 24.7 kg
m-3. The degradation rate was relatively fast from 50 to 200 hours, but slowed down in
the following hours. The fast degradation rate of soluble substrates was expected since
the substrate concentration was high and there was low inhibition from both moisture
(lack of) and compaction in the beginning of the composting process (El Kader et al.,
2007; Haug, 1993; Huet et al., 2012). Insoluble substrates degradation in vi presented
a liner-like variation from 50.4 to 46.5 kg m-3. It showed that anaerobic hydrolysis rate
was lower compared to degradation rate of soluble substrates. In addition, the linearity
of curve showed that the influences of temperature and substrates concentration on
degrading rate were not as significant as the influences on degradation of soluble
substrates. Initial concentration of Sii was set to 50.4 kg m-3 for mixture of swine
manure and wheat straw, which was lower than that of the configured half saturation
constant, resulting in a limited influence from concentration variations. From Equation
12, the temperature-related correcting coefficient for hydrolysis rate ranged from 0.5 to
1.2. This is a quite roughly regressed relationship from previous study, thus there is a
possibility that the model underestimated the effect of temperature on anaerobic
hydrolysis. Further studies should be conducted to research the effect of the temperature
correction factor on hydrolysis during composting process.
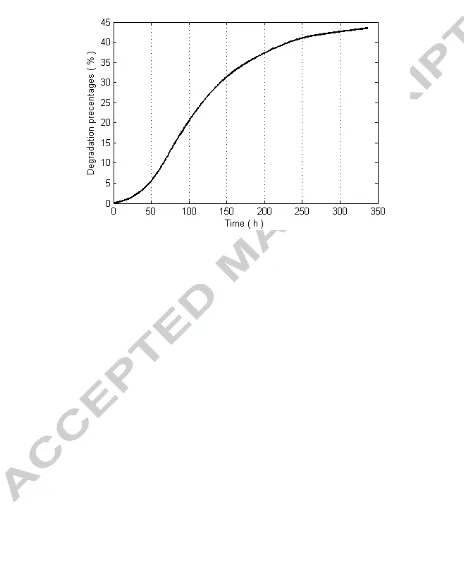
Degradability is an important factor to indicate composting process (Tognetti et al.,
2008). The percentage of degraded substrates to total initial concentration was shown in
Figure 5. Degraded substrates included both soluble and insoluble substrates in vb and
i
v . In a composting period of approximately 14 days, the percent substrate degraded
debris, chicken manure, steer manure and garbage were reported to be 66%, 68%, 28%
and 60%, respectively (Haug, 1993). Those results were comparable to the simulation in
this study even though some of the reported measurements in literature were made
under anaerobic conditions.
The proposed model achieved simulations of both aerobic and anaerobic
degradations with integration of particle geometry rather than only composition of
compost particle. Further studies may carry out to investigate the formation of compost
particle related to compaction, moisture content, depth and/or size of bulking agents.
4 Conclusions
This study integrated particle geometry into simulation of degradation, revealing
additional approaches for degradation dynamics. Physical models with following
characteristics was developed: 1) particle geometry and its relationship with free
air-space was taken into account, upon which a geometric field where anaerobic
hydrolysis occurred was innovatively defined; 2) degradation kinetics incorporating
uptake of soluble substrates and hydrolysis of insoluble substrates was incorporated into
the model; 3) transportation of hydrolysis produced soluble substrates was
comprehensively addressed by Fick’s law. The results showed modeled diameter of
inner sphere varied from 2.1 to 2.5×10⁻³ m, and degradability approached 45% in the
case study.
Acknowledgements
The study was carried out under Project 2662014BQ040 and 2662015QC034
supported by the Fundamental Research Funds for the Central Universities. Thank the
National Natural Science Foundation of China (No.51406064) for their financial
Environmental Science and Technology, University of Maryland at College Park, for his
valuable inputs.
References
1. An, C.-J., Huang, G.-H., Yao, Y., Sun, W., An, K. 2012. Performance of in-vessel composting of food waste in the presence of coal ash and uric acid. J. Hazard. Mater., 203–204, 38-45.
2. Batstone, D.J., Keller, J., Angelidaki, I., Kalyuzhnyi, S., Pavlostathis, S., Rozzi, A., Sanders, W., Siegrist, H., Vavilin, V. 2002. The IWA Anaerobic Digestion Model No 1(ADM 1). Water Sci. & Technol., 45, 65-73.
3. Cai, L., Gao, D., Chen, T.-B., Liu, H.-T., Zheng, G.-D., Yang, Q.-W. 2012. Moisture variation associated with water input and evaporation during sewage sludge
bio-drying. Bioresour. Technol., 117, 13-19.
4. Chai, E.W., H'ng, P.S., Peng, S.H., Wan-Azha, W.M., Chin, K.L., Chow, M.J., Wong, W.Z. 2013. Compost feedstock characteristics and ratio modelling for organic waste materials co-composting in Malaysia. Environ. Technol., 34, 2863-2870.
5. Chen, T.-b., Luo, W., Gao, D., Zheng, G.-d. 2004. Stratification of free air space and its dynamics in the process of co-composting. Huan jing ke xue, 25, 150-153.
6. Cussler, E.L. 1997. Diffusion: Mass Transfer in Fluid Systems (2nd ed.). Cambridge University Press, New York.
7. El Kader, N.A., Robin, P., Paillat, J.-M., Leterme, P. 2007. Turning, compacting and the addition of water as factors affecting gaseous emissions in farm manure
composting. Bioresour. Technol., 98, 2619-2628.
8. Ge, J., Huang, G., Yang, Z., Huang, J., Han, L. 2014. Characterization of the Dynamic Thickness of the Aerobic Layer during Pig Manure Aerobic Composting by Fourier Transform Infrared Microspectroscopy. Environ. Sci. Technol., 48, 5043-5050.
9. Hamelers, H. 2001. A mathematical model for composting kinetics, Wageningen University.
10. Hamelers, H. 2004. Modeling composting kinetics: A review of approaches. Rev. in Environ. Sci. and Biotechnol., 3, 331-342.
11. Haug, R.T. 1993. The practical handbook of compost engineering. Lewis Publishers, Boca Raton, FL.
13. Kaiser, J. 1996. Modelling composting as a microbial ecosystem: a simulation
approach. Ecol. Model., 91, 25-37.
14. Kulcu, R., Sönmez, ., Yaldiz, O., Kaplan, M. 2008. Composting of spent mushroom compost, carnation wastes, chicken and cattle manures. Bioresour. Technol., 99, 8259-8264.
15. Li, Z., Lu, H., Ren, L., He, L. 2013. Experimental and modeling approaches for food waste composting: A review. Chemosphere, 93, 1247-1257.
16. Lin, Y.P., Huang, G.H., Lu, H.W., He, L. 2008. Modeling of substrate degradation and oxygen consumption in waste composting processes. Waste Manag., 28, 1375-1385.
17. Talib, A.T., Mokhtar, M.N., Baharuddin, A.S., Sulaiman, A. 2014. Effects of aeration rate on degradation process of oil palm empty fruit bunch with kinetic-dynamic modeling. Bioresour. Technol., 169, 428-438.
18. Tognetti, C., Mazzarino, M.J., Laos, F. 2008. Compost of municipal organic waste: Effects of different management practices on degradability and nutrient release capacity. Soil Biol. and Biochem., 40, 2290-2296.
19. Van Lier, J., Van Ginkel, J., Straatsma, G., Gerrits, J., Van Griensven, L. 1994. Composting of mushroom substrate in a fermentation tunnel: compost parameters and a mathematical model. NJAS Wageningen J. of Life Sci., 42, 271-292.
20. Vlyssides, A., Mai, S., Barampouti, E.M. 2009. An integrated mathematical model for co-composting of agricultural solid wastes with industrial wastewater. Bioresour. Technol., 100, 4797-4806.
21. Wang, K., Li, W., Li, Y., Gong, X., Wu, C., Ren, N. 2013. The modelling of
combined strategies to achieve thermophilic composting of sludge in cold region. Int. Biodeterior. & Biodegrad., 85, 608-616.
22. Wang, Y. 2014. Study on degrading kinetics of organic matter for composting process of swine manure, PhD dissertation, China Agricultural University.
23. Wang, Y., Ai, P., Cao, H., Liu, Z. 2015. Prediction of moisture variation during composting process: A comparison of mathematical models. Bioresour. Technol., 193, 200-205.
24. Wang, Y., Huang, G., Han, L. 2011. Effects analysis of free airspace to pig slurry wheat straw aerobic composting in laboratory reactor. Nongye Jixie Xuebao/Trans. of the Chin. Soc. of Agric. Mach., 42, 122-126.
25. Wang, Y.., Huang, G., Zhang, A., Han, L., Ge, J. 2014. Estimating thermal balance during composting of swine manure and wheat straw: A simulation method. Int. J. Heat and Mass. Transf., 75, 362-367.
26. Woodford, P.B. 2009. In-vessel composting model with multiple substrate and microorganism types, Kansas State University.
properties during the two-stage co-composting of green waste with spent mushroom compost and biochar. Bioresour. Technol., 171, 274-284.
Table 1
Model inputs
Symbol Description Value Unit Comment
s
G Specific gravity of substrate solids 1430 kg m-3 Calculated a
w
δ Specific gravity of water 1000 kg m-3
Haug (1993)
f r
Fractional gas content volume in between the apparent and inner sphere
0.55 m3 m-3 Guessing
si
Y Yield of soluble substrates from
insoluble substrates 1 kg kg
-1 Batstone et al.
a. With specific gravity of volatile solids measuring about 1000 kg m-3 and that of ash
measuring about 2500 kg m-3, Gs could be calculated (Haug, 1993).
b.
The biochemical coefficients for hydrolysis of insoluble carbohydrate, proteins and lipids were set to be 1, which could be applied to this study.
c.
Degradation rate at temperature 20 ºC was reported to be 0.005-0.015 d-1 (Haug, 1993), which could be converted to be 2.00-6.25 × 10⁻⁴ h-1.
d.
Hydrolysis was a form of degradation and it was also considered in the range of 2.00-6.25 × 10⁻⁴ h-1.
e.
Figure captions
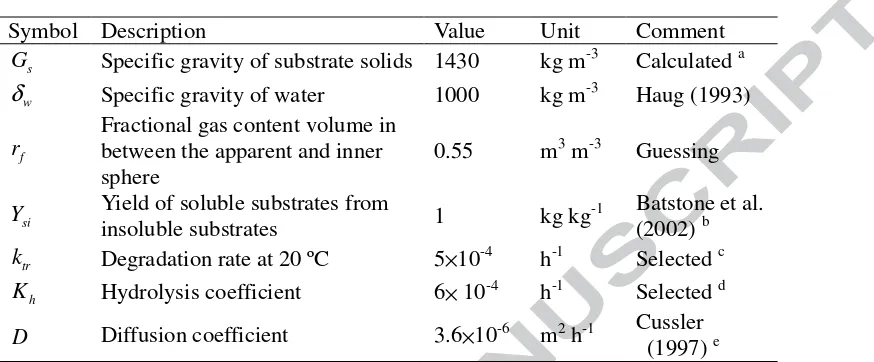
Figure 1. Theoretical representation of composting particles. Inner sphere is defined as
anaerobic zone while the space between inner sphere and apparent sphere is defined as
aerobic zone.
Figure 2. Diameter variations of inner sphere during composting process
Figure 3. The changes of vi and vb during composting process
Figure 4. Variations of soluble substrates in vb and insoluble substrates in vi
Figure 1
……n
(A)
(B)
(C)
(D)
(E)
d
d d1
Composting mixture
Interface Gas
Solids, water
Water
Highlights:
Geometry of compost particle was incorporated into degrading kinetics model;
The model took into account degradation of soluble and insoluble substrates;
Anaerobic hydrolysis occurred inside an introduced inner sphere;