Physico-chemical and mechanical properties of microencapsulated phase
change material
Jessica Giro-Paloma
a,⇑, Gerard Oncins
b,2, Camila Barreneche
a,c,1,3, Mònica Martínez
a,1,
A. Inés Fernández
a,1, Luisa F. Cabeza
c,3aUniversitat de Barcelona, Faculty of Chemistry, Department of Materials Science and Metallurgical Engineering, C/Martí i Franquès, 1, 08028 Barcelona, Spain bCentres Científics i Tecnològics de la Universitat de Barcelona (CCiTUB), C/Lluís Solé i Sabarís, 1, 08028 Barcelona, Spain
cGREA Innovació Concurrent, Edifici CREA, Universitat de Lleida, C/Pere de Cabrera s/n, 25001 Lleida, Spain
h i g h l i g h t s
"Microencapsulated phase change material MPCM (Micronal⁄DS 5001) was evaluated in this study. "Due to the reported microcapsules breakage, physical and mechanical properties were analysed. "Mechanical response was evaluated by AFM with indentation mode under different temperatures. "The main result is that stiffness of MPCM depends on the temperature assay and particle size.
a r t i c l e
i n f o
Article history: Received 31 July 2012
Received in revised form 30 October 2012 Accepted 3 November 2012
Available online 12 December 2012
Keywords:
Thermal energy storage
Microencapsulated phase change material Atomic force microscopy
Stiffness
a b s t r a c t
Microencapsulated phase change materials (MPCM) are well known in advanced technologies for the uti-lization in active and passive systems, which have the capacity to absorb and slowly release the latent heat involved in a phase change process. Microcapsules consist of little containers, which are made of polymer on the outside, and paraffin wax as PCM in the inside. The use of microencapsulated PCM has many advantages as microcapsules can handle phase change materials as core allowing the preparation of slurries. However there are some concerns about cycling of MPCM slurries because of the breakage of microcapsules during charging/discharging and the subsequent loss of effectiveness. This phenomenon motivates the study of the mechanical response when a force is applied to the microcapsule. The maxi-mum force that MicronalÒ
DS 5001 can afford before breaking was determined by Atomic Force Micros-copy (AFM). To simulate real conditions in service, assays were done at different temperatures: with the PCM in solid state at 25°C, and with the PCM melted at 45°C and 80°C. To better understand the behav-ior of these materials, MicronalÒ
DS 5001 microcapsules were characterized using different physic-chem-ical techniques. Microcapsules Fourier Transform Infrared Spectroscopy (FT-IR) results showed the main vibrations corresponding to acrylic groups of the outside polymer. Thermal stability was studied by Ther-mogravimetrical Analysis (TGA), and X-ray Fluorescence (XRF) was used to characterize the resulting inorganic residue. The thermal properties were determined using Differential Scanning Calorimetry (DSC) curves. Particles morphology was studied with Scanning Electron Microscopy (SEM) and Mie method was used to evaluate the particle size distribution. Samples had a bimodal distribution of size and were formed by two different particles sizes: agglomerates of 150lm diameter formed by small par-ticles of 6lm. Atomic Force Microscopy in nanoindentation mode was used to evaluate the elastic response of the particles at different temperatures. Different values of effective modulusEeffwere calcu-lated for agglomerates and small particles. It was observed that stiffness depended on the temperature assay and particle size, as agglomerates showed higher stiffness than small particles, which showed an important decrease in elastic properties at 80°C.
Crown CopyrightÓ2012 Published by Elsevier Ltd. All rights reserved.
0306-2619/$ - see front matter Crown CopyrightÓ2012 Published by Elsevier Ltd. All rights reserved.
http://dx.doi.org/10.1016/j.apenergy.2012.11.007
⇑ Corresponding author. Tel.: +34 934021298; fax: +34 934035438.
E-mail addresses:jessicagiro@ub.edu(J. Giro-Paloma), goncins@ub.edu(G. Oncins), c.barreneche@ub.edu(C. Barreneche), monicamartinez@ub.edu(M. Martínez),
ana_inesfernandez@ub.edu(A.I. Fernández),lcabeza@diei.udl.cat(L.F. Cabeza).
1 Tel.: +34 934021298; fax: +34 934035438. 2 Tel.: +34 934021352; fax: +34 934021398. 3 Tel.: +34 973003576; fax: +34 973003575.
Contents lists available atSciVerse ScienceDirect
Applied Energy
1. Introduction
The phase change materials (PCMs) for thermal energy storage (TES)[1]must have both high latent heat and thermal conductivity as the main properties[2,3]. It has been found that with the help of PCMs the indoor temperature fluctuations can be reduced signifi-cantly whilst maintaining desirable thermal comfort[4,5]. Materi-als studied for this application are hydrated salt[6], paraffin waxes [7–9], fatty acids[10–13], fatty alcohols[14]and eutectics of or-ganic and non-oror-ganic compounds [15,16]. Microencapsulated phase change materials[17](MPCM) are used in composite formu-lations for thermal energy storage in passive systems or in active systems as aqueous slurries.
Microencapsulation is a process whereby small, spherical or rod-shaped particles are enclosed in a thin, high molecular weight polymeric film. Microcapsules are little containers made by a hydrophobic core material (phase change material, PCM) and a polymeric hard shell[18]. The advantages of MPCM are the protec-tion against influences of the outside environment, the increase of the specific heat-transfer area, and improved tolerance to volume changes. Microencapsulation has been widely used to make copy-ing paper, functional textiles, preservation or targeted delivery of chemical, food, etc.
In this study MicronalÒ
DS 5001 from BASFÒ
with a melting temperature between 26 and 27°C was used. The application
tem-perature range of the selected product was tailored particularly to its employment in buildings (10–30°C). MicronalÒ
has been incor-porated in mortars, concrete or plasterboard as passive systems [19–21], and it is also used in active systems as slurries[22–29]. A better understanding of its performance and limitations in these systems needs more knowledge of the material properties, mainly thermal as well as chemical or mechanical properties. In its usage as slurries, the mechanical behavior of the microcapsules becomes a key issue during charging/discharging, as the mechanical integ-rity of the shell is essential for its performance during thermal cy-cling and pumping. When MicronalÒ
is used as aqueous slurry in active storage systems, changes are observed after several thermal cycles that are attributed to a partial degradation of the microcap-sules by breakage[30]. Therefore, this study has two main objec-tives: the first one is the characterization of chemical and physical properties of MicronalÒ
DS 5001 like surface area, particle size distribution, and chemical composition. The second objective is the characterization of the mechanical performance of microcap-sules at different temperatures using Atomic Force Microscope (AFM). This characterization should help us to better understand the behavior of MicronalÒ
in the above cited applications.
2. Materials and methods
The physico-chemical characterization of MicronalÒ
DS 5001 consisted in the determination of density, Specific BET surface area, and particle size distribution. Infrared spectroscopy (FT-IR) and X-Ray Fluorescence spectroscopy (XRF) were performed with Ther-mogravimetrical Analysis (TGA) to complete the chemical charac-terization. Thermal properties were evaluated with differential scanning calorimeter, and scanning electron microscopy was used to study the morphology of the sample.
2.1. Physicochemical characterization
2.1.1. Density and BET specific surface
Density was measured with a MicrometricsÒ
Pycnometer Accu-Pyc 1330 at 24°C and the specific surface BET was measured by MicrometricsÒ
(TriStar 3000).
2.1.2. Particle size distribution
The sample was analyzed using a Beckman CoulterÒ
LSTM 13 320 with Universal Liquid Module. The results were analyzed using the mathematical models Fraunhofer and Mie, as the use of one or the other depends on the particle size and the opacity of the mate-rial. The Fraunhofer model is used for opaque particles bigger than 30
l
m, whereas the Mie model fits better for homogenous and spherical particles, opaque or transparent and with diameters be-low 30l
m[31].2.1.3. Fourier transform infrared spectroscopy (FT-IR)
FT-IR spectroscopy is a powerful technique to identify func-tional groups in organic polymers or compounds. It was done through FT-IR Bomem ABB FTLA using a working range from 350 to 4000 cm1.
2.1.4. X-Ray Fluorescence (XRF)
X-ray fluorescence semi-quantitative analysis was performed on the calcined residue of MicronalÒ
sample. A spectrophotometer Panalytical Philips PW 2400 sequential X-ray equipped with the software UniQuantÒ
V5.0 was used.
2.1.5. Thermogravimetrical Analysis (TGA)
Thermal stability of the microcapsules was evaluated with a Simultaneous SDTQ600 TA Instruments under air atmosphere. The scanning rate was 0.5 K/min in the temperature range between 25 and 30°C followed by an isothermal step during 300 min. Then, temperature was increased at 1 K/min from 30 to 100°C, followed
by an isothermal step during 300 min. The last heating ramp was at 5 K/min from 100 to 600°C.
2.2. Thermal properties with Differential Scanning Calorimetry (DSC)
The most common methods used in DSC analysis of PCM are dy-namic method and step method. The dydy-namic method consists on heating or cooling the sample at a constant rate while the heat flux of the sample is measured[32,33]. Generally, when the dynamic method is applied, the phase transition is not an isothermal pro-cess because the thermal equilibrium is not achieved. A possible option to solve this problem is collecting the data using the step method, where the heating rate is changed by temperature inter-vals (steps).
The thermal properties such as melting/solidification tempera-ture and melting/solidification enthalpy of the microcapsules con-taining PCM were evaluated by the Research Group Grea at the University of Lleida, using both methods by DSC with aDSC 822-efrom Mettler Toledo. An aluminum crucible of 40
l
l under N2 atmosphere flow of 80 mL/min was used. The heating rate used was 0.5°C/min in both methodologies. This technique shows themelting temperature (Tm) and solidification temperature (Ts) of the sample and the enthalpy value for each process (melting and solidification,HmandHsrespectively) which is equivalent to the area under the curve.
2.3. Scanning Electron Microscopy (SEM)
2.4. Stiffness characterization by atomic force microscopy
To determine the mechanical properties of the sample of Micro-nalÒ
DS 5001, AFM was performed at Scientific and Technological Centers of the Universitat de Barcelona (CCiTUB). AFM probes ra-dius (R) was measured using the SPIP reconstruction software.R
value was measured before and after every mechanical test in or-der to ensure that the tip shape did not change due to plastic defor-mation, which would invalidate stiffness value measurements through effective Young Modulus (Eeff).
AFM topographic images were acquired in intermittent contact mode using a MFP-3D system (Asylum Research). For this sort of measurements, MicronalÒ
particles were glued on a metallic disk with epoxy. Care was taken to avoid an excess of glue around the particles that may result in a noticeable change in their mechanical properties. By means of the optical system attached to the AFM, only clean and spherical particles were chosen to be studied.
Topographic measurements as well as mechanical tests on Mic-ronalÒ
DS 5001 particles were performed with a diamond tip mounted on a stainless steel cantilever with a nominalkvalue of 265 nN/nm (Veeco). Nevertheless,kvalues of probes were individ-ually measured by means of the thermal noise routine imple-mented in the software[34].
Mechanical measurements were performed with the Force Spectroscopy mode, using the AFM probe as a nanoindenter. As the goal of this experimental study is to assess theEeffvalue,
verti-cal forces applied by the AFM probe (F) were tuned so as to always remain in the elastic deformation region.
Two different sample sets were tested; one of them consisted on MicronalÒ
particle aggregates exceeding 100
l
m in diameter (agglomerates) and the other consisted on particles with diameters below 10l
m (small particles). The necessaryFvalue to break the agglomerates and the small spheres was studied, so plastic defor-mation was topographically detected to take place at F values around 5l
N for the agglomerates and at 3l
N for the small parti-cles; therefore measurements presented in this work were ac-quired atFvalues of 3l
N and 1.5l
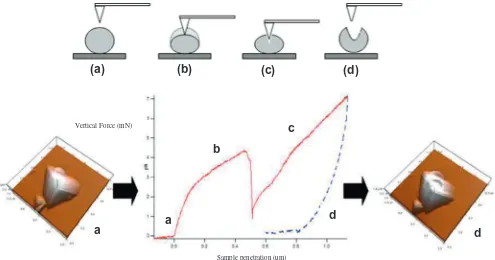
N for the two different sets ofparticles, respectively. The elastic–plastic transition tested by AFM is depicted inFig. 1in a small particle without applying load (no contact), and after applying load (deformation of the sample). Fig. 1shows the vertical forcevs. sample penetration curve ob-tained by processing the measurement of the cantilever deflection as it moves to the sample when aFvalue of 7
l
N was applied (con-tinuous line corresponds to tip sample approach process and dot-ted line corresponds to the tip retraction from the sample). It was the maximumFexerted, so plastic deformation was induced on the particle. The first region (flat,Fig. 1a) corresponds to the lack of contact between tip and sample. When contact is reached, the cantilever applies an increasing F on the sample, deforming it elastically.The deformation process is depicted fromFig. 1a–c. So,Fig. 1a shows no contact between tip and the small particles. Then at a certain sample penetration value, Fsuddenly decreases as it can be seen inFig. 1b, confirming the plastic penetration of the sample. AsFand sample penetration continue increasing (Fig. 1c), the sam-ple is further deformed. The retraction of the AFM probe is de-picted by the dotted line. In this specific experiment, theFvalue needed to plastically deform the sample is approximately 4
l
N.Individual indentation experiments were performed in different spots of the upper flat-top part of MicronalÒ
particles in order to avoid tip slippage due to sample curvature.F is calculated as in Eq.(1), wherekis the AFM probe, andDzis cantilever deflection
in thezaxis:
F¼k
D
z ð1ÞThe cantilever deflection is expressed in Eq.(2), whereDVis the increment in photodetector vertical signal as the tip contacts the sample andSis the sensitivity, which is the slope of the contact re-gion of a force curve performed on a rigid sample:
D
z¼D
V=S ð2ÞThe sample penetration (d) due to the exertedFvalue is evalu-ated as Eq.(3), wherezrepresents the piezo-scanner displacement in the axis perpendicular to the sample plane:
Sample penetration (µm) Vertical Force (mN)
(a)
(b)
(c)
(d)
a
b
c
d
d
a
Fig. 1.Mechanical testing of the elastic-plastic region by AFM of a small particle, (a) no contact; (b) plastic penetration; (c) deformation of the sample; and (d) the retraction of the AFM probe.
d¼z
D
z ð3ÞFvs.zcurves obtained at a certainFvalue were analyzed using the Hertz model in the elastic region by means of Eq.(4), and effec-tive Modulus (Eeff) value can be obtained using Eq.(5):
F¼ ð3=4EeffR1=2Þ d3=2 ð4Þ
1=Eeff ¼ ½ð1
m
2Þ=E þ ½ð1m
2iÞ=Ei ð5Þwhere
m
is the Poisson ratio with a value of 0.33. Subindex icorresponds to the mechanical properties of the SiO2 AFMprobe (Ei= 76 GPa[35]) and
m
i= 0.17[36].It is important to notice that a triangular dent in the top of the particle can be seen when it is plastically deformed by the AFM probe. The general shape of the particles also appears to be trian-gular; this corresponds to the shape of the AFM tip, which is pyra-midal, and not to the real shape of the particle. Individual indentation experiments were performed in different spots of the upper flat-top part of MicronalÒ
particles in order to avoid tip slip-page due to sample curvature.
3. Results and discussion
3.1. Physicochemical characterization
3.1.1. Density and specific BET surface
The result of average density is 0.995 ± 0.003 g/cm3. This value reflects the average density of two different materials: the density of the polymeric shell (1.0–1.2 g/cm3) and the density of the paraf-fin wax core (0.76–0.88 g/cm3).
The result of the BET surface area was 2.61 ± 0.04 m2/g; this va-lue is adequate to be used as filler in the polymer matrix, as vava-lues below 5 m2/g are recommended to guarantee the effectiveness of a mixing process[37].
3.1.2. Particle size distribution
The calculations covered a range from 0.04 to 2000
l
m. Before the assay, the sample was treated in an ultrasonic bath during 60 s in water with sodium pyrophosphate as dispersing agent, to promote deagglomeration of particles. Results calculated applying Fraunhofer model are shown inFig. 2.Fig. 2shows a wide distribution with a mean value around 9
l
m and agglomerates of 30l
m and 100l
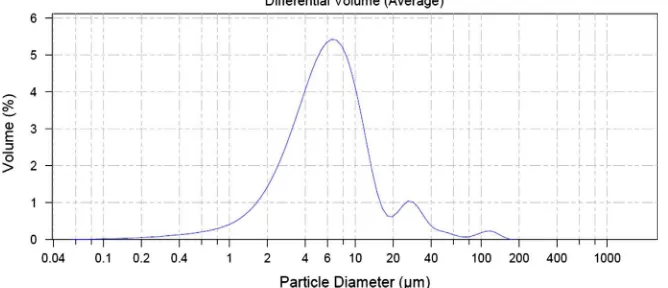
m. For this reason, the dis-persing agent and the experimental conditions were changed. The sample was mixed with water and a non-ionic surfactant, 0.01% of Tween 80 (Polysorbate 80), as a dispersing agent. In this case, the particle size distribution was calculated using the Mie method. Then, it was treated in an ultrasound bath during 30 s tofavor deagglomeration. Particle size distribution calculated by the Mie method can be observed inFig. 3.
Next experiment, tried to simulate real working conditions in a slurry, microcapsules were dispersed in water and how the particle size distribution changes with time and continuous stirring was evaluated. It is important to notice that stirring takes place during the measurement and for this reason, the sample will disaggregate as time goes by. Three replicates of the same slurry were measured being the time between replicates 30 s. AsFig. 4shows, the average particle size moved through smaller sizes from 114
l
m for the first replicate to 70l
m for the third one. These results demonstrate that aggregates break and the amount of smaller particles increase while bigger ones decrease.3.1.3. Fourier Transform Infrared spectroscopy (FT-IR)
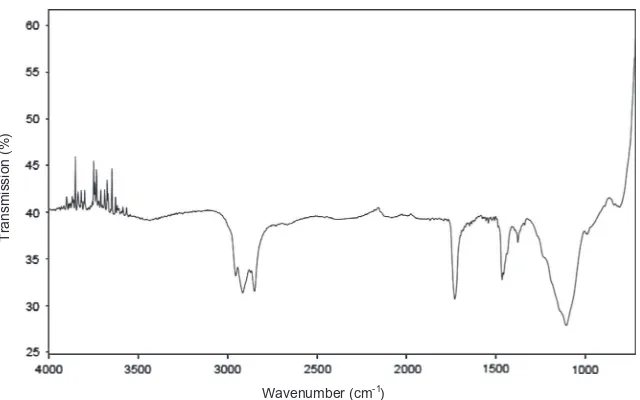
Fig. 5 shows the analysis by FT-IR spectrum. Peaks from 2954 cm1to 2850 cm1correspond to the aliphatic C–H stretch-ing vibration. Vibration at 1728 cm1is attributed to the carbonyl group of acrylate, while the absorption peak at 1463 cm1
is asso-ciated with the C–H bending vibration, and the absorption peak at 1111 cm1can be assigned to the C–O stretching of the ester group of acrylate.
3.1.4. X-Ray Fluorescence (XRF)
A MicronalÒ
sample was calcined at 500°C during 8 h and the
composition of the residue was characterized by X-ray fluores-cence. Results shown inTable 1are stated as oxides, and reveal that the major component of this solid is silicon, probably as silicon oxide (93%), and some minor and trace elements as Na2O, SO2, and K2O and CaO.
Silicon may be included in the polymer formulation as SiO2as the use of inorganic fillers in polymer formulations is widely de-scribed to improve their rigidity; otherwise silicon based com-pounds like silanes are also added in some polymer formulations, and may lead after a calcining step to SiO2. With the analytical techniques used it was not possible to identify the silicon com-pound that origin a SiO2residue.
3.1.5. Thermogravimetrical Analysis (TGA)
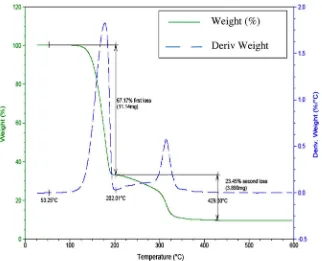
As observed in the TGA of MicronalÒ
microcapsules depicted in Fig. 6, thermal degradation takes place in two stages. The first one corresponds to the decomposition of thePCM paraffin wax be-tween 53 and 202°C and the associated loss is 67.17% of the
sam-ple. The second mass loss is attributed to the acrylate, and comprises the 23.45% of the MicronalÒ
mass with an onset temper-ature around 280°C. The total loss of ignition at 600°C is 90.62%
corresponding to the organic components paraffin and acrylate polymer.
Fig. 2.Particle size distribution of MicronalÒ
Therefore, the chemical composition of the analyzed MicronalÒ
sample is approximately 67.% paraffin wax PCM, 23% acrylate poly-mer and 9% of inorganic filler formed mainly by a Si based compound.
3.2. Thermal properties with Differential Scanning Calorimetry (DSC)
Fig. 7a shows the results obtained applying the dynamic meth-od in DSC, where the melting enthalpy is 114.98 kJ/kg, the melting temperature is 27.81°C, the solidification enthalpy is 117.85 kJ/kg and the solidification temperature is 26.98°C. The results applying the step method are shown inFig. 7b. The melting enthalpy ob-tained is 142.55 kJ/kg, the melting temperature is 27.87°C, the solidification enthalpy is 137.85 kJ/kg and the solidification tem-perature is 26.09°C.
Fig. 4.Comparison of particle size distribution between three replicates with the Mie model.
Transmission (%)
Wavenumber (cm-1)
Fig. 5.Fourier transform FT-IR spectra of MicronalÒ DS 5001.
Table 1
XRF analysis of calcined MicronalÒ
DS 5001, results stated as oxides.
SiO2 Na2O SO3 K2O MgO CaO
wt.% 93.0 1.6 0.8 0.3 0.1 0.1
Fig. 3.Particle size distribution of MicronalÒ
Fig. 8.Micrographies by secondary electron (SE) of the sample of MicronalÒ
DS 5001 (a), (b) sample of 150lm and (c) detail of a sphere of 6lm. Fig. 6.Thermogravimetrical analysis of MicronalÒ
DS 5001.
Integral 3115,47 mJ normalized 137,85 Jg-1
Onset 26,95 °C Peak 26,09 °C Integral -3221,56 mJ
normalized -142,55 Jg-1
Onset 27,05 °C Peak 27,87 °C !Micronal 1 Micronal 1, 22,6000 mg Wg-1
-0,30 -0,25 -0,20 -0,15 -0,10 -0,05 0,00 0,05 0,10 0,15 0,20
min 0 50 100 150 200 250 300 350 400 450 500 550 600 650 700 750 800
o x e ^exo ^
SW 8. 01 e e RR A TA T S S UdL: Gre a
Integral 241,59 mJ normalized 117,85 Jg-1
Onset 27,46 °C Peak 26,98 °C Integral -235,72 mJ
normalized -114,98 Jg-1
Onset 26,62 °C Peak 27,81 °C !Micr_2
Micr_2, 2,0500 mg Wg-1
-0,8 -0,6 -0,4 -0,2 0,0 0,2 0,4 0,6
min °C
1010 15 20 25 30 353535 30 25 20 15 10
0 10 20 30 40 50 60 70 80 90 100
o x e ^exo ^
SW 8. 01 ee R R A TA T SS UdL: Gre a
Fig. 7.DSC curves (heat flow vs. time and temperature of the sample) of MicronalÒ
Temperatures of melting and solidification processes are similar comparing the results obtained with both methodologies. Applying both modes, the thermal equilibrium is achieved.
3.3. Scanning Electron Microscopy (SEM)
Fig. 8shows the morphology and the size of the MicronalÒ
par-ticles. The MicronalÒ
sample consists on microspheres of approxi-mately 150
l
m in diameter (Fig. 8a and b), which in turn are made of multiple spheres with diameters approximately 6l
m each (Fig. 8c).3.4. Stiffness characterization by Atomic Force Microscope (AFM)
Intermittent contact mode topographic images were acquired on the top of the selected particles of 6
l
m of MicronalÒat 25°C,
45°C and 80°C in order to determine the changes of the sample morphology. It is noticed that particles topography does not change significantly along the phase transition of the core material, indicating that the particles do not break as temperature increases until reaching 45°C without any leakage, which would change sur-face topography.
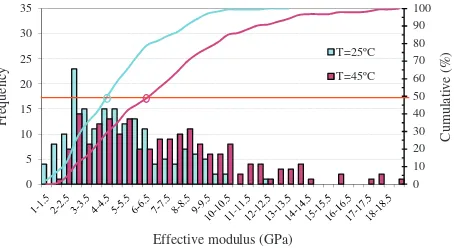
To determine mechanical properties, 200 nanoindentation experiments were performed by AFM on different spots of the aggregate particles for each tested temperature. It is important to note that every nanoindentation by AFM was performed in a differ-ent spot on the top part of the particle in order to ensure that pre-vious mechanical tests did not change the local mechanical response of the sample. Results are shown inFig. 9where the fre-quency of each result of calculatedEeffvalues is represented.
Results dispersion is due to the extremely local nature of AFM nanoindentation experiments, which are affected by local sample topography, surface defects and tilting and spurious contamina-tion, and this is reflected in elevate standard deviation (s.d.). The
Eeffmean value at room temperature is 4.9 GPa (s.d. 2.4 GPa) and
Eeffmean value at 45°C is 7.2 GPa (s.d. 4.2 GPa). Nevertheless, there
is a remarkable increase ofEeffat 45°C, that is, when the particles
core is in liquid phase.
Fig. 10shows the results obtained on single particles of Micro-nalÒ
DS 5001. At room temperature the mean value of Eeff is
24.5 MPa (s.d. 9.1 MPa) and at 45°C, the mean value is 24.9 MPa (s.d. 11.6 MPa). In this case, the results show no significant differ-ences in the elastic response at 25°C and 45°C. As temperature
in-creases up to 80°C,Eeffmean value decreases drastically to 7.4 MPa
(s.d. 5.6 MPa). ThisEeffreduction is attributed to the temperature
that is close to the glass transition temperature of acrylate shell (around 100°C).
4. Conclusions
Microencapsulated MicronalÒ
DS 5001 consists on paraffinic PCM core and an acrylate outer shell. The solid is made of spherical agglomerates of 150
l
m, which are composed of microspheres of 6l
m in size (small particles). The chemical composition of the sample is approximately 67% paraffin wax PCM, 23.5% acrylate polymer, and 9% of a Si based compound. The material shows a phase change temperature range between 26.09°C and 27.81°C. The latent heat shows a melting enthalpy between 114.98 kJ/kg and 142.55 kJ/kg and a solidification enthalpy between 117.85 and 137.85 kJ/kg.Different values were obtained forEeffdepending on the size of
the particle and the temperature. For agglomerates the average va-lue forEeffat 25°C was 4.9 GPa, and at 45°C was 7.2 GPa. Besides,
for the small particles the average value for Eeff at 25°C was
24.5 MPa, at 45°C was 24.9 MPa, and at 80°C was 7.4 MPa. In case
of small particles, there are no differences in the elastic response at 25 and 45°C, but increases significantly at 80°C because of this temperature is close to the polymer shell glass transition temperature.
Acknowledgements
The work is partially funded by the Spanish government (ENE2011-28269-C03-02 and ENE2011-22722) and the European Union (COST Action TU0802). The authors would like to thank the Catalan Government for the quality accreditation given to their research group GREA (2009 SGR 534) and research group DIOPMA (2009 SGR 645).
References
[1] Joulin A, Younsi Z, Zalewski L, Lassue Z, Rousse DR, Cavrot JP. Experimental and numerical investigation of a phase change material: thermal-energy storage and release. Appl Energy 2011;88(7):2454–62.
[2] Castellón C, Martorell I, Cabeza LF, Fernández AI, Manich AM. Compatibility of plastic with phase change materials (PCM). Int J Energy Res 2010;35:765–71. [3] Bayés-García L, Ventolà L, Cordobilla R. Phase change materials (PCM) microcapsules with different shell compositions: preparation, characterization and thermal stability. Sol Energy Mater Sol Cells 2010;94:12535–40.
[4] Zhou D, Zhao CY, Tian Y. Review on thermal energy storage with phase change materials (PCMs) in building applications. Appl Energy 2012;92:593–605. [5] Zhou G, Yang Y, Xu H. Performance of shape-stabilized phase change material
wallboard with periodical outside heat flux waves. Appl Energy 2011;88(6):2113–21.
[6] Oró E, de Gracia A, Castell A, Farid MM, Cabeza LF. Review on phase change materials (PCMs) for cold thermal energy storage applications. Appl Energy 2012;99:513–33.
[7] Cai Y, Wei Q, Huang F, Gao W. Preparation and properties studies of halogen-free flame retardant form-stable phase change materials based on paraffin/ high density polyethylene composites. Appl Energy 2008;85(8):765–75. [8] Kravvaritis ED, Antonopoulos KA, Tzivanidis C. Experimental determination of
the effective thermal capacity function and other thermal properties for various phase change materials using the thermal delay method. Appl Energy 2011;88(12):4459–69.
[9] Rao Z, Wang S, Peng F. Self diffusion of the nano-encapsulated phase change materials: a molecular dynamics study. Appl Energy 2012.
0
Fig. 9.Eeffvalue of agglomerate particles calculated from AFM nanoindentation
experiments at 25°C and 45°C.
Fig. 10.Eeffvalue of small particles calculated from AFM nanoindentation
exper-iments on MicronalÒ
DS 5001 at 25°C, 45°C and 80°C.
[10] Li M, Wu Z, Kao H. Study on preparation, structure and thermal energy storage property of capric-palmitic acid/attapulgite composite phase change materials. Appl Energy 2011;88(9):3125–32.
[11] Wang L, Meng D. Fatty acid eutectic/polymethyl methacrylate composite as form-stable phase change material for thermal energy storage. Appl Energy 2010;87(8):2660–5.
[12] Li M, Kao H, Wu Z, Tan J. Study on preparation and thermal property of binary fatty acid and the binary fatty acids/diatomite composite phase change materials. Appl Energy 2011;88(5):1606–12.
[13] Cai Y, Ke H, Dong J, Wei Q, Lin J, Zhao Y, et al. Effects of nano-SiO2 on morphology, thermal energy storage, thermal stability, and combus-tion properties of electrospun lauric acid/PET ultrafine composite fibers as form-stable phase change materials. Appl Energy 2011;88(6): 2106–12.
[14] Chen ZH, Yu F, Zeng XR, Zhang ZG. Preparation, characterization and thermal properties of nanocapsules containing phase change materialn-dodecanol by miniemulsion polymerization with polymerizable emulsifier. Appl Energy 2012;91(1):7–12.
[15] Tyagi VV, Kaushik SC, Tyagi SK, Akiyama T. Development of phase change materials based microencapsulated technology for buildings: a review. Renew Sust Energy Rev 2011;15:1373–91.
[16] Farid MM, Khudhair AM, Razack SAK, Al-Hallaj S. A review on phase change energy storage: materials and applications. Energy Convers Manage 2004;45:1597–615.
[17] Chen B, Wang X, Zeng R, Zhang Y, Wang X, Niu J, et al. An experimental study of convective heat transfer with microencapsulated phase change material suspension: laminar flow in a circular tube under constant heat flux. Exp Therm Fluid Sci 2008;32:1638–46.
[18] Sari A, Alkan C, Karaipekli A, Uzun O. Microencapsulatedn-octacosane as a phase change material for thermal energy storage. Sol Energy 2009;83:1757–63.
[19] Khudhair AM, Farid MM. A review on energy conservation in building applications thermal storage by latent heat using phase change materials. Energy Convers Manage 2004;45:263–75.
[20] Cabeza LF, Castel A, Barreneche C, de Gracia A, Fernández AI. Materials used as PCM in thermal energy storage in buildings: a review. Renew Sust Energy Rev 2011;15:1675–95.
[21] Su JF, Wang LX, Ren Li. Preparation and characterization of double-MF shell microPCMs used in building materials. J Appl Polym Sci 2005;97(5): 1755–62.
[22] Heinz A, Streicher W. Application of phase change materials and PCM-slurries for thermal energy storage. In: 10th International conference on thermal energy storage, Stockton; 2006.
[23] Zhang GH, Zhao CY. Thermal and rheological properties of microencapsulated phase change materials. Renew Energy 2011;36:2959–66.
[24] Yang R, Xu H, Zhang Y. Preparation, physical property and thermal physical property of phase change microcapsule slurry and phase change emulsion. Sol Energy Mater Sol Cells 2003;80:405–16.
[25] Hu X, Zhang Y. Novel insight and numerical analysis of convective heat transfer enhacement with microencapsulated phase change material slurries: laminar flow in a circular tube with constant heat flux. Int J Heat Mass Trans 2002;45:3163–72.
[26] Delgado M, Lázaro A, Mazo J, Marín JM, Zalba B. Experimental analysis of a microencapsulated PCM slurry as thermal system and as heat transfer fluid in laminar flow. Appl Therm Eng 2012;36(1):370–7.
[27] Lu W, Tassou SA. Experimental study of the thermal characteristics of phase change slurries for active cooling. Appl Energy 2012;91(1):366–74. [28] Delgado M, Lázaro A, Mazo J, Zalba B. Review on phase change material
emulsions and microencapsulated phase change material slurries: materials heat transfer studies and applications. Renew Sust Energy Rev 2012;16(1):253–73.
[29] Zhang Y, Wang S, Rao Z, Xie J. Experiment on storage characteristic of microencapsulated phase change material slurry. Sol Energy Mater Sol C 2011;95(10):2726–33.
[30] Diaconu BM, Varga S, Oliveira AC. Experimental assessment of heat storage properties and heat transfer characteristics of a phase change material slurry for air conditioning applications. Appl Energy 2010;87(2):620–8.
[31] de Boer GBJ, de Weerd C, Thoenes D, Goossens HWJ. Laser diffraction spectrometry: Fraunhofer diffraction versus Mie scattering. Part Syst Charact 1987;4:14–9.http://dx.doi.org/10.1002/ppsc.19870040104.
[32] Marin JM, Zalba B, Cabeza LF, Mehling H. Determination of enthalpy-temperature curves of PCM with thet-history method – improvement to temperature dependent properties. Meas Sci Technol 2003;14:184–9. [33] Mehling H, Cabeza LF. Heat and cold storage with PCM. Springer-Verlag; 2008.
ISBN-13: 9783540685562.
[34] Florin EL, Rief M, Lehmann H, Ludwig M, Dornmair C, Moy VT, et al. Sensing specific molecular-interactions with the atomic-force microscope. Biosens Bioelectron 1995;10:895–901.
[35] Namazu T, Isono Y. Quasi-satic bending test of nano-scale SiO2 wire at
intermediate temperatures using AFM-based technique. Sensor Actuator A 2003;194:78–85.
[36] Oliver WC, Pharr GM. An improved technique for determining hardness and elastic modulus using load and displacement sensing indentation experiments. J Mater Res 1992;7(6):1564–83.