UTILIZATION OF cpDNA SEQUENCES TO IDENTIFY 15 MANGO ACCESSIONS
Sukartini 1*), Taryono 2), Panjisakti Basunanda 2) and Rudi Hari Murti 2) 1) Indonesian Tropical Fruits Research Institute
Jl. Raya Solok – Aripan Km. 8 Solok, West Sumatra, Indonesia, 27301 2) Faculty of Agriculture University of Gadjah Mada
Jl. Flora Bulaksumur, Yogyakarta, Indonesia, 55281 *) Corresponding author E-mail: [email protected]
Received: December 30, 2015/ Accepted: April 22, 2016
ABSTRACT
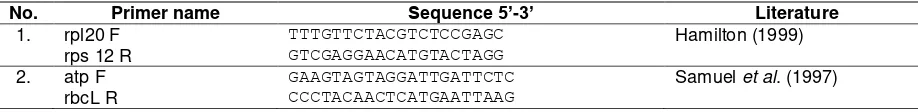
Information about genetic relationship and genetic diversity are an inevitable need in mango breeding program. Base substitution value, genetic distance and grouping of 15 mango accessions based on accessions in chloroplast DNA (cpDNA) among 15 mango accessions were assessed. The samples were originated from Mango Germ-plasm, Cukur Gondang Research Station of Indo-nesian Tropical Fruits Research Institute, Pasu-ruan, East Java. Sequencing of Chloroplast DNA was used to obtain nucleotide sequence data. Paired specific primer rpl20 F - rps12 R and atp F - rbcL R were used for amplification of non-coding area of mango DNA chloroplast and sequencing
Mango is a popular and prominent fruit in Asia and South America countries. India, China, Thailand, Pakistan, Mexico, and Indonesia are the major producers of mango, mangosteen and guava (FAOSTAT, 2012). As the fourth mango producer in the world, Indonesia has not involved yet to the major mango exporters (Saave, 2011) because of the low quality of the fruit to meet the international market requirements (Mukherjee and Litz, 2009). However, the quality of Indonesian mango could still be improved through breeding programs. Recently, breeding program of mango is focused on the production of better quality of
mango accessions, which have improved in per-formance and resistance to both biotic and abiotic stresses (Lavi et al., 2004).
High diversity of mango and the relatively uncomplicated vegetative multiplication of the plant make the extensive cultivation and the generation of new superior mango accessions are possible (Lavi et al., 2004). The attempt to create new mango accessions is needed to add genetic diversity and to fulfill the market preference. One of the characteristics to meet the international preferences is mango cultivars with red blush (Sauco, 2004).
The selection of parental crossing in mango breeding program is still based on phenotype characteristics (Lavi et al., 1998). Naturally, mango is a heterozigous tree. Hence, phenotype based crossing will lead to the unpredictable hybrids (Usman et al., 2001). Lavi et al., (2006) stated that molecular markers can be used to identify and distinguish different type of cultivars with more precision result. The differences among individual plant could be determined by the genetic code (base sequences) contained in DNA (Semagn et al., 2006). The development of the genetic markers has further reduced the uncertainty in breeding mango and maintaining the hybrid populations in a better way. Molecular markers reflect inheritance Mendel, which make them possible to trace the fingerprints of each individual including history of its evolution (Usman et al., 2001). Those efforts were done through phylogenetic tree and study of genetic relationship (Hoshino et al., 2012). Inter-genic spacer region rpl20-rps12 and atp-rbcL of chloroplast DNA of 19 mango accessions were used to differentiate intra- and inter-cultivars (Khan and Azim, 2011).The research aimed to know base substitution value, genetic distance and grouping accessions (genetic relationships) of 15 mango accessions using intergenic spacer
Cite this as: Sukartini, Taryono, P. Basunanda and R.H. Murti. 2016. Utilization of cpDNA sequences to identify 15 mango accessions. AGRIVITA Journal of Agricultural Science. 38(2): 155-162. Doi: 10.17503/agrivita.v38i2.767 Accredited : SK No. 81/DIKTI/Kep/2011
tory of genetic and breeding, Gadjah Mada Uni-versity, Yogyakarta. The research was started from May to November 2013. Leaf samples of 15 mango accessions, such as: Apel Merah, Arumanis 143, Khirsapati Maldah, Irwin, Haden, Gedong Gincu, Saigon, Delima, Liar, Keitt, Agung, Madu Segoro, Mangifera gedebi, Bangalora, and Paw-paw were taken from mango germplasm, Cukur Gondang emerging were collected for DNA extraction. Leaf samples of each mango accession of about 0.1 g were pulverized in a mortar with 800µl buffer extraction (2% CTAB; 1.4 M NaCl; 20 mM EDTA pH 8; 100 mM Tris–HCl pH 8; 1% PVP-40; 1% Mercaptoethanol). The sample was then trans-ferred into 1.5 ml micro tube, and mixed well using vortex machine. Sample was incubated into water bath at 65°C for 60 minutes and transferred to the room temperature (25°C) for 2 minutes. A mixture of 500 µl of chloroform and isoamil alcohol (CIAA) with a ratio of 24:1 was then added to each sample.The solution was mixed through inverted-reverse and followed by a vortex for 5 minutes and centrifuged at 12,000 rpm for 15 minutes.
The new solution (supernatant) was trans-ferred into new micro tube and added with sodium acetate 3 M as much as 1/10 the volume of supernatant. The solution was inverted reverse for 5 minutes and then added with cold isopropanol as much as 2/3 from total volume (supernatant + sodium acetate) and incubated in a freezer for 24 hours. The sample was centrifuged at 12,000 rpm
PCR amplification of non-coding area of mango DNA chloroplast (Table 1).
PCR reactions were done in 10 µl of 5 µl Go Taq© Green Master Mix, 2.25 µl nuclease F-W, 0.25 µl primer (0.125 µl each for F and R) and 2.5 µl DNA. Touchdown method was used with 35 cycles with an initial denaturation cycle of 3 minutes at 94ºC, followed by denaturation for 40 seconds at 94ºC, and 40 seconds annealing at 50ºC. Temperature was decreased 2ºC every 5 cycles until the end of the process. The end of the process must reach 38ºC, one minutes of extension at 72 ºC, with a final extension of 10 minutes at 72 ºC.
The result of DNA amplification was ob-served by electrophoresis at 1.5% gel metaphor agarose, with 10 µl DNA resulted from amplifi-cation of 3 µl KAPA dye, 5 µl marker at 80 volt, 400 Am for 70 minutes. The result of electrophoresis was observed under ultraviolet light. Sanger method was used for sequencing of amplification result that was observed by the same primer.
RESULT AND DISCUSSION
Amplification Result
DNA chloroplast intergenic area of the 15 mango accessions could be recognized by both paired primers. It is characterized by the appear-ance of all of the same band at the same position or at 2000 bp (Figure 1 and 2).
Base on Figure 1 and 2, the primers were fitted for 15 accessions. Non-coding area such as intergenic and intron are areas, in which mutation possibly happened. Mutation is source of diversity (intra and intra-specific) from base sequences in DNA or genotype (Intrieri et al., 2007).
Table 1. Primers were used for amplification
Remarks: 1. Arumanis 143, 2. Saigon, 3. Mangifera gedebe, 4. Irwin, 5. Haden, 6. Li’ar, 7. Khirsapati Maldah, 8. Paw-paw, 9. Bangalora, 10. Madu Segoro, 11. Gedong Gincu, 12. Keitt, 13. Agung, 14. Delima, 15. Apel Merah
Figure 1. The result of amplification with utilization of primer rpl20 F - rps 12 R
Remarks: 1. Arumanis 143, 2. Saigon, 3. Mangifera gedebe, 4. Irwin, 5. Haden, 6. Li’ar, 7. Khirsapati Maldah, 8. Paw -paw, 9. Bangalora, 10. Madu Segoro, 11. Gedong Gincu, 12. Keitt, 13. Agung, 14. Delima, 15. Apel Merah
Figure 2. The result of amplification with utilization of primer atp F - rbcL R
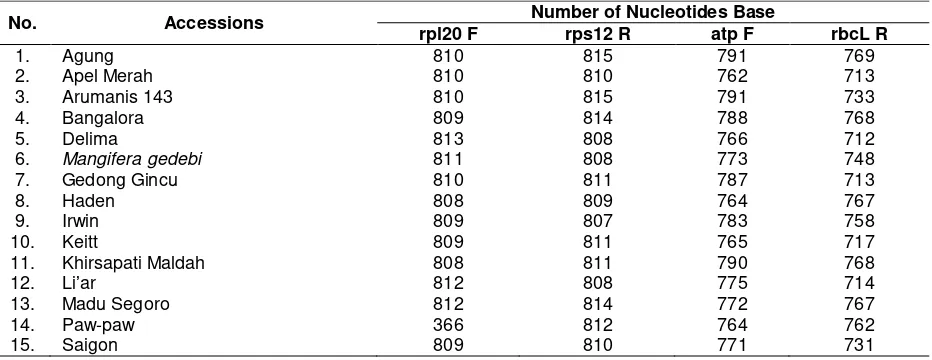
Table 2. Number of nucleotides of 15 mango accessions
No. Accessions Number of Nucleotides Base
rpl20 F rps12 R atp F rbcL R
1. Agung 810 815 791 769
2. Apel Merah 810 810 762 713
3. Arumanis 143 810 815 791 733
4. Bangalora 809 814 788 768
5. Delima 813 808 766 712
6. Mangifera gedebi 811 808 773 748
7. Gedong Gincu 810 811 787 713
8. Haden 808 809 764 767
9. Irwin 809 807 783 758
10. Keitt 809 811 765 717
11. Khirsapati Maldah 808 811 790 768
12. Li’ar 812 808 775 714
13. Madu Segoro 812 814 772 767
14. Paw-paw 366 812 764 762
15. Saigon 809 810 771 731
Sequencing
The sequencing was done by using the same primers and resulted diverse number of nucleotide bases (Table 2). Total number of base resulted from DNA sorting was more than 1000 bases. The number was considered sufficient to create a true phylogeny as suggested by Tateno et al. (1994). Number of nucleotides was between 700 and 800. The least number of nucleotides
was observed in Paw paw that had only 366 bases.
Homogeneity Test
rbcL R were the only data used for further analysis. base composition in codon (Table 4).
Table 3. Disparity Index Test data as result of DNA sorting
[1] [2] [3] [4] [5] [6] [7] [8] [9] [10] [11] [12] [13] [14] [15] [ 1] 0.00 0.00 0.00 0.00 0.00 0.00 2.51 0.00 0.00 0.00 0.00 0.00 0.00 0.00 [ 2] 1.00 0.00 0.00 0.00 0.00 0.00 2.53 0.00 0.00 0.00 0.00 0.00 0.00 0.00 [ 3] 1.00 1.00 0.00 0.00 0.00 0.00 2.87 0.00 0.00 0.00 0.00 0.00 0.00 0.00 [ 4] 1.00 1.00 1.00 0.00 0.00 0.00 2.14 0.00 0.00 0.00 0.00 0.00 0.00 0.00 [ 5] 1.00 1.00 1.00 1.00 0.00 0.00 1.62 0.00 0.00 0.00 0.00 0.00 0.00 0.00 [ 6] 1.00 1.00 1.00 1.00 1.00 0.00 2.11 0.00 0.00 0.00 0.00 0.00 0.00 0.00 [ 7] 1.00 1.00 1.00 1.00 1.00 1.00 1.89 0.00 0.00 0.00 0.00 0.00 0.00 0.00 [ 8] 0.01 0.01 0.00 0.01 0.02 0.00 0.01 1.90 2.40 1.97 1.83 2.18 3.20 1.61 [ 9] 1.00 1.00 1.00 1.00 1.00 1.00 1.00 0.01 0.00 0.00 0.00 0.00 0.00 0.00 [10] 1.00 1.00 1.00 1.00 1.00 1.00 1.00 0.00 1.00 0.00 0.00 0.00 0.00 0.00 [11] 1.00 1.00 1.00 1.00 1.00 1.00 1.00 0.00 1.00 1.00 0.00 0.00 0.00 0.00 [12] 1.00 1.00 1.00 1.00 1.00 1.00 1.00 0.01 1.00 1.00 1.00 0.00 0.00 0.00 [13] 1.00 1.00 1.00 1.00 1.00 1.00 1.00 0.00 1.00 1.00 1.00 1.00 0.00 0.00 [14] 1.00 1.00 1.00 1.00 1.00 1.00 1.00 0.00 1.00 1.00 1.00 1.00 1.00 0.00 [15] 1.00 1.00 1.00 1.00 1.00 1.00 1.00 0.03 1.00 1.00 1.00 1.00 1.00 1.00
Remarks: [1] = Arumanis 143; [2] = Saigon; [3] = Mangifera gedebe; [4] = Irwin; [5] = Haden; [6] = Li’ar; [7] Khirsapati Maldah; [8] = Paw-paw; [9] = Bangalora; [10] = Madu Segoro; [11] = Gedong Gincu; [12] = Keitt; [13] = Agung; [14] = Delima; [15] = Apel Merah; numbers above the diagonal = standarderror; Numbers under the diagonal = inter-accessions distance; yellow mark = biases data
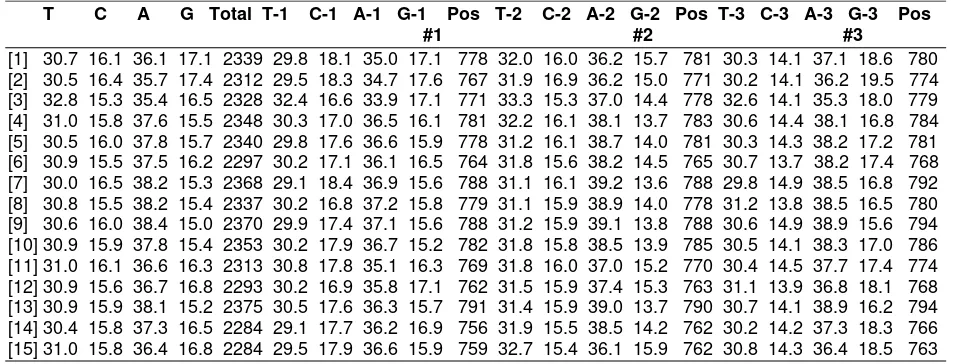
Table 4. Bases composition inter-accessions
T C A G Total T-1 C-1 A-1 G-1 Pos T-2 C-2 A-2 G-2 Pos T-3 C-3 A-3 G-3 Pos #1 #2 #3
[1] 30.7 16.1 36.1 17.1 2339 29.8 18.1 35.0 17.1 778 32.0 16.0 36.2 15.7 781 30.3 14.1 37.1 18.6 780 [2] 30.5 16.4 35.7 17.4 2312 29.5 18.3 34.7 17.6 767 31.9 16.9 36.2 15.0 771 30.2 14.1 36.2 19.5 774 [3] 32.8 15.3 35.4 16.5 2328 32.4 16.6 33.9 17.1 771 33.3 15.3 37.0 14.4 778 32.6 14.1 35.3 18.0 779 [4] 31.0 15.8 37.6 15.5 2348 30.3 17.0 36.5 16.1 781 32.2 16.1 38.1 13.7 783 30.6 14.4 38.1 16.8 784 [5] 30.5 16.0 37.8 15.7 2340 29.8 17.6 36.6 15.9 778 31.2 16.1 38.7 14.0 781 30.3 14.3 38.2 17.2 781 [6] 30.9 15.5 37.5 16.2 2297 30.2 17.1 36.1 16.5 764 31.8 15.6 38.2 14.5 765 30.7 13.7 38.2 17.4 768 [7] 30.0 16.5 38.2 15.3 2368 29.1 18.4 36.9 15.6 788 31.1 16.1 39.2 13.6 788 29.8 14.9 38.5 16.8 792 [8] 30.8 15.5 38.2 15.4 2337 30.2 16.8 37.2 15.8 779 31.1 15.9 38.9 14.0 778 31.2 13.8 38.5 16.5 780 [9] 30.6 16.0 38.4 15.0 2370 29.9 17.4 37.1 15.6 788 31.2 15.9 39.1 13.8 788 30.6 14.9 38.9 15.6 794 [10] 30.9 15.9 37.8 15.4 2353 30.2 17.9 36.7 15.2 782 31.8 15.8 38.5 13.9 785 30.5 14.1 38.3 17.0 786 [11] 31.0 16.1 36.6 16.3 2313 30.8 17.8 35.1 16.3 769 31.8 16.0 37.0 15.2 770 30.4 14.5 37.7 17.4 774 [12] 30.9 15.6 36.7 16.8 2293 30.2 16.9 35.8 17.1 762 31.5 15.9 37.4 15.3 763 31.1 13.9 36.8 18.1 768 [13] 30.9 15.9 38.1 15.2 2375 30.5 17.6 36.3 15.7 791 31.4 15.9 39.0 13.7 790 30.7 14.1 38.9 16.2 794 [14] 30.4 15.8 37.3 16.5 2284 29.1 17.7 36.2 16.9 756 31.9 15.5 38.5 14.2 762 30.2 14.2 37.3 18.3 766 [15] 31.0 15.8 36.4 16.8 2284 29.5 17.9 36.6 15.9 759 32.7 15.4 36.1 15.9 762 30.8 14.3 36.4 18.5 763
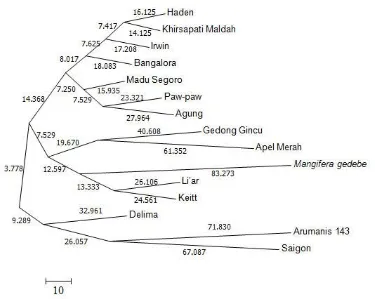
Remarks: Branch length numbers were exhibited number of base substitution
Figure 3. Base substitutionss of 15 studied mango accessions Differences in base composition reflected
the base substitution at each accession. Base substitution value was determined by the value of branch length in phylogenic tree (Figure 3). These results were in accordance with the opinion of Yang (1996), who stated that the difference value of base sequence was caused by base substitution. Tamura et al. (2013) asserted that the degree of difference on DNA base sequences could lead to the degree similarity or difference characters.
The greater branch length value showed a difference in the characters of accession. Mangifera gedebe species is an accession that has the largest branch length value. These indicate the high difference in base composition between Mangifera gedebe and others. The anatomy character of Mangifera gedebe fruits is one of the striking differences that may differentiate the species with the other Mangifera indica accessions. The mesocarp of Mangifera gedebe fruits was not
developed (the exocarp was directly attached to endocarp).
Genetic Distance and Grouping Accessions Maximum Composite Likelihood method was used to count the value of genetic distance (Table 5). The tree branch pattern or geometries relationship of inter-accessions (topology) and grouping accessions in phylogenic tree or genetic relationship were presented in Figure 4.
[ 5] 0.057 0.056 0.058 0.017 [ 6] 0.057 0.056 0.055 0.036 0.034 [ 7] 0.062 0.057 0.061 0.017 0.014 0.033 [ 8] 0.054 0.054 0.055 0.019 0.025 0.033 0.025 [ 9] 0.062 0.056 0.054 0.020 0.018 0.036 0.017 0.023 [10] 0.056 0.054 0.054 0.020 0.020 0.030 0.022 0.020 0.022 [11] 0.059 0.061 0.062 0.039 0.038 0.042 0.039 0.040 0.043 0.040 [12] 0.058 0.055 0.056 0.033 0.033 0.023 0.033 0.033 0.035 0.029 0.042 [13] 0.062 0.059 0.055 0.024 0.023 0.037 0.026 0.024 0.022 0.022 0.039 0.038 [14] 0.058 0.056 0.067 0.038 0.036 0.037 0.036 0.037 0.038 0.034 0.042 0.036 0.043 [15] 0.069 0.068 0.075 0.051 0.046 0.044 0.047 0.049 0.048 0.049 0.047 0.049 0.052 0.046
Remarks: [1]=Arumanis 143, [2]=Saigon, [3]=Mangifera gedebe, [4]=Irwin, [5]=Haden, [6]=Li’ar, [7]=Khirsapati Maldah, [8]=Paw-paw, [9]=Bangalora, [10]=Madu Segoro, [11]=Gedong Gincu, [12]=Keitt, [13]=Agung, [14]=Delima, [15]=Apel Merah
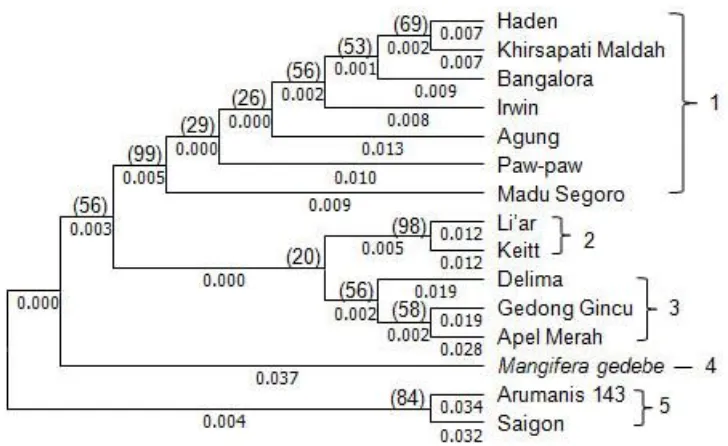
Note: Numbers in parentheses indicate the frequency bootstrap
Figure 4. Grouping accessions of 15 studied mango accessions in a phylogeny tree Grouping accessions were based on the
availability of branch and value of bootstrap. Two or more accessions were classfied into the same group when the values of bootstrap were equal or more than 95% (Felsenstein, 1985; Brown, 1994). Based on this determination, the 15 mango accessions were classified into five
be estimated based on the appearance of parental crossing. Selection of parental crossing can be determined based on the information of genetic relationship and genetic distance. One of them is to estimate the heterosis phenomenon.
CONCLUSION
Based on chloroplast DNA (cpDNA), the accessions of fifteen mango were grouped into five different clusters based on similarity and difference composition of bases with very close relationship among accessions in each group.
ACKNOWLEDGEMENT
We deeply thank Tantri Swandari, a laboratory technician at genetic and breeding laboratory, Gadjah Mada University for her help during laboratorial work. This study was financed by Graduate Faculty of Agricultural Research Grant, Gadjah Mada University, year of 2013.
REFERENCES
Brown, J.K. 1994. Bootstrap hypothesis tests for evolutionary trees and other dendrograms. Proceedings of the National Academy of Sciences. USA. 91 (25): 12293-12297. Doyle, J.J. and J.L. Doyle. 1990. A rapid total DNA
preparation procedure for fresh plant tissue. Focus 12: 13-15.
Felsenstein, J. 1985. Confidence limits on phylo-genies: an approach using the bootstrap. Evolution 39 (4): 783-791.
FAOSTAT. 2012. Top production mangoes, mangosteen, guavas 2012. Food and Agriculture Organization of the United Nation. Statistic Division. faostat.fao.orf/ site/339/default.aspx. Accessed on August 20, 2015.
Gvozdenovic, S., S. Bado, R. Afza, S. Jocic and C. Mba. 2009. Intervarietal differences in amplification of chloroplast intergenic regions with intraspecific variation. Molecular Ecology 8 (3): 521-523.
Hoshino, A.A., J.P. Bravo, P.M. Nobile and K.A. Morelli. 2012. Microsatellites as tools for genetic diversity analysis. In: Genetic Diversity in Microorganisms. M. Caliskan (ed.). pp. 149-170.
Intrieri, M.C., R. Muleo and M. Buiatti. 2007. Chloroplast DNA polymorphisms as molecular markers to identify cultivars of Olea europaea L. The Journal of Horti-cultural Science and Biotechnology 82 (1): 109-113. doi: 10.1080/14620316.200 7.11512206
Khan, I.A. and M.K. Azim. 2011. Variations in intergenic spacer rpl20-rps12 of mango (Mangifera indica) chloroplast DNA: genetic correlations between traits in Mango. Scientia Horticulturae 75 (1-2): 11-25. doi: 10.1016/S0304-4238(98)001 12-5
Lavi U., K. Kashkush, D. Sa’ada, H. Shats, U. Ravid and E. Tomer. 2004. Mango breeding and the potential of modern biology. ISHS Acta Horticulturae 645: VII International Mango applications of modern biological tech-niques in breeding fruit trees. Journal of Fruit and Ornamental Plant Research 14
Mukherjee, S.K. and R.E. Litz. 2009. 1. Introduction: botany and importance. In: The mango, 2nd edition: Botany, production and uses. R.E. Litz (ed.). Oxfordshire: CAB Inter-national.. pp. 1-18.
2006. An overview of molecular marker methods for plants. African Journal of Biotechnology 5 (25): 2540-2568. Sauco, V.G. 2004. Mango production and world
market: current situation and future prospects. ISHS Acta Horticulturae 645: VII International Mango Symposium. 645: 107-116. doi: 10.17660/ActaHortic. 2004.645.7
Tateno, Y., N. Takezaki and M. Nei. 1994. Relative efficiencies of the maximum-likelihood,
evolutionary genetics analysis version 6.0. Molecular Biology and Evolution 30 (12): 2725-2729. doi: 10.1093/molbev/ mst197
Usman, M., B. Fatima and M.J. Jaskani. 2001. Breeding in mango. International Journal of Agriculture & Biology 3 (4): 522-526. Yang, Z. 1996. Phylogenetic analysis using