http://dx.doi.org/10.17503/Agrivita-2012-34-2-p175-186
PARTICULATE ORGANIC MATTER AS A SOIL QUALITY INDICATOR OF
SUGARCANE PLANTATIONS IN EAST JAVA
Nurhidayati1*), Endang Arisoesilaningsih2),Didik Suprayogo3), and. Kurniatun Hairiah3) 1) Faculty of Agriculture, Islamic University of Malang, East java, Indonesia
Jl. Mayjen Haryono 193 Malang 65144 East Java Indonesia 2) Faculty of Mathematics and Sciences University of Brawijaya
Jl. Veteran Malang 65144 East Java Indonesia 3) Faculty of Agriculture, University of Brawijaya Jl. Veteran Malang 65144 East Java Indonesia
*) Corresponding author Phone: +62-341- 551932 E-mail: [email protected]
Received: May 23, 2012/ Accepted: August 10, 2012
ABSTRACT
The research tested the degree of independence of two soil quality indicators for sugarcane plantations: the particulate organic matter (POM) content and earthworm density across five sites in Malang district, East Java. Sites reflected a gradient in average annual rainfall (1400-2500 mm/year) and two types of soil management: with and without organic input. Soil samples taken from a depth of 0-20 cm were analyzed for total organic C (TOC), total N (TN), POM-C, and POM-N and earthworm density and biomass. The TOC was corrected by the clay content using pedotransfer equations, so TOCref was obtained. The soils treated with organic input had higher TOC (18%), TN (28%), POM-C (70%), POM-N (64%), earthworm density (89%) and biomass (92%) than the soils without organic input. A statistically significant interaction was found between variation in annual rainfall and soil management types in their influence on TOC, TN, POM-C, POM-N, earthworm density and biomass. Increase in TOC, TOC/TOCref, and POM-C tend to be associated with increase in earthworm density (r=0.590;0.667;0.738) and biomass (r=0.622;0.732;0.581). As an easily measured indicator of biological soil health, POM-C is suited for monitoring soil quality in sugarcane plantations: earthworm density does provide additional information that may justify its regular measurement.
Keywords: total C, particulate organic matter, earthworm, soil quality, sugarcane plantation
INTRODUCTION
Soil organic matter (SOM) content is seen as an important indicator of soil fertility and quality in addition to other indicators such as soil structure, nutrient balance and the population density of biota such as earthworms (Gregorich et al., 1994). Total C-organic content relates to soil chemical, physical and biological properties, and processes in the soil, but more dynamically sensitive indicators may be needed as part of management and monitoring systems. Total C-organic content responds to soil physical characteristics (e.g. clay content) as well as soil management practices (Van Noordwijk et al., 1997; Haynes, 2005). It consists of various fractions with varying turn-over time and function. The CENTURY model of soil organic matter dynamics (Parton et al., 1987), distinguishes SOM pool with fast turn-over (<2 years) such as the metabolic, structural and active SOM, and slow turn-over pool (with a half time of around 8 years) and a passive (stable) pool (half life time about two thousand years) that is not available for soil microorganisms. Labile SOM fractions are more responsive to land use and management practices than the other fractions (Cambardella and Elliot, 1992; Ding et al., 2006): corrections for soil textural variation influencing the slow and passive pools may be needed if total SOM is to be used across sample locations.
Mapfumo, 2008). In addition the method is also used to study the improvement of marginal agricultural land (Mao and Zeng, 2010) and the land use change of monocropping system to agroforestry (Mao et al., 2011). However, measurements of POM as an important indicator to evaluate the productivity of sugarcane land have so far been limited.
Earthworms are important as part of soil macrofauna that acts as a key regulator of soil structure and dynamics of the SOM in the agro-ecosystem. However, in conducting their activities in soil, worms are influenced by various factors that regulate populations such as climatic conditions, soil characteristics and availability of organic materials as their food source (Kale et al., 2010). Therefore, the earthworm population density has been used to evaluate the impact of application of manure and NPK fertilizer in the long-term (Estevez et al., 1996), the effect of various land management practices (Reddy et al., 1997), assessing the productivity of rubber plantations (Chaudhuri et al., 2008) and as bio-indicator of agricultural land management practices (Suthar, 2009). It is even used as an indicator of heavy metals and pollutants from agrochemical residues (Mahmoud, 2008).
To improve soil fertility of sugarcane land, inorganic and organic fertilizer inputs are needed. However, the evaluation of its success is still limited. Evaluation of soil quality of sugarcane land using simple indicators of POM and the population density of earthworms needs to be done. The purpose of this study was to test the hypothesis that the soil quality of sugarcane plantation is closely linked with decreased content of POM-C and earthworm population.
MATERIALS AND METHODS Study Site and Time
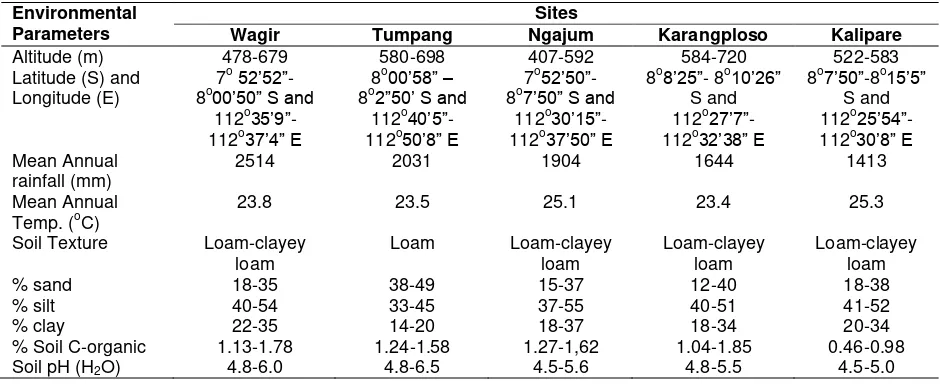
The research was conducted at five sites (Wagir, Tumpang, Ngajum, Karangploso, and Kalipare) of monoculture sugarcane plantation area in Malang district, East Java, Indonesia. The selected plots were established as sugarcane plantation for more than 10 years under conventional soil management with Inceptisol soil type. The five sites were selected based on differences in average annual rainfall ranges from high to low annual rainfall. Environmental characteristics of each site are presented in Table
1. The research was conducted during the gro-wing season of sugarcane in November 2010 to July 2011.
Treatment
Two factors that were interacting in this study were rainfall and soil management. The five sites differed in mean annual rainfall (Table 1). The second factor is the type of soil management, namely the organic fertilizer input of sugar agro-industry waste (5-10 Mg ha-1) at least once in three years, and inorganic fertilizer only with a dose of 800 kg ha-1 ammonium sulfate and 200 kg ha-1 NPKas compound fertilizer 15:15:15. Based on crop performance, sampling sites in each location included good, average and poor crop with two replicates and 4 sampling points per replicate. Soil Sampling and Analysis
Soil sampling was carried out between two rows of sugarcane at a depth of 0-20 cm. Four soil samples were taken from each plot, where the distance between the sampling points was 10 m. The soil samples were mixed evenly and air-dried, crushed and sieved to 100-mesh sieve size. Furthermore, the soil samples were analyzed for total organic carbon (TOC) (Walkley and Black, 1934), total soil N (TN) with the Kjeldahl method (Jackson, 1973), soil pH, soil texture by the pipette method of mechanical analysis. Undisturbed soil sample was used to measure the soil bulk density (BD) by calculating the ratio of the mass of soil by volume of soil (Okalebo and Gathua, 1993). The Corrected Total Organic Carbon (TOCref)
The obtained data of TOC was corrected with soil depth, soil pH, clay and silt content and altitude, in order to obtain soil TOCref using pedotransfer equation (Van Noordwijk et al., 1997). For Inceptisol, the following equation was used :
where:
Zs = depth of soil sampling, cm H = altitude (meter above sea level)
Table 1. Location and soil characteristics of the study sites Environmental
Parameters
Sites
Wagir Tumpang Ngajum Karangploso Kalipare
Altitude (m) 478-679 580-698 407-592 584-720 522-583 Latitude (S) and % Soil C-organic 1.13-1.78 1.24-1.58 1.27-1,62 1.04-1.85 0.46-0.98 Soil pH (H2O) 4.8-6.0 4.8-6.5 4.5-5.6 4.8-5.5 4.5-5.0
Source : Nurhidayati et al. (2011)
POM-Fractionation
The processed samples from each plot were taken for Particulate Organic Matter (POM) analysis. POM analysis was done by separating the SOM fractions based on wet sieving technique developed by TSBF (Hairiah, 1996). The air-dry soil (500 g) which has been re-wetted, was separated by using a wet sieve with a size of 2000, 250, 150, and 50 μm diameter. The materials which retained on >50, 150, 250 µm sieves were dried in the oven at 65oC for 24 hours, weighted, and referred as a POM-coarse fraction (>250μm-2 mm), POM-intermediate fraction (150-250μm), and POM-fine fraction (>50-150μm). Total organic carbon (Walkley and Black) and total N (Kjehldahl) were determined by every fraction as a particulate organic matter-C (POM-CC,I,F) and a particulate organic matter-N (POM-NC,I,F) (Okalebo and Gathua, 1993).
Earthworm Sampling and Assessment
The population density (D) of earthworms was determined from soil monoliths (25cm x 25cmx 20cm size), at 120 point measurements of the 10 m x 10 m transect, according to a sampling procedure described by Huising et al., (2008). Earthworm samples were collected by hand sorting and weighed for fresh weight (biomass, B g indiv.-1) measurement. Weight per individual was estimated by earthworm biomass and density ratio (B/D).
Statistical Analysis
The obtained data were subjected to analysis of variance (ANOVA) using program Minitab Version 14.12 to compare the interaction effects of sites with different annual rainfall and soil management on the measured parameters. The Duncan t-test (5%) procedure was used to separate the means of selected parameters at p=0.05. For statistical analysis of data (regression, correlation, and charts) Microsoft Excel was used. The Pearson correlation was used to relate earthworm variables with the soil variables.
RESULTS AND DISCUSSION RESULTS
Total Soil C and N
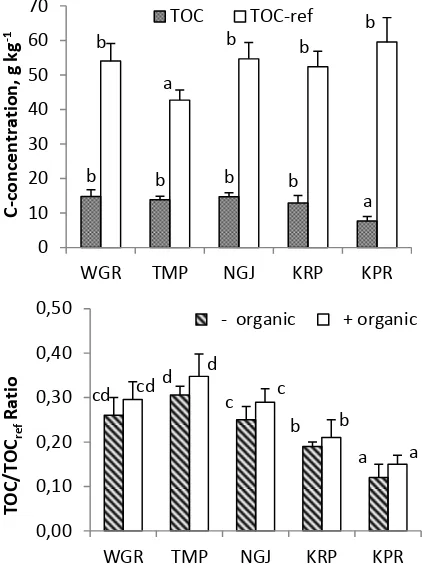
Interaction between the sites with different rainfall and the type of soil management did not significantly (p<0.05) influence the total organic carbon (TOCorg) and total N (TN) of soil. Separately, the effect of different characteristics of sites and type of soil management significantly (p<0.05) affected the TOC and TN in the soils. At all sites of the selected sugarcane plantations, the soils treated with organic input were higher than the treatments without organic input (Figure 1).
site, the wettest areas (2514 mm per yr), had the highest average of TOC (16.23 g per kg) for the treatment with organic input, but was not significantly different from three other sites that had lower annual rainfall such as Tumpang (14.51 g per kg), Ngajum (15.53 g per kg), and Karangploso (14.27 g per kg) with an average annual rainfall as 2031, 1904, and 1644 mm per yr, respectively.
The Corrected Soil Organic Matter (TOC/TOCref) The addition of organic matter into soil of sugarcane plantations did not significantly influence (p<0.05) the corrected SOM (TOCref). The differences in TOCref were only significantly influenced (p<0.05) by the site's factor which had various altitude and soil properties. The highest TOC of 59.49 g kg-1 was found at Kalipare site and the lowest value was found at Tumpang site (Figure 2).
Figure 1. The effect of organic matter input to the average total organic C (TOC) and total soil N (TN) at five sites of sugarcane plantations. The magnitude of the bar shows the standard deviation (n = 6). Bar values followed by different letters are significantly different (p <0.05). (Remarks: WGR = Wagir; TMP = Tumpang ; NGJ = Ngajum; KRP = Karangploso; KPR = Kalipare.)
The results of calculation of TOC/TOCref from all sites showed an average value of less than 0.5 (Fig.2), which means that the sugarcane lands of the five sites can be regarded as less healthy soil. According to Van Noordwijk et al., (1997), the soil is classified as a healthy soil when the TOC /TOCref is close to 1.0, such as in natural forest soils. The soils of sugarcane plantation at Tumpang site showed the highest TOC /TOCref, but were not significantly different from Wagir. The soil of sugarcane plantations with organic input treatment had 14% TOC/TOCref higher than the soil of sugarcane plantations treated without organic inputs (0.23). The highest increase in TOC /TOCref was found at Kalipare site (25%), while the lowest increase at Karangploso site (10.5%) (Figure 2).
POM-C and POM-N
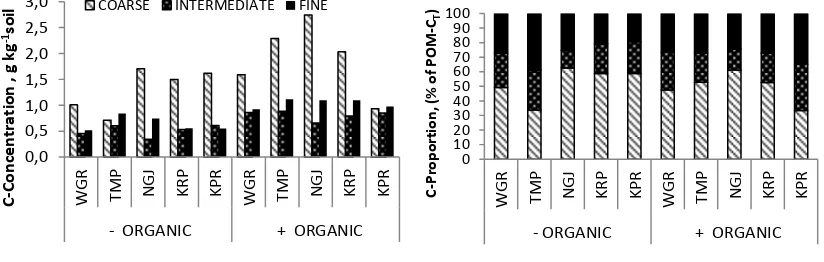
The interaction between sites with different annual rainfall and the type of soil management in sugarcane cultivation significantly (p<0.05) affected the C concentration of coarse fraction (POM-CC) and total POM-C (POM-CT). However, the interaction effect did not affect the POM-CI and POM-CF. Separately, the influence of differences in annual rainfall and type of soil management significantly (p<0.05) affected POM-CI and POM-CF. The addition of organic matter in the sugarcane lands increased POM-CC- POM-CI, and POM-CF by 94.2, 61.4, 66.4%, respectively compared to sugarcane lands without organic inputs, except for POM-CC at Kalipare site (Table 2).
Table 2. The effect of organic matter input on the C concentration of each fraction and its proportion of the POM-CT at five sites of sugarcane plantation
Site Treatment POM-C (g per kg soil) (g per kg soil) POM-CT POM-C (% of POM-CT)
Remarks: Means followed by the different letter are significantly different (P<0.05). s significant (P<0.05) ; ns non-significant; C coarse fraction , I intermediate fraction, F fine fraction
Figure 3. The effect of organic matter input on the C concentration of each fraction and its proportion of total POM-C at five sites of sugarcane plantations (Remarks: WGR = Wagir; TMP = Tumpang ; NGJ = Ngajum; KRP = Karangploso; KPR = Kalipare)
0,0
il COARSE INTERMEDIATE FINE
POM-C proportions of each fraction were influenced by the interaction between site and type of soil management. Ngajum site showed the largest average proportion of POM- CC to POM-CT, but was not significantly different from Kalipare and Karangploso site. The largest proportion of the POM-CI relative to POM-CT was found in the soil of sugar cane plantation at Tumpang, Wagir and Kalipare sites, while the largest proportion of POM-CF was found at Tumpang and Kalipare sites. The addition of organic matter only increased the proportion of POM-CC relative to POM-CT in the soil of sugarcane plantation at Tumpang site. However, the addition of organic matter increased the proportion of POM- CI relative to POM- CT at all sites (Table 2 and Figure 3), but not for the proportion of POM- CF to POM- CT. Overall POM-CT for the soils of sugar cane plantations treated with the organic input at five sites were higher than the soils treated without organic input (Table 2), except at Kalipare site. The soil of sugarcane plantations treated with organic input had 70 % POM-CT higher than the soil treated without organic input (2.46 g per kg).
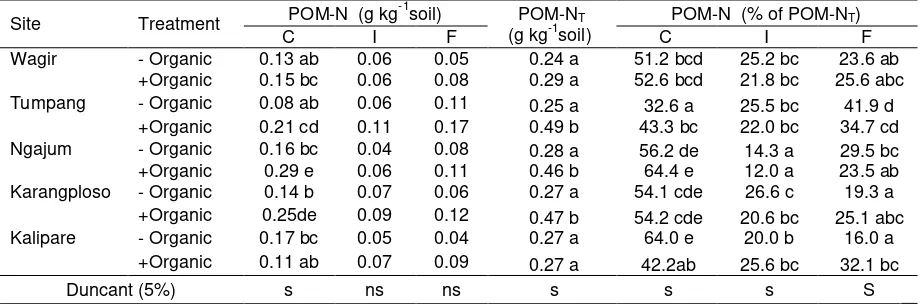
Similar results are shown in POM-N. The highest average of POM-NC was found in the soil of sugarcane plantation at Ngajum site with
organic inputs, but it was not significantly different from Karangploso site with organic input (Table 3). The N proportion of each fraction was influenced by the interaction between site and type of soil management. Ngajum site shows the largest proportion POM-NC of POM-NT, but it was not significantly different from Karangploso site. The addition of organic matter increased the proportion POM- NC of POM-NT at Tumpang site. The largest proportion POM-NI of the POM-NT was found at Wagir, Tumpang, Karangploso, and Kalipare, while Ngajum had the lowest proportion of POM-NI of POM-NT. However, the addition of organic matter does not increase the proportion of POM-NI of POM- NT at all sites. The addition of organic matter increased the proportion of POM-NF of POM- NT significantly (P<0.05) at Kalipare site (Table 3). Overall POM-NT for the treatment with the organic input at five sites was higher than the treatment without organic input (Table 3), except at the Kalipare and Wagir sites. Sugarcane lands with organic inputs had POM-NT 63.8% higher than the sugarcane lands without organic inputs (0.26 g per kg). The highest increase in POM-CT and POM-NT as the result of the addition of organic matter was found at Tumpang site by 97.7% and 96.0%, respectively.
Table 3. The effect of organic matter input on the N concentration of each fraction and its proportion of the POM-NT at five sites of sugarcane plantation
Site Treatment POM-N (g kg -1
soil) POM-NT (g kg-1soil)
POM-N (% of POM-NT)
C I F C I F
Wagir - Organic 0.13 ab 0.06 0.05 0.24 a 51.2 bcd 25.2 bc 23.6 ab +Organic 0.15 bc 0.06 0.08 0.29 a 52.6 bcd 21.8 bc 25.6 abc Tumpang - Organic 0.08 ab 0.06 0.11 0.25 a 32.6 a 25.5 bc 41.9 d
+Organic 0.21 cd 0.11 0.17 0.49 b 43.3 bc 22.0 bc 34.7 cd Ngajum - Organic 0.16 bc 0.04 0.08 0.28 a 56.2 de 14.3 a 29.5 bc +Organic 0.29 e 0.06 0.11 0.46 b 64.4 e 12.0 a 23.5 ab Karangploso - Organic 0.14 b 0.07 0.06 0.27 a 54.1 cde 26.6 c 19.3 a
+Organic 0.25de 0.09 0.12 0.47 b 54.2 cde 20.6 bc 25.1 abc Kalipare - Organic 0.17 bc 0.05 0.04 0.27 a 64.0 e 20.0 b 16.0 a
+Organic 0.11 ab 0.07 0.09 0.27 a 42.2ab 25.6 bc 32.1 bc
Duncant (5%) s ns ns s s s S
Figure 4. The effect of organic matter input on POM-CT relative to TOC (A) and POM-NT relative to total N (B). The magnitude of the bar shows the standard deviation (n = 6). Bar values followed by different letters indicate significant differences (p <0.05). (Remarks: WGR = Wagir; TMP = Tumpang; NGJ = Ngajum; KRP = Karangploso; KPR = Kalipare)
Figure 4 shows that the sugarcane land with organic input treatment had a higher percentage of POM-CT relative to TOC and POM-NT relative to TN than the soils of sugarcane plantation without organic input. The average of increase rate accounted for 45.9% management in sugarcane cultivation significantly (P<0.05) affected the earthworm density and biomass. Table 4 and Figure 5 show that the sugarcane land at Tumpang site with organic input treatment had the highest population density of earthworms (269.3 individuals m-2), while the sugarcane land at Kalipare site had the lowest population density of earthworms either with organic inputs (33.3 individuals m-2) or without the input of organic (13.3 individuals m-2). Organic input into sugarcane lands improved the earthworm density and biomass. The average increase in management significantly (P<0.05) affected the average weight per individual earthworm (B/D). However, separately, the addition of organic matter did not significantly affect the average weight per individual earthworm. The highest average weight per individual earthworm was found at Wagir site with treatment without the input of organic matter (Table 4).
DISCUSSION
The soil of sugarcane plantation with the organic matter input of the five sites studied had higher total organic C (TOC) (18.3%), TOC/TOCref (14%) and POM-CT (70%) than without organic inputs (TOC = 11.77 g per kg; TOC/TOCref = 0.30; POM-CT = 2.47). However, the greatest improvement was obtained in the POM-CT compared with other measurements. The relationship between the three measurements and variable earthworms are presented in Figure 6.
Table 4. The effect of organic matter input on the population density, biomass and weight per individual (B/D) of earthworms at five sites of sugarcane plantations
Site Treatments Earthworm density (D) (individual m-2) Earthworm biomass (B) (g m-2) (g individualB/D -1)
Wagir - Organic 64.7 ab 28.3 b 0.41 d
+ Organic 170.7 d 50.3 c 0.31 c
Tumpang - Organic 100.0 bc 30.1 b 0.30 c
+ Organic 269.3 e 60.8 c 0.23 bc
Ngajum - Organic 113.3 c 16.5 a 0.16 ab
+ Organic 185.3 d 33.6 b 0.17 bc
Karangploso - Organic 104.7 bc 12.5 a 0.11 ab
+ Organic 117.3 c 30.0 b 0.27 c
Kalipare - Organic 24.0 a 4.6 a 0.18 ab
+ Organic 33.3 a 6.2 a 0.18 ab
Duncant 5% s s s
Remarks: Means followed by the different letter are significantly different (P<0.05). S significant (P<0.05) ; ns non-significant
Figure 5. The effect of organic matter input on the population density and biomass of earthworms. (Remarks: WGR = Wagir; TMP = Tumpang; NGJ = Ngajum; KRP = Karangploso; KPR = Kalipare)
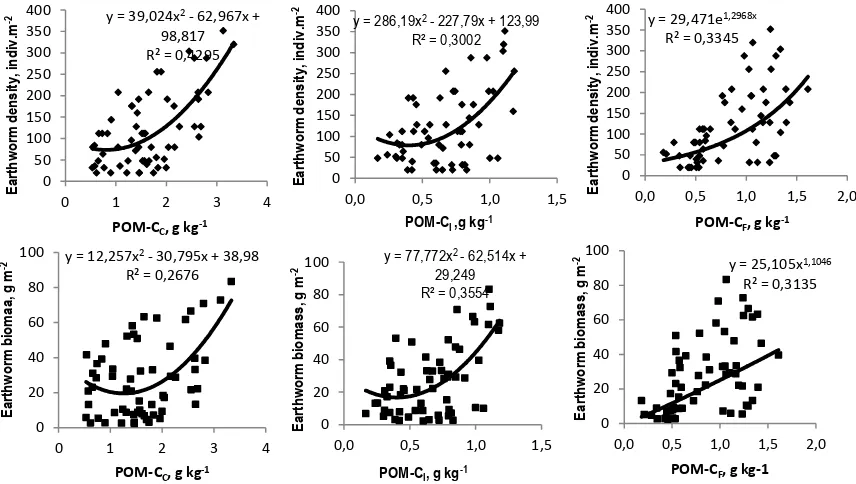
Regression analysis showed that the variables TOC, TOC/TOCref, and POM-CT were closely related and significant (p <0.05) with population density and biomass of earthworms, however, there is no significant relationship with an average weight per individual (B/D) earthworms (Fig. 6). Third of the correlation analysis between these variables, POM-CT was more closely related to the earthworm population density compared with other variables. Variable TOC/TOCref was
more closely associated with earthworm biomass (Table 5). Based on the increase in variable TOC, TOC/TOCref and POM-CT in the treatment of organic inputs compared with the treatment without organic input, correlation, and regression analysis indicated that the indicators of POM-CT and TOC/TOCref were more sensitive to assess changes in soil quality and productivity in sugarcane plantations.
0 10 20 30 40 50 60 70
0 50 100 150 200 250 300
WGR TMP NGJ KRP KPR WGR TMP NGJ KRP KPR
-organic + organic
E
ar
h
wo
rm
B
io
m
ass,
g
m
-2
E
ar
th
wo
rm
D
e
n
si
ty
,
in
d
iv
.
m
Figure 6. The relationship between POM-CC, POM- CI, and POM-CF with the earthworms variables POM is labile fraction of soil organic matter.
It is a major fraction of the SOM in surface soil and more sensitive to changes of land management (Cambardella and Elliott 1992; Zhang et al., 2006). In addition, POM is uncomplexed fraction of the SOM so that it can be a substrate for microbial activity, and it is also an important agent in the formation macro-aggregate (Franzluebber, 2002; Causarano et al., 2008). POM is also an intermediate fraction of litter (with a rapid turnover) and mineral associated with SOM (with a slow turnover). Active fraction of organic matter plays an important role in the plant nutrient supply, decomposition of organic residues, and the development of soil structure (Franlzluebbers, 2002). Heightened levels of POM-C and POM-N will increase the potential availability of C and N, thus, they will increase soil fertility and quality (Handayani et al., 2010).
The measurement of POM-C on sugarcane lands at five sites with two types of soil management ranged from 1.99-4.50 g kg-1 soil. The values were considered slightly higher compared to the results from Handayani et al., (2010) for monoculture land as much as 2.24 g kg -1 management, climate condition and soil characteristics.
The relationships between TOC/TOCref and biomass of earthworms and the high correlation coefficient were also provided (Table 5). This suggests that the measurement of these indicators can be used to assess the soil quality and health in sugarcane plantations. Ortiz-Ceballos and Fragoso (2004) reported that in 33% soil moisture conditions, abundance and biomass of earthworms were higher in the soil receiving organic matter input compared to conventional soil management without the organic matter input. This is caused by the amount of organic matter and N content is higher.
material has to be done every year. These results are consistent with those reported by Hairiah et al., (2000) suggesting that in order to maintain soil productivity in the tropics, the SOM content should be maintained between 2.5 - 4.0%. It required the organic matter input as much as 8 to 9 Mg ha-1 yr -1. Organic matter input combined with N fertilizer every year on the sugarcane land in North Lampung can improve soil organic matter status in the fourth year (Hairiah et al., 2003).
Regression and correlation analysis between the C concentration of each fraction (POM-CC,I,F) indicated that the POM-CC, POM-CI, and POM-CF were closely related and were significant (p <0.05) with population density and biomass of earthworm. However, there was no significant relationship with an average weight per individual (B/D) of earthworms (Table 5 and Figure 5). Third of the correlation analysis between these variables, POM-CC were more closely related to the earthworm population density compared with other variables. This means that earthworm in the sugarcane plantation is more responsive to the addition of new organic matter. Coarse fraction is the labile fraction and is a matter that has not decomposed yet (Bossuyt et al., 2004; Pulleman et al., 2005.). This organic matter is an energy source of soil microorganisms and is easily degraded (Gregorich et al., 2006). Similarly, earthworms prefer the new organic matter, but are partially decomposed to be particle with intermediate size (> 50 μm) (Lavelle and Spain, 2001).
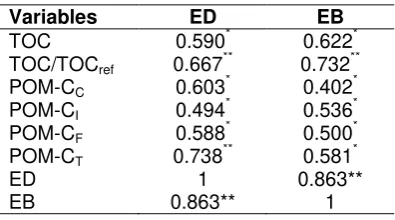
Table 5. Correlation coefficient of the relationship between soil properties and earthworm variables
Variables ED EB
TOC 0.590* 0.622*
TOC/TOCref 0.667** 0.732**
POM-CC 0.603* 0.402*
POM-CI 0.494* 0.536*
POM-CF 0.588* 0.500*
POM-CT 0.738** 0.581*
ED 1 0.863**
EB 0.863** 1
Remarks: ns = non-significant ; *= Significance level P < 0.05 ; **= Significance level P< 0.01 ED = Earthworm density ; EB = Earthworm biomass ; BD = Soil bulk density ; BDref= the corrected BD
These results explain that the presence of earthworms as bio-indicator of soil quality is largely determined by changes in soil C- organic content, total soil N, the labile fraction of organic matter (particulate organic matter), and the availability of N released by the particulate organic matter. Topoliantz et al., (2002) reported that earthworm population density was positively correlated with total soil N through the positive influence of earthworms (Pontoscolex corethrurus) of N mineralization (González and Zou, 1999).
CONCLUSIONS AND SUGGESTIONS Soil quality of sugarcane plantation can be measured by several indicators of the TOC, the TOC/TOCref ratio and POM-C. Among the indicators, the TOC/TOCref, POM-C, population density and biomass of earthworms show high sensitivity to assess changes in soil quality of sugarcane plantation due to the addition of organic matter; the indicators show a large increase when compared with the soil of sugarcane plantation without organic input (conventional) mainly on sugarcane plantations with high relatively rainfall and low clay content. It is suggested that to facilitate the assessment of soil quality of sugarcane plantation based on these indicators can be done by observing the population density of earthworms in the field. For further study, the addition of organic matter and earthworms on the productivity of sugarcane needs to be tested.
ACKNOWLEDGMENTS
We thank the farmers for the soil samples as well as to provide information on land management, Directorate of Higher Education, Ministry of Education and Culture of Indonesia and the staff of the Department of Soil Science, Brawijaya University who contributed in the soil analysis in the laboratory.
REFERENCES
Bossuyt, H., J. Six, P.F. Hendrix. 2004. Rapid incorporation of fresh residue-derived carbon in to newly formed stable microaggregates within earthworm casts. Eur.J.Soil Sci., 55: 393–399.
across a grassland cultivation sequence. Soil Sci. Soc. Am. J., 56: 777–783.
Causarano, H.J., A.J. Franzluebbers, J.N. Shaw, D.W. Reeves, R.L. Raper and C.W. Wood. 2008. Soil Organic Carbon Fractions and Aggregation in the Southern Piedmont and Coastal Plain. Soil Sci. Soc. Am. J., 72(1) : 34- 47.
Chaudhuri, P. S., S. Nath and R. Paliwal, “Earthworm population of rubber plantations (Hevea brasiliensis) in Tripura, India,” Tropical Ecology, vol. 49, no. 2, pp. 225–234, 2008.
Ding, G.W., X.B. Liu, S. Herbert, J. Novak, D. Amarasiriwardena and B.H. Xing. 2006. Effect of cover crop management on soil organic matter. Geoderma, 130 : 229– 239.
Estevez, B., A. N’Dayegamiye and D. Coderre. 1996. The effect on earthworm abundance and selected soil properties after 14 years of solid cattle manure and NPKMg fertilizer application. Canadian journal of soil science35 :351-355
Franzluebbers, A.J. 2002. Soil organic matter stratification ratio as an indicator of soil quality. Soil Tillage Res., 66:95–106. González, G.and X. Zou. 1999. Earthworm
influence on N availability and the growth of Cecropia schreberiana in tropical pasture and forest soils. Pedobiologia, 43:824–829.
Gregorich, E.G., M.R. Carter, D.A. Angers, C.M.Monreal and B.H.Ellert. 1994. Towards a Minimum Data Set to Assess Soil Organic Matter Quality in Agricultural Sois. Can.J.Soil.Sci.,74 : 367-85.
Gregorich, E.G., M.H. Beare and U.F. Mckim. 2006. Chemical and biological characteristics of physically uncomplexed organic matter. Soil Sci. Soc. Am. J., 70: 975–985.
Hairiah, K., A.R. Latif, I.G. Mahabratha and M. van Noordwijk. 1996. Soil organic matter fractionation under different landuse type in North Lampung. Agrivita J. 19 (4) : 146-149.
Hairiah, K., Widianto, S.R. Utami, D. Suprayogo, S.M. Sitompul, Sunaryo, B. Lusiana, R. Mulia, M. van Noordwijk and G. Cadisch. 2000. Acid Soil Management Biologically : Reflection of Experiences from North Lampung. ICRAF-Bogor. p 187.
Hairiah, K., P. Purnomosidhi, N. Khasanah, N. Nasution, B. Lusiana, M. van Noordwijk. 2003. The use of bagasse and trash for improvement of soil organic matter status and sugarcane production in North Lampung : Measurement and simulation estimation WANuLCAS. Agrivita J. vol 35 : 30-40.
Handayani, I.P., M.S. Coyne and R.S. Tokosh, 2010. Soil organic matter fractions and aggregate distribution in response to tall fescue stands. Int. J. Soil Sci., 5: 1-10. Haynes, R.J.2005. Labile organic matter fractions
as central components of the quality of agricultural soils: an overview. Adv Agron., 85:221–268.
Huising, E.J., Coe, R., Cares, J.E., Louzada, J.N., Zanetti, R.,.Moreira, F.M.S, Susilo, F.X., Konate, S., van Noordwijk, M., and Huang, S.P. 2008. Sampling Strategy and Design to Evaluate Below-ground Biodiversity. In A Handbook of Tropical Soil Biology. F.M.S.Moreira, E.J.Huising and D.E. Bignell (eds). Earthscan publishing for a sustainable future. London. Sterling, V.A.p.17-41.
Kale, R.D. and N. Karmegam. 2010. The Role of Earthworms in Tropics with Emphasis on Indian Ecosystems. Applied and Environmental Soil Science, Vol.2010. Article ID 414356, 16 p.
Koutika, L.S. S. Hauser and J. Henrot. 2001. Soil organic matter assessment in natural regrowth, Pueraria phaseoloides and Mucuna pruriens. Soil Biology and Biochemistry, 33. Issues 7-8,June 2001: 1095-1101.
Lavelle, P. and A.V. Spain. 2001. Soil Ecology. Kluwer Academic Publ. Dordrecht. 300p. Mahmoud, H. M. 2008. Earthworm (Lumbricus
terrestris) as indicator of heavy metals in soils. Online Journal of Veterinary Research.11 : 23–37.
Mao, R. and D. Zeng. 2010. Changes in Soil Particulate Organic Matter, Microbial Biomass, and Activity Following Afforestation of Marginal Agricultural Lands in a Semi-Arid Area of Northeast China. Environmental Management, 46:110–116.
Mao, R., D. Zeng and L.J. Li and Y. Hu. 2011. Changes in labile soil organic matter fractions following land use change from
agroforestry systems in a semiarid region of Northeast China. Environ Monit Assess. DOI 10.1007/s10661-011-2462-3.
Mtambanengwe, F. and E.P. Mapfumo. 2008. Smallholder farmer management impacts on particulate and labile carbon fractions of granitic sandy soils in Zimbabwe. Nutr Cycl Agroecosyst., 81:1–15.
Nurhidayati, E. Arisoesilaningsih, D. Soeprayogo and K. Hairiah. 2011. Long-term impact of conventional soil management to earthworm diversity and density on sugarcane plantation in East Java. Journal of Nature Studies 10 (2): 16-25.
Okalebo, J.R. and K.W. Gathua. 1993. Laboratory Methods of Soil and Plant Analysis : A Working Manual. TSBF Programme, Regional Office for Science and Technology for Africa, UNESCO, Nairobi, Kenya. 89 pp.
Ortiz-Ceballos, A.I. and C. Fragoso. 2004. Earthworm populations under tropical maize cultivation: the effect of mulching with velvebean. Biol. Fertil. Soils, 39: 438-445.
Ouédraogo, E., A. Mando and L. Stroosnijder. 2006. Effects of tillage, organic resources and nitrogen fertiliser on soil carbon dynamics and crop nitrogen uptake in semi-arid West Africa . Soil and Tillage Research, 91, Issues 1-2, December 2006 :57-67.
Pulleman,M.M., J. Six, A. Uyl, J.C.Y. Marinissen, A.G. Jongmans. 2005. Earthworms and management affect organic matter incorporation and microaggregate formation in agricultural soils. Appl.Soil Ecol.,29:1–15.
Reddy, M. V., V.R. Reddy and P. Balashouri P. 1997. Responses of earthworm abundance and production of surface casts and their physico-chemical properties to soil management in relation to those of an undisturbed area on a semi-arid tropical alfisol. Soil Biology and Biochemistry. 29 (3-4) pp. 617– 620. Suthar, S. 2009. Earthworm communities as
bioindicator of arable land management practices: a case study in semiarid region of India. Ecological Indicators. 9 (3) :588– 594.
Topoliantz, S. J.F. Ponge , D. Arrouays, S. Ballof and L. Patrick. 2002. Effect of organic manure and the endogeic earthworm Pontoscolex corethrurus (Oligochaeta: Glossoscolecidae) on soil fertility and bean production. Biol. Fertil. Soils ,36
:313–319.
Van Noordwijk, M., K. Hairiah, B. Lusiana and G. Cadisch. 1997. Tree soil crop interactions in sequential and simultaneous agroforestry systems. In: Bergstrom L and Kirchmann H (eds). Carbon and nutrient dynamics in natural and agricultural tropical ecosystems. CAB International, Wallingford, UK. pp 173-191.
Yan, D., D. Wang and L. Yang. 2007. Long-term effect of chemical fertilizer, straw, and manure on labile organic matter fractions in a paddy soil. Biol. Fertil. Soils 44:93– 101.