Summary Coniferous tree canopies typically carry more leaf area than is necessary to intercept most of the incoming light. I postulated that an excessively large leaf area will reduce net productivity at tree level, unless the net photosynthetic produc-tion of the most shaded shoots in the canopy remains positive. The hypothesis tested was that a coniferous tree canopy main-tains a large productive leaf area by increasing the efficiency of light capture as the available light decreases.
The light interception efficiency of a shoot was quantified by the ratio of shoot silhouette area to total needle surface area (STAR). The STAR depends on shoot geometry and varies with shoot orientation relative to the direction of light. Shade shoots have a larger STAR and, in particular, higher values of STARmax than sun shoots. In addition, shade shoots tend to be horizontally inclined, which may increase the advantage of a large STARmax in the lower canopy, where radiation is incident from angles closer to the zenith. Adaptation to shade (changes in STAR and shoot orientation) was described on the basis of empirical data for several coniferous species, and the vertical gradient of seasonal light interception by shoots was simulated assuming different adaptive strategies. Simulations were per-formed at two latitudes, to account for differences in the amount and directional distribution of light during the growing season.
Results support the hypothesis that increases in STAR, shoot zenith angle and shoot asymmetry (flatness) with shading increase the efficiency of light interception by deeply shaded shoots. However, because competition for light among shoots increases progressively as soon as shade acclimation occurs, there cannot exist a deep layer of shade shoots, such that the net productivity of each shoot remains positive (i.e., irradiance is above the compensation point). Therefore, if maximization of productive leaf area is the goal, the optimal strategy is to maintain an inefficient deep canopy and to increase light inter-ception efficiency only when shading becomes severe.
Keywords: leaf area, productivity, shade acclimation, STAR.
Introduction
I studied the adaptation of shoot geometry to modifications in the light environment in conifer species. Coniferous tree cano-pies often carry large leaf areas (high leaf area index). Because
there is a cost associated with the formation of a new shoot, and because each additional layer of leaves increases the amount of energy lost by maintenance respiration, a high leaf area potentially reduces net productivity (Sprugel 1989). I hypothesized that a tree can maintain a large productive leaf area by increasing the efficiency of light capture as the avail-able light decreases (e.g., with depth in the canopy). Because shoot geometry has an important impact on the efficiency with which shoots intercept light (Oker-Blom et al. 1991, Smolan-der et al. 1994), the capacity of shoots to alter their structure in response to the light environment has been proposed as an adaptive strategy (Leverenz and Hinckley 1990).
Light interception efficiency of a shoot can be quantified by the ratio of shoot silhouette area to total needle surface area (STAR) (e.g., Oker-Blom and Smolander 1988). The STAR depends on shoot structure and varies with the shoot orienta-tion relative to the view direcorienta-tion (sun). Generally, STAR is maximal when the shoot axis is perpendicular to the direction of projection (view direction). Shade-acclimated shoots have a larger STARmax than sun shoots (Carter and Smith 1985, Tucker et al. 1987, Leverenz and Hinckley 1990, Sorrensen-Cothern et al. 1993, Stenberg et al. 1995). In addition, the shoot angle changes so that shoots are more horizontally inclined the lower they are in the canopy (Stenberg et al. 1993). These factors tend to increase a shoot’s light interception efficiency when the distribution of incident radiation is shifted toward smaller zenith angles as a result of shading.
Based on empirical data on the range and variation in STAR of different coniferous species, I analyzed whether changes in shoot structure and shoot zenith angle in response to increased shading imply a more even distribution of light between shoots, thus allowing a larger productive leaf area to be main-tained. I simulated the vertical gradient of light interception by shoots assuming different adaptive strategies (changes in STAR and shoot zenith angle in response to shading), and compared it to the case where no shade adaptation was as-sumed.
Material and methods
Model and data on shoot geometry and STAR
The silhouette leaf area to leaf area ratio (STAR) of a shoot is
Simulations of the effects of shoot structure and orientation on vertical
gradients in intercepted light by conifer canopies
PAULINE STENBERG
Department of Forest Ecology, P.O. Box 24, FIN-00014 University of Helsinki, Finland
Received March 2, 1995
defined as the ratio of the shoot’s silhouette leaf area (SAs) on the plane perpendicular to the direction of projection (view direction) to its total needle area (TAn). The STAR depends on the internal shoot structure (mutual shading of needles) and varies with shoot orientation relative to the view direction (sun). Two types of shoots were considered (Figure 1): (a) rotationally symmetrical sun shoots representative of many Pinus species, and (b) flat (rotationally asymmetrical) shoots typical of the shade shoots of Picea and Abies species.
The silhouette area (SAs) of the symmetrical shoot was assumed to vary with the angle (φ) of the shoot axis to the plane of projection. The SAs of the flat shoot also varies with the shoot’s rotation angle (γ) relative to the view direction (Fig-ure 1). To define the rotation angle, let r denote a vector normal to the shoot axis and pointing toward the shoot’s upper side (i.e., r is normal to a hypothetical plane through the shoot axis, which divides the shoot into an upper side and a lower side). The rotation angle (γ) (0 ≤ γ ≤ π/2) is here defined as the angle between r and the plane determined by (going through) the shoot axis and the view direction.
Let (α,β) and (θ,ϑ) denote the zenith angle and azimuth of the shoot axis and view direction, respectively. The angle of the shoot axis to the plane of projection (φ) (0 ≤φ≤π/2) is obtained as:
φ= sin−1(|sinαsinθcos(β −ϑ)+ cosαcosθ|). (1)
Calculation of the rotation angle (γ) is straightforward, given the directions of the shoot axis, the vector r, and the view direction. If r is assumed to lie in the vertical plane through the shoot axis (implying that, for a vertical view direction, γ = 0), the rotation angle is given by:
γ= sin−1
In the following simulations, the rotation angle was calcu-lated by Equation 2 whenever the shoot orientation was not assumed to be spherical (in which case γ is uniformly distrib-uted). The angles φ and γ change with shoot and view direction; however, the mean STAR (STAR_____) with respect to a spherical
shoot orientation is independent of view direction. Analo-gously, STAR_____ is obtained as the mean STAR taken over all directions (θ,ϑ) of the (hemi)sphere. If the view direction is random in space (or if shoots are spherically oriented), the probability density function of the angle (φ) is f(φ) = cosφ (0 ≤ φ ≤ π/2), and the rotation angle (γ) is uniformly distributed over (0, π/2). The STAR_____ is thus obtained as: from other factors related to the internal shoot structure, STAR is modeled as: Substituting Equation 4 into Equation 3, it follows that the parameters a, b and c (≥ 0) must satisfy the condition:
Because the spherically averaged ratio of silhouette area to total surface area for a single needle is 0.25, irrespective of its shape as long as it is convex (Lang 1991), this is the value of STAR
_____
for a shoot with no within-shoot shading (disregarding the contribution of the twig in the shoot silhouette area). The departure of STAR_____ from the value of 0.25 is caused by the overlap of needles on the shoot, e.g., a value of STAR_____ = 0.15 implies that the shoot silhouette area is reduced by, on average, 40% because of mutual shading of needles on the shoot. A large value of the ratio (a + b)/a = STARmax /STARmin (Equa-tions 6 and 7) indicates a strong dependency of inclination angle (e.g., a long and narrow shoot). The parameter c (Equa-tion 8) is a measure of the asymmetry of the shoot around its axis. For the typical sun shoot, c = 0.
Measured values of STAR for several coniferous species are shown in Table 1. In two cases (Leverenz and Hinckley 1990, Stenberg et al. 1995), projected instead of total needle surface area was used as the denominator in computing the silhouette area ratios (Rmax , SPAR). These values were divided by π to obtain the STAR values given in Table 1. Note that values of STAR
_____
larger than 0.25 represent shoots with a large proportion
of twig area (included in the nominator but not in the denomi-nator of STAR).
The most extensive data on the range, and the vertical and directional variation of STAR are available for Scots pine (Pinus sylvestris L.) and Norway spruce (Picea abies (L.) Karst.) (Table 1). The material for Norway spruce (Stenberg et al. 1995) included shoots from different locations (whorls) in control and fertilized trees. In the control trees, STAR_____ in-creased from about 0.14 in Whorl 4 to about 0.18 in Whorl 13, and in the fertilized trees it increased from 0.18 to 0.26. In the upper crown, shoots were fairly symmetrical around the shoot axis (c≈ 0). The increase in STARmax with depth in the crown was proportionally larger than the increase in STAR_____, indicat-ing an increase in shoot asymmetry (parameter c). Also STARmin increased more than STAR
_____
because of a decrease in shoot length.
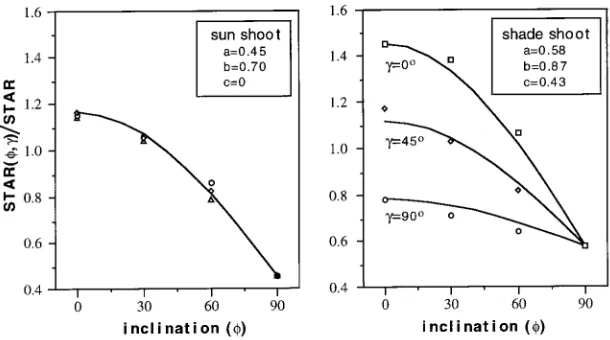
Measured and modeled values of the shape factor for a sun shoot (upper crown) and a shade shoot (lower crown), esti-mated on the basis of measured STAR_____, STARmax and STARmin (Equations 4--7), are shown in Figure 2. Estimated parameter values were a = 0.45, b = 0.70 and c = 0 for the sun shoot, and a = 0.58, b = 0.87 and c = 0.43 for the shade shoot. For the sun shoot, STARmax was only 15% higher than STAR
_____
, whereas for the shade shoot it was 45% higher.
In the simulations, STAR_____ was allowed to vary between 0.1 and 0.25. The effect of shading was modeled by an increase in STAR
_____
and increases in the parameters a, b and c.
Above-canopy light regime
The momentary irradiance of direct (Is), diffuse (Id) and total (I) radiation received on a horizontal plane on the ground can be expressed as:
Is=S0τmcosθs, (9)
Id=S0τdcosθs, (10)
and
I=S0(τm+τd)cosθs, (11)
where S0 represents the solar irradiance on a plane normal to the sun at the top of the atmosphere, θs is the solar zenith angle, τ is the transmittance of the atmosphere to direct sunlight in the zenith direction, m is the air mass, and τd is the transmittance to diffuse skylight (Gates 1980). The air mass is approximated by m = 1/cosθs, and the solar zenith angle can be calculated from Julian date, latitude and time of the day.
In the simulations, only photosynthetically active radiation (PAR) was considered, and the amount of PAR available at the top of the atmosphere was given the value S0 = 600 W m−2 (Weiss and Norman 1985). Simulations were performed at two latitudes, 43.45° N and 63.45° N, and the time period (T) considered (the growing season) was taken as April 1 to Octo-ber 31 and May 1 to SeptemOcto-ber 30 at each latitude,
respec-Table 1. Measured values of STAR of different conifer species.
Species STAR
_____
STARmax STARmin Source
Mean ± SD Range
Pinus sylvestris 0.142 ± 0.023 (0.09--0.21) 0.16 0.11 Oker-Blom and Smolander 1988
Pinus sylvestris 0.135 ± 0.033 (0.09--0.26) 0.17 0.08 Smolander et al. 1994
Pinus sylvestris 0.163 ± 0.049 (0.08--0.31) 0.17 0.08 Smolander et al. 1994
Pinus contorta 0.116 (0.07--0.20) Oker-Blom et al. 1991
Picea abies 0.161 ± 0.020* (0.11--0.27) 0.21 0.09 Stenberg et al. 1995
0.216 ± 0.020* (0.16--0.36) 0.29 0.11 Stenberg et al. 1995
Picea engelmannii 0.12 (sun shoot) Carter and Smith 1985
0.18 (shade shoot)
Abies lasiocarpa 0.15 (sun shoot)
0.31 (shade shoot)
Pinus contorta 0.13 (sun shoot)
0.14 (shade shoot)
Sequoia sempervirens 0.31* Leverenz and Hinckley 1990
Abies grandis 0.32*
Pseudotsuga menziesii 0.28*
Abies amabilis 0.28*
Tsuga heterophylla 0.27*
Picea abies 0.27*
Picea orientalis 0.26*
Picea sitchensis 0.24*
Abies procera 0.23*
Abies lasiocarpa 0.21*
Pinus sylvestris 0.17*
Pinus contorta 0.16*
1 * = Values of SPAR or R
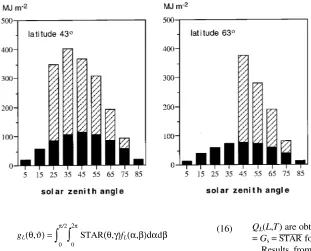
tively. At the chosen latitudes, the minimum solar zenith angle (at the time of the summer solstice) is 20 and 40°, respectively. The momentary irradiance (Equation 11) integrated over time, Q(T), represents the radiant energy received per unit of horizontal area during this time period. During the time of integration, clear sky conditions were represented by instanta-neous transmittance coefficients of τ = 0.7 and τd = 0.271 − 0.294τm (Liu and Jordan 1960, Gates 1980), and overcast days
were represented by diffuse radiation only (τ = 0). The dura-tions of clear and overcast sky condidura-tions were determined based on the average total, direct and diffuse transmittances during the time period. At the more northern latitude, a cloudi-ness index (average total transmittance) of 0.5 during the time period (T) was assumed, i.e., Q(T) was fixed to be equal to 50% of the extraterrestial insolation, Q0(T), received on a horizontal surface outside the atmosphere. The average direct and diffuse transmittances were chosen as 0.3 and 0.2, giving the proportions Qs(T) = 0.6Q(T) and Qd(T) = 0.4Q(T) of direct and diffuse radiation, respectively, for the growing season (Oker-Blom 1986). At the more southern latitude, a somewhat larger fraction of direct radiation was assumed, and the average direct and diffuse transmittances were chosen as 0.35 and 0.20, respectively, giving an average total transmittance (cloudiness index) of 0.55.
The extraterrestial insolation received on a horizontal sur-face outside the atmosphere, Q0(T), was calculated by integrat-ing the extraterrestial irradiance (S0cosθs) over time (T). First, the (potential) direct and diffuse radiation received during the time period, assuming all days to be clear, Qs(T,clear) and Qd(T,clear), were calculated. The proportion (p) of clear days was then solved by Equation 12:
pQs(T,clear)=Qs(T). (12)
The diffuse radiation received during overcast days, Qd(T,overcast), was obtained from Equation 13:
pQd(T,clear) + (1 − p)Qd(T,overcast) = Qd(T). (13)
At both latitudes, the calculated proportions of clear (p) and overcast days (1 − p) were about 63 and 37%, respectively.
The angular intensity distribution of incoming total (= direct + diffuse) radiation during the time period T [q(θ,T) = qs(θ,T) + qd(θ,T)], defined so that:
Q(T)=
∫
q(θ,T) dθ 0π/2
=
∫
[qs(θ,T)+qd(θ,T)] dθ 0π/2
, (14)
was estimated by assuming a uniform distribution of the dif-fuse component, in which case qd(θ,T) = 2Qd(T)cosθsinθ.
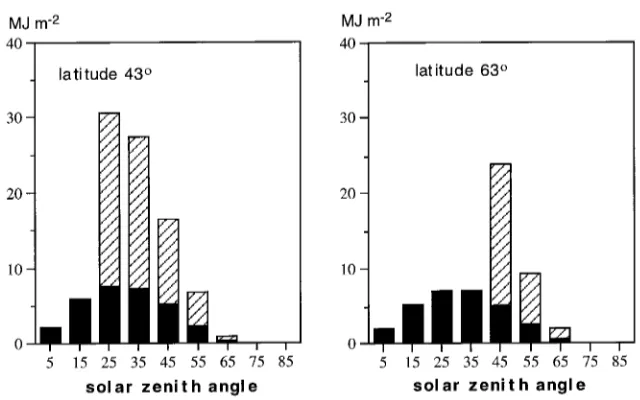
Figure 3 shows the estimated angular distributions of incom-ing (above-canopy) direct and diffuse PAR. Notice that only diffuse radiation is received from zenith angles smaller than 20 and 40° at the southern and northern latitutdes, respectively.
Within-canopy light regime
The penetration of light through the canopy was described by a negative exponential function of L/cosθ, where L is the downward cumulative total needle surface area per unit of ground area. Two models were applied. In Model 1, only the grouping of needles on shoots was considered (i.e., shoots were assumed to be the most important clumping elements in the stand). The extinction coefficient (Gs) is then equal to the mean ratio (STAR) of projected (light intercepting) area to total needle area of the shoots located along the path of the solar beam (Stenberg et al. 1993, Stenberg et al. 1994):
Gs(L,θ,ϑ)=1
L
∫
∫
∫
0 STAR(θ,γ)fL(α,β)dαdβdL2π
0
π/2
0
L
=1
L
∫
0gL(θ,ϑ)dLL
, (15)
where fL(α,β) denotes the probability density function of the
direction (α,β) of shoots located at the depth L in the canopy, and
Figure 2. Measured and modeled values of the shape factor for a sun shoot and a shade shoot. The shape coefficients (a, b and c) were estimated based on measured
STAR
_____
, STARmax and STARmin in
gL(θ,ϑ)=
∫ ∫
STAR(θ,γ)fL(α,β)dαdβ0 2π
0
π/2 (16)
represents the mean STAR in the direction (θ,ϑ).
The angles φ and γ in Equations 15 and 16 depend on the shoot direction (α,β) and solar (view) direction (θ,ϑ) accord-ing to Equations 1 and 2. In all simulations, the azimuth (β) of the shoot axis was assumed to be uniformly distributed over (0,2π), implying that Gs(L,θ,ϑ) = Gs(L,θ) and gL(θ,ϑ) = gL(θ)
are independent of the azimuth (ϑ).
The penetrated radiation, Q(L,T), i.e., the amount of radia-tion received on a horizontal plane at depth L in the canopy, during the time period T is then given by:
Q(L,T)=
∫
q(θ,T) expThe difference between incoming and penetrated (lost) radia-tion, Qabs = Q(T) − Q(L,T), represents the radiation absorbed by the canopy above L.
The seasonal rate of light interception, QL, was defined as
the derivative of Qabs with respect to L and represents the amount of intercepted radiation per unit of leaf area in the shoot layer at depth L during the growing season (T). Because, by definition, dGs(L,θ)L/dL = gL(θ) (Equation 15), the
deriva-The seasonal rate of light interception (QL) as a function of
shading leaf area (L) was first simulated assuming that shoots in all layers had, on average, the same STAR_____, and were ran-domly distributed and spherically oriented (the standard simu-lation). For a spherical shoot orientation (fL(α,β) =
(1/2π)sinα), Gs and gL are independent of the view direction
Results from the standard simulation were compared to simulations considering two responses to shading: an increase in STAR_____, and changes in shoot zenith angle and directional variation (shape coefficients) of STAR. In addition, by Model 2 the effect of additional grouping (other than the clumping of needles on the shoot) was taken into account by multiplying the extinction coefficient (Gs) by a crown clumping factor, CCF, which was assumed to increase with solar zenith angle (Oker-Blom et al. 1991). In Model 2, Equations 15--18 remain formally similar, but values of Gs and gLdecrease by the factor
CCF (< 1).
Results
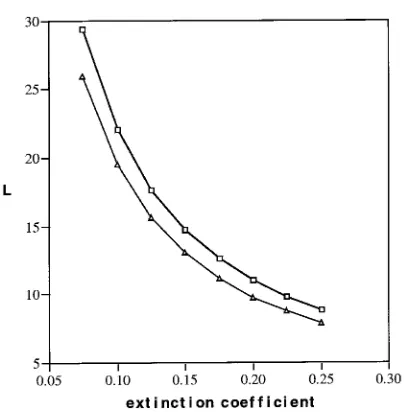
At a fixed L, the penetrated radiation Q(L,T) (Equation 17) was smaller the larger the extinction coefficient (Gs, which is equal to STAR_____ in the standard run). Consequently, the fraction of absorbed PAR by the canopy increased with STAR_____. Combina-tions of L and the extinction coefficient, for which the canopy intercepts 95% of the incoming radiation (Qabs = 0.95Q(T)), are shown in Figure 4. At a fixed L and STAR_____, the relative absorption was higher at the more northern latitude because a larger fraction of light came from angles closer to the horizon (Figure 3), where light extinction is more effective (Equation 17).
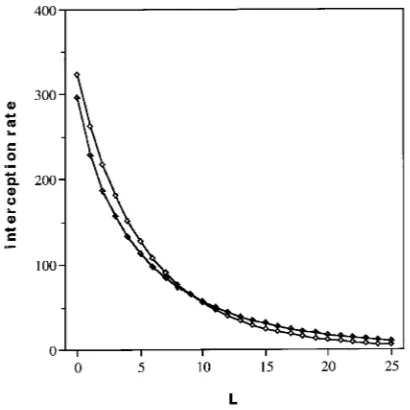
The seasonal interception rates (QL) as a function of L for
STAR _____
= 0.1 and STAR_____ = 0.25 (standard run) are shown in Figure 5. At a fixed L, total light absorption (the area under the curve) was always higher the larger the STAR_____. However, at large values of L the difference became minor, i.e., relative absorption was close to one irrespective of the extinction coefficient (see Figure 4). A small STAR_____ implied that QLwas
smaller in the upper canopy, but decreased less rapidly with L. Consequently, after some value of L (L ≈4 in Figure 5) the seasonal interception rate (QL) became higher the smaller the
STAR _____
. Assuming that there exists a critical value of QL below
which net photosynthesis becomes negative, the leaf area op-erating above that critical value (the productive leaf area) is larger for the smaller value of STAR_____. The tentative critical level depicted in Figure 5 corresponds to 5% of the reference value of QLat L = 0 and STAR
_____
= 0.25, which represents the interception rate of a spherical surface at the top of the canopy.
Effect of increased STAR_____
In Figure 6, shoots were assumed to be spherically oriented, but mean STAR_____ increased from 0.1 to 0.25 with the degree of shading. The degree of shading (DS) was defined as the ratio of radiation absorbed by the canopy (Qabs ) to the total radiation incident on a horizontal surface above the canopy (Q(T)). The increase in STAR_____ was modeled in two ways: (a) as a linear function of the degree of shading, i.e., STAR_____ = 0.1 + 0.15(DS), and (b) as a quadratic function of the degree of shading exceed-ing 50%, i.e., STAR_____ = 0.1 for DS ≤ 0.5 and STAR_____ = 0.1 + 0.15((DS − 0.5)/0.5)2 when DS > 0.5.
The increase in STAR_____ first resulted in an increase in the interception rate (QL), but later, because of more effective
Figure 4. Combinations of leaf area index (L, total leaf area basis) and extinction coefficient, for which the canopy absorbs 95% of the in-coming PAR; h = latitude 43.45° N, and n = latitude 63.45° N.
Figure 5. The seasonal light inter-ception rate (QL, MJ m−2) as a
function of L for STAR
_____
= 0.1 (h) and STAR
_____
= 0.25 (d).
Figure 6. The seasonal light inter-ception rate (QL) as a function of
L when STAR
_____
increases from 0.1 to 0.25: (a) as a linear function of the degree of shading (e), and (b)
as a quadratic function of the de-gree of shading exceeding 50% (s). The curve obtained in the
standard run with STAR
_____
absorption and the consequent decrease in available light, QL
became smaller despite the larger value of STAR_____. The sooner STAR
_____
started to increase, the smaller was the value of L at which the positive effect of this increase on QL disappeared.
Effect of shoot zenith angle and shape coefficients
Figure 7 shows mean values of the shape factor (relative interceptance) for the modeled sun shoot and shade shoot (see Figure 2), as a function of the solar zenith angle. The curves represent shoots with different zenith angles (α = 0, 30, 60 and 90°), and values are averaged over the azimuth (β) (assumed to be uniformly distributed). Note that the shape factor varies with solar (view) and shoot angles, but is normalized by STAR
_____
(see Equation 4). The spherical mean of the shape factor is always equal to 1.
Variation in the relative interceptance was small for solar zenith angles between 40 and 60° (Figure 7), suggesting that the effect of shoot zenith angle on light absorption would be minor at latitude 63.45° N, where the main part of radiation comes from these angles (see Figure 3). At latitude 43.45° N much of the radiation comes from solar zenith angles smaller than 40°, at which variation in relative interceptance with shoot zenith angle is larger (Figure 7). However, differences in the seasonal interception rate (QL) were small even for the extreme
cases of a canopy composed of horizontally inclined shade shoots, or vertically inclined sun shoots (Figure 8). (Note that because the aim was to study the effect of shoot angle and shape coefficients, STAR_____ of sun and shade shoots was assumed to be the same.)
The relative seasonal interception by a shoot (Table 2) was obtained by averaging the shape factor with respect to the angular distribution of light incident on the shoot during the growing season (T). It represents the light interception by a shoot in its real (simulated) radiation environment relative to the spherical mean (e.g., light interception of the same shoot in an isotropic radiation field). In the open, the relative seasonal interception was similar for the shade shoot and the sun shoot, and was not sensitive to the shoot zenith angle (Table 2). This implies that, for a fixed value of STAR_____, neither the shape nor the angle of an unshaded shoot significantly affected its rate of
light interception. With increasing shade (depth in the canopy), the directional distribution of incident light was shifted toward smaller zenith angles (Figure 9) and, therefore, a horizontally inclined shoot with a large STARmax becomes relatively more efficient deeper down in the canopy. At the 95% level of shading, the relative absorption by a horizontal shade shoot was 20% (latitude 43.45° N) and 14% (latitude 63.45° N) higher than the reference (spherical mean), and 43% (latitude 43.45° N) and 25% (latitude 63.45° N) higher than that of a vertically inclined sun shoot (Table 2).
Combined effects of shoot plasticity and grouping in crowns
The effect of grouping into crowns was considered by multi-plying the extinction coefficient by the crown clumping factor, CCF, which was given the value of 0.5 at θ = 0°and increased linearly with solar zenith angle, being equal to 1 at θ = 90°.
The combined effects of grouping into crowns and changes in STAR_____, shoot zenith angle, and shape coefficients a and b are
Figure 8. Seasonal rates of light interception in a canopy of (a) vertically inclined sun shoots (r), and (b) horizontally inclined shade
shoots (e).
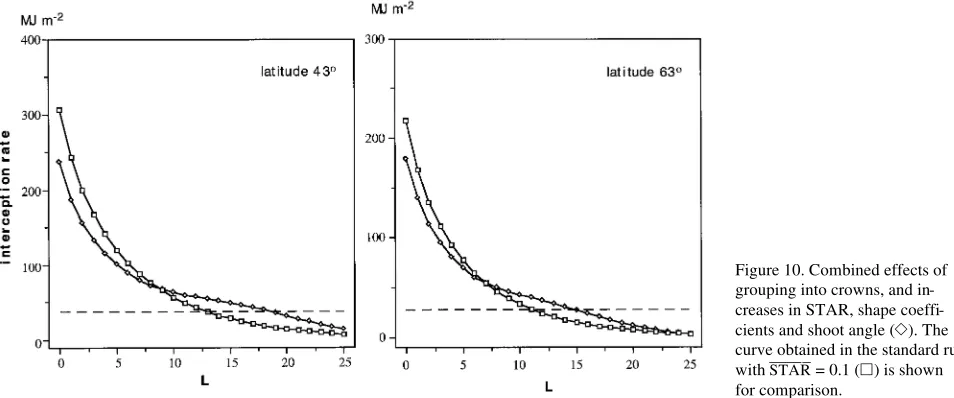
shown in Figure 10. Increases in STAR_____ (from 0.1 to 0.25), shoot zenith angle (from 30 to 90°), and shape coefficients a (from 0.45 to 0.58) and b (from 0.7 to 0.87) (note that increased a and b implies a larger STARmax /STAR
_____
(Equation 6)) were modeled as a quadratic function of the degree of shading (DS) exceeding 50%. Because grouping results in a smaller extinc-tion coefficient (less shading at a given L), the value of L where QL started to increase was higher than in the case where
grouping into crowns was not considered (Figure 6). In addi-tion, the total depth of the layers where a higher QLcan be
maintained was larger.
Discussion
Because total light absorption as a function of the leaf area index (L) becomes saturated at moderate values of L (Fig-ure 4), excessive leaf area does not appreciably increase the amount of energy captured by a tree canopy. The rate of photosynthesis is known to be a concave function of irradi-ance, and this implies that total photosynthesis at a fixed amount of absorbed light is maximized when the leaf surface area is illuminated as evenly as possible. In terms of photosyn-thesis, the potential advantage of carrying a large leaf area is
associated with a canopy structure (leaf display) that makes the distribution of light on the leaf surface area more even. In particular, because there cannot exist a structure that would produce a constant interception rate (QL) throughout the
can-opy, a ‘‘suboptimal’’ strategy would be to maximize the (time integrated) leaf area operating below saturation, but above the light compensation point.
Light absorption by a shoot can be seen as the product of available light and the efficiency with which it is captured by the shoot. Consequently, a small STAR_____ in the upper canopy, where light is abundant, and a gradual increase in STAR_____ with increased shading makes the vertical gradient in light absorp-tion more even (Figures 5 and 6). However, as soon as the light interception efficiency (STAR_____) of the shoots starts to increase, the available (penetrated) light decreases more rapidly and, as a result, there comes a point where this strategy can no longer increase the interception rate (QL). Therefore, the leaf area
operating above some specified threshold (e.g., the light com-pensation point) is larger if the increase in STAR_____ does not occur before the degree of shading becomes critical (Figure 6). Because grouping results in a smaller extinction coefficient (less shading at a given L), the value of L where QLstarts to
increase was higher in the case where grouping into crowns
Table 2. Relative seasonal interception of PAR by a sun shoot and a shade shoot as a function of shoot zenith angle.
Relative seasonal interception
Upper canopy (0% shade) Lower canopy (95% shade)
Latitude 43.45° N
Shoot angle (α) 0° 30° 60° 90° 0° 30° 60° 90o
Sun shoot 0.97 0.97 1.00 1.02 0.84 0.89 1.02 1.08
Shade shoot 0.98 0.98 1.03 1.06 0.88 1.95 1.12 1.20
Latitude 63.45° N
Shoot angle (α) 0° 30° 60° 90° 0° 30° 60° 90°
Sun shoot 1.02 1.01 1.00 1.00 0.91 0.94 1.01 1.06
Shade shoot 1.01 1.00 0.99 1.00 0.93 0.97 1.07 1.14
was considered (Figure 10). Also, the total depth of the layers where a higher QLcould be maintained was larger.
In the simulations, an increase in the shoot zenith angle and shoot asymmetry (flatness) enhanced the light interception rate of more severely shaded shoots in the lower canopy (Table 2), where light comes from angles closer to the zenith (Figures 7 and 9). The effect of these factors (increased shoot zenith angle and flatness) on light absorption (QL) was not large (Figure 8);
however, another aspect of the typical shade shoot structure might be important.
In the lower canopy, the spatial distribution of radiation is fairly even. This is more generally true for diffuse radiation, but deeper down in the canopy it applies also to direct solar radiation, because of strong penumbral effects (Stenberg 1995). I conclude, therefore, that the available light is fairly evenly distributed (varying temporally but not spatially) among shoots in the lower canopy. However, the distribution of light among needles on the same shoot may not be even. This is because the needles are situated close together and so a single needle can obscure a large part of sky for another needle, throughout the day or the whole season (Leverenz and Hinck-ley 1990). The only way for a shoot to prevent this from happening would be to have parallel and horizontally inclined needles. Thus the flat shoot structure in combination with a horizontal shoot inclination is an effective way to minimize differences in light interception by needles on the same shoot. Consequently, such a shoot would be able to survive longer in shade and be more productive than a shoot in the same light conditions, but with an uneven distribution of light on its needle surface.
All of the adaptive strategies analyzed in this study----an increase in the STAR, shoot zenith angle, and shoot asymme-try----were shown to be reasonable responses to shading under the assumptions used in the analyses. That is, they all tended to increase the efficiency of light interception by a shoot. I conclude that the ideal shade shoot is flat, horizontally in-clined, and subject to little within-shoot shading (large STAR_____). In theory, a large STAR (STAR_____) is not necessarily associated
with shoot flatness (i.e., a cylindrical, brush-like shoot may have a large STAR); however, this combination may provide an extra advantage because it minimizes differences in light interception by needles on the same shoot. The same argument was used by Leverenz and Hinckley (1990) to explain their finding that high leaf area index and high productivity were found in species with shade-acclimated shoots of large STARmax .
The capacity to produce shoots that are efficient in deep shade is a prerequisite for maintaining a high leaf area index. However, the competition for light among shoots increases progressively as soon as shade-acclimation starts to occur. As a result, there cannot exist a very deep layer of shade shoots, such that the net productivity of each shoot remains positive (i.e., irradiance is above the compensation point). Because grouping into crowns implies a slower rate of light extinction, shade-acclimation started later (at higher values of L) and the number of layers where a higher rate of light interception could be maintained was larger in the grouped stands (Figures 6 and 10). I conclude that, if maximization of the productive leaf area is the goal, the optimal strategy would be to maintain an inefficient canopy and only increase the light interception efficiency when the shading becomes severe.
References
Carter, G.A. and W.K. Smith. 1985. Influence of shoot structure on light interception and photosynthesis in conifers. Plant Physiol. 79:1038--1043.
Gates, D.M. 1980. Biophysical ecology. Springer-Verlag, New York, 611 p.
Lang, A.R.G. 1991. Application of some of Cauchy’s theorems to estimation of surface areas of leaves, needles and branches of plants, and light transmittance. Agric. For. Meteorol. 55:191--212. Leverenz, J.W. and T.M. Hinckley. 1990. Shoot structure, leaf area
index and productivity of evergreen conifer stands. Tree Physiol. 6:135--149.
Liu, B.Y. and R.C. Jordan. 1960. The interrelationship and charac-teristic distribution of direct, diffuse, and total solar radiation. Sol. Energy 4:1--19.
Figure 10. Combined effects of grouping into crowns, and in-creases in STAR, shape coeffi-cients and shoot angle (e). The curve obtained in the standard run with STAR
_____
= 0.1 (h) is shown
Oker-Blom, P. 1986. Photosynthetic radiation regime and canopy structure in modeled forest stands. Acta For. Fenn. 197:1--44. Oker-Blom, P. and H. Smolander. 1988. The ratio of shoot silhouette
area to total needle area in Scots pine. For. Sci. 34:894--906. Oker-Blom, P., M.R. Kaufmann and M.G. Ryan. 1991. Performance
of a canopy light interception model for conifer shoots, trees and stands. Tree Physiol. 9:227--243.
Smolander, H., P. Stenberg and S. Linder. 1994. Dependence of light interception efficiency of Scots pine shoots on structural parame-ters. Tree Physiol. 14:971--980.
Sorrensen-Cothern, K.A., E.D. Ford and D.G. Sprugel. 1993. A model of competition incorporating plasticity through modular foliage and crown development. Ecol. Monogr. 63:277--304.
Sprugel, D.G. 1989. The relationship of evergreenness, crown archi-tecture, and leaf size. Am. Nat. 133:465--479.
Stenberg, P., H. Smolander and S. Kellomäki. 1993. Description of crown structure for light interception models: angular and spatial distribution of shoots in young Scots pine. Stud. For. Suec. 191:43--50.
Stenberg, P., S. Linder, H. Smolander and J. Flower-Ellis. 1994. Performance of the LAI-2000 plant canopy analyzer in estimating leaf area index of some Scots pine stands. Tree Physiol. 14:981--995.
Stenberg, P., S. Linder and H. Smolander. 1995. Variation in the ratio of shoot silhouette area to needle area in fertilized and nonfertilized Norway spruce trees. Tree Physiol. 15:705--712.
Tucker, G.F., T.M. Hinckley, J.W. Leverenz and S. Jiang. 1987. Adjust-ments of foliar morphology in the acclimation of understory Pacific silver fir following clearcutting. For. Ecol. Manage. 21:249--268. Weiss, A. and J.M. Norman. 1985. Partitioning solar radiation into