Evaluation of Lagergren Kinetics Equation by Using Novel Kinetics Expression
of Sorption of Zn
2+onto Horse Dung Humic Acid (HD-HA)
Bambang Rusdiarso
*, Rahmat Basuki, and Sri Juari Santosa
Department of Chemistry, Faculty of Mathematics and Natural Sciences, Universitas Gadjah Mada Sekip Utara PO BOX BLS 21 Yogyakarta 55281, Indonesia
Received February 12, 2016; Accepted June 9, 2016
ABSTRACT
Extraction and purification of humic acid from dry horse dung powder (HD-HA) was performed successfully and the purified HD-HA was then applied as sorbent to adsorb Zn2+. Extraction and purification were performed based on procedure of Stevenson (1994) under atmospheric air. Parameters investigated in this work consist of effect of medium sorption acidity, sorption rate (ka) and desorption rate constant (kd), Langmuir (monolayer) and Freundlich
(multilayer) sorption capacities, and energy (E) of sorption. The ka and kdwere determined according to the kinetic
model of second order sorption reaching equilibrium, monolayer sorption capacity (b) and energy (E) were determined according to Langmuir isotherm model, and multilayer sorption capacity (B) was determined based on Freundlich isotherm model. Sorption of Zn2+ on purified HD-HA was maximum at pH 5.0. The novel kinetic expression resulted from proposed kinetic model has been shown to be more applicable than the commonly known Lagergren equation obtained from the pseudo-first order sorption model. The application of the equation revealed that the intercept of Lagergren equation, ln qe was more complex function of initial concentration of Zn
2+
(a), Langmuir sorption capacity (b), and sorbed Zn2+at equilibrium (xe).
Keywords:Lagergren kinetics equation; novel kinetics expression; sorption; Zn2+; horse dung humic acid (HD-HA)
ABSTRAK
Ekstraksi dan pemurnian asam humat dari serbuk tinja kuda kering (HD-HA) telah dilakukan dengan baik dan HD-HA yang telah dimurnikan kemudian digunakan sebagai adsorben untuk mengadsorpsi Zn2+. Ekstraksi dan pemurnian dilakukan berdasarkan prosedur Stevenson (1994) di bawah atmosfer udara. Parameter-parameter yang diamati dari penelitian ini terdiri dari pengaruh medium keasaman adsorpsi, tetapan laju adsorpsi (ka) dan tetapan
laju desorpsi (kd), kapasitas adsorpsi Langmuir (lapis tunggal) dan Freundlich (lapis banyak) dan energi adsorpsi (E).
Nilai kadan kdditentukan menurut model kinetika orde dua ketika adsorpsi mencapai kesetimbangan. Nilai kapasitas
adsorpsi lapis tunggal Langmuir dan lapis banyak Freundlich ditentukan berdasarkan model isoterm Langmuir dan Freundlich. Adsorpsi Zn2+ pada HD-HA yang telah dimurnikan berlangsung maksimal pada pH 5,0. Persamaan kinetika baru yang diusulkan menunjukkan bahwa persamaan ini lebih aplikatif daripada persamaan pseudo orde satu Lagergren. Penerapan persamaan ini pada adsorpsi mengungkap bahwa intersep dari persaman garis Lagergren, ln qemerupakan fungsi yang lebih kompleks dari konsentrasi awal Zn
2+
(a), kapasitas adsorpsi Langmuir (b) dan Zn2+teradsorpsi pada kesetimbangan (xe).
Kata Kunci:persamaan kinetika Lagergren; persamaan kinetika baru; sorpsi; Zn2+; asam humat tinja kuda (HD-HA)
INTRODUCTION
The levels of metals on waters have been seriously increased during the last few decades due to human activities [1]. Several methods have been developed to reduce metal in waste, such as adsorption, electrolysis, dialysis, complexation, ion exchange, solvent extraction, and some kind of membrane separation techniques [2-10]. Adsorption still become preferred method for reducing heavy metal in aquatic environment because it is simple and gives satisfactory result [11]. Many efforts done by experts today are looking for new sources of
of peat land potentially releases stored carbon in the soil, so it can contribute to increasing the greenhouse effect [28]. One source of humic acid that has been reported is cow dung. Cow dung can be a source of humic acid which is greener, cheap, and still have good sorption ability [29-31].
Based on this report, it is possible that other animal’s dung, like a horse that has texture and properties similar to cow dung can also be used as a source of humic acid. Horse dung has a denser and rough texture from cow dung, so it is rarely used for biogas and organic fertilizer. The existence of horse dung often cause bad affect for environment because the dung is scattered so it cause smell and the appearance of nuisance animals that come from the dung. If the horse dung can be a source of humic acid, its treatment not only solves the environmental problems caused by waste horse dung, but also it’s giving advantage in waste heavy metal handling in the environments. Based on the green properties of horse dung compared to peat as a source of humic acid, it is interesting to extract and study the kinetics and thermodynamics sorption of horse dung humic acid to adsorb Zn2+metal ions.
The study of kinetic sorption was according to developed kinetics model based on an approach that sorption is a dynamic equilibrium process and during mathematical derivation the availability of binding sites of sorbent. The applicability of the developed sorption kinetic model is then tested for the sorption of Zn2+, where their distribution in soil and water has been known to be strongly associated with the presence of humic substance [32]. The evaluation is carried out for the determination of ka of the sorption of Zn
2+
on HD-HA. The sorption kinetic model is also evaluated for Lagergren kinetic model [33-37], especially the value of its intercept (ln qe) often found not equal between ln qe from Lagergren equation and value of ln qe from experiment [38]. Furthermore, comparison of developed kinetics model to the most widely used Lagergren pseudo first-order also critically discussed.
EXPERIMENTAL SECTION
Materials
All reagent are analytical grade i.e. NaOH, HCl, HF, AgNO3, Ba(OH)2, Ca(CH3COO)2.H2O, Cd(CH3COO)2.2H2O, Zn(CH3COO)2.2H2O from Merck Co. Inc (Germany) and used without further purification. Humic acid is extracted from horse dung dried for ± 3 months from Saddle horse aged 7 months to 4 years old from Bantul, Special Region of Yogyakarta and peat soil was taken from Musi Banyuasin, South Sumatra as comparator. Extraction was performed according to the
procedure of Stevenson [39] under atmospheric air. Purification was done by HCl/HF method [39].
Instrumentation
These work used Hanna Instrument Portable pH Meter, magnetic stirrer, glassware, and Jena ContrAA 300 Atomic Absorption Spectroscopy (AAS) to analyze total metal ions in sample. The characterization of horse dung humic acid (HD-HA) and peat soil humic acid (PS-HA) was performed by Shimadzu FTIR Prestige 21 and UV-visible spectrophotometer (GBC Cintra 2020).
Procedure
Effect of medium acidity
At first, a series of 50 mL of Zn(II) was prepared and their acidity was adjusted to 2.0, 3.0, 4.0, 5.0, and 6.0 by adding HCl solution. Into every Zn(II) solution, 10 mg of purified HD-HA was poured and then stirred for 2 h. After filtering through 100 mesh membrane filter, the concentration of Zn(II) in supernatant was analyzed by using AAS. Sample and blank solutions were analyzed under same conditions. The amount of sorbed Zn2+ was considered to be the difference between the initial and the remaining amount in the reacting solution each time a sample was analyzed.
AAS is a specific for elemental analysis, especially for metals. Its main components consist of a light source, atomization unit, a prism to disperse and isolate the emission lines, and a detector with appropriate amplifiers [40]. The light source with wavelength readily absorbed by the element to be determined is directed through the atomization unit, which maybe either flame or flameless apparatus. A measure of intensity is made without the sample and then with the sample introduced into the atomization unit. The decrease in intensity observed with the sample is a measure of the concentration of the element.
Sorption capacity and energy
analyzed using Freundlich and Langmuir isotherm models.
Sorption kinetics
The kinetics experiments also were carried out using a batch type reactor using 50 mL Erlenmeyer in a water bath at 25 ± 0.01 °C. The volume of sorption medium was 50 mL, the initial metal ion concentration was 50, 200, and 400 mg/L, the acidity was adjusted at pH 5.0; and to each solutions, 10 mg of sorbent was added and then stirred continuously. At selected interaction time, the sample was immediately filtered through 100 mesh filter and the concentration of Zn2+in the supernatant was analyzed by using AAS. Sample and blank solutions were analyzed under the same conditions. The amount of Zn2+ sorbed was considered to be difference between the initial and the remaining amount in the reacting solution each time a sample was analyzed. The data obtained was then analyzed by two different sorption kinetics models, i.e. Lagergren pseudo-first order and the proposed kinetics expression here.
RESULT AND DISCUSSION
Characterization of HD-HA
Horse dung humic acid (HD-HA) has the physical appearance and texture similar with peat soil humic acid (PS-HA), which was dark brown. UV-Vis characteristic spectra of humic acid do not indicate a maximum or a minimum peak clear where the highest absorbance in the UV region, then decreases with increasing wavelength. These results were similar to studies conducted by Stevenson [39] and Agarwal, et al. [41]. The high absorbance in the region 250-300 nm was characteristic of aromatic group or unsaturated compound which is a chromophore group of double bonds (C=C, C=O, and C=N) (Fig. 1). It was also showed a high concentration of aromatic compounds and humification degree of humic acid [42]. UV-Vis spectra of humic compounds are widely used to determine the molecular properties of humic compounds [43]. There are three important areas where absorbance must be measured, i.e. about 280 nm, 400-500 nm and above 600 nm. Absorbance ratio can be calculated on the A280/A472= Q2/4, A280/A664= Q2/6, and A472/A664= Q4/6. Based on this ratio, degree of maturity (humification) of organic matter can be determined. Q2/4 shows the proportion of lignin and other materials at the beginning of the process of humification [44], Q2/6 indicate the proportion between material humificated and unhumificated. The low value of Q2/6and Q4/6showed a high degree of aromatic and degree of humification of organic material [45]. Q4/6was used to measure degree of condensation and polymerization of aromatic compounds
Fig 1. UV-VIS spectra of HD-HA compared to PS-HA shows the similar pattern and give the characteristics pattern of humic acid
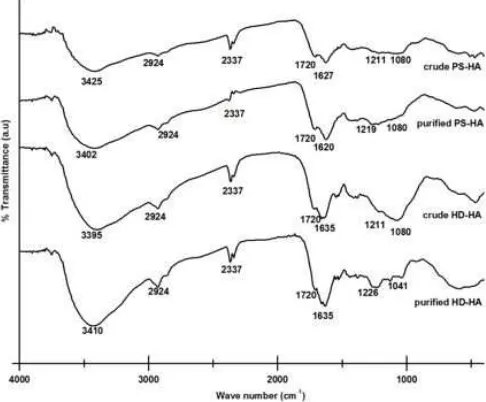
Fig 2. FT-IR spectra of crude and purified HD-HA compared to crude and purified PS-HA shows the similar peaks and gives the characteristics peaks of humic acid
and can serve as humification index [46]. The ratio of Q2/4, Q2/6, and Q4/6of peat soil humic acid (PS-HA) and HD-HA were 34.99; 5.60; 6.25 and 41.94; 6.28; 6.68, respectively. Ratio Q4/6for humic acid is <5, while fulvic acid is between 6 and 8.5 [39]. HD-HA has a ratio Q4/6 close to 5 which shows the characteristics of the humificated material but not perfect. While the HD-HA has a ratio Q4/6in the area of fulvic acid is 6.275. This indicates that HD-HA has not been humificated perfectly. These results are consistent with the fact that the horse dung has been used in this research only about 3 months old at depths less than 50 cm in the open areas.
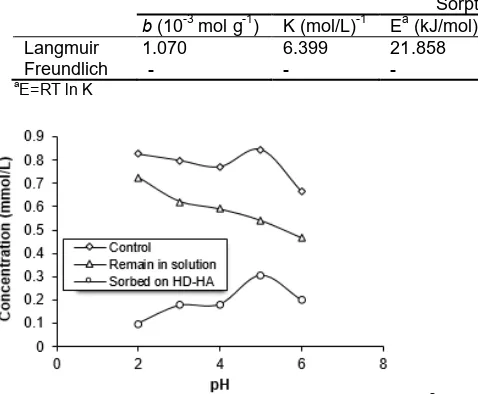
[image:3.595.322.559.118.246.2] [image:3.595.319.562.300.501.2]Table 1.Sorption capacity (b), energy (E), and constant of equilibrium (K) obtained from Langmuir isotherm as well as sorption capacity (B) obtained from Freundlich isotherm for the sorption of Zn2+
Sorption parameters
b(10-3mol g-1) K (mol/L)-1 Ea(kJ/mol) R2 B (10-2mol g-1) n R2
Langmuir 1.070 6.399 21.858 0.992 - -
-Freundlich - - - - 6.912 1.827 0.983
aE=RT ln K
Fig 3.Effect of medium acidity on the distribution of Zn2+ in the presence of HD-HA
have characteristics peak of humic acid [39]. Humic acid usually give a wide absorption band in 3300-3400 cm-1 which indicate H-bonds of O-H group (Fig. 2). Absorption at 2940-2900 cm-1region indicates the stretching of C-H aliphatic. Absorption at 1725-1720 cm-1 region indicate C=O stretching -COOH. In a certain cases, it was found a new peak at 1550 and 1400 cm-1 which indicate carboxylate ion absorption (COO-). This evidence shows that the C=O group at humic acid still interact with something like metal-clay because it has not been purified. Small peak at 1720 cm-1 is an open chain ketone or residual aldehyde, as was the case in this study. Sharp peak was also often found in the area in 2330 which is the C=O stretching vibration of CO2 trapped in the matrix KBr from decarboxylation results of COOH groups. Absorption at 1625-1620 cm-1 region indicate C=C aromatic and aromatic rings formed by hydrogen bonding OH group and C=O groups quinones. Peak in the region 1280-1200 cm-1indicate O-H bending and C-O stretching from COOH. The fifth area of this absorption (3400, 2900, 1720, 1600, and 1200 cm-1) is characteristic for humic acid [39].
Purification process aims to eliminate inorganic impurities such as clay minerals and silicates [39]. The yield of ash level for crude PS-HA, purified PS-HA, crude HD-HA, and purified HD-HA were 7.31; 1.2; 15.66 and 0.99 (% w/w), respectively. The successfulness of purification process was indicated by the results of ash level of PS-HA and HD-HA after purification process was lower than before purification process. This result confirmed by decreasing absorption of FT-IR spectra in a finger print region of silica-alumina (1080 cm-1). The
successfulness of purification process was also indicated by increasing in total acidity. Total acidity in this work was determined by Barium Hydroxide (Baryta Absorption) Method [39]. Total acidity of crude HD-HA and purified HD-HA were 400.6 and 415.3 cmol/kg, respectively. FT-IR spectra before and after purification process showed a significant differences in the functional groups of humic acid. After purification there is an increase in the intensity of the main absorption of humic acid functional group which explains the presence of these groups in the sample. The group which was increase in the intensity was O-H absorption at wave number 3400 cm-1and C-O absorption at wave number 1226 cm-1 in purified HD-HA. Changes in the FT-IR spectra, ash level, and total of acidity show that purified HD-HA has fewer impurities.
Effect of Medium Acidity
The acidity of the sorption medium greatly affects of the amount sorbed Zn2+ (Fig. 3). In the absence of sorbent, nearly all Zn2+ existed in the soluble form at
pH ≤ 5.0 and began precipitated at pH > 6.0
(theoretical pH of Zn2+ began precipitated was ≥ 8.5 [47]. In the presence of sorbent, the sorption of Zn2+ increased with increasing pH from 2 to 5. From pH 8 to lower acidity the sorption significantly decreased. The increase of sorption from pH 2 to 5 may be caused by the decrease of the amount of H+ in the medium, therefore, the competition between H+ and Zn2+ in occupying the active site on the sorbent also decreased. At pH higher than 5, the sorption compete with the precipitation (form Zn(OH)2) and other species has been formed (Zn(OH)+) [48]. As a result, the maximum sorption of Zn2+occurred just at the medium acidity in which has not been formed other species of Zn(II) and in which Zn2+started precipitating.
Sorption Capacity and Energy
[image:4.595.78.317.141.338.2]Fig 4.Freundlich isotherm sorption of Zn2+onto HD-HA Fig 5.Langmuir isotherm sorption of Zn 2+
onto HD-HA
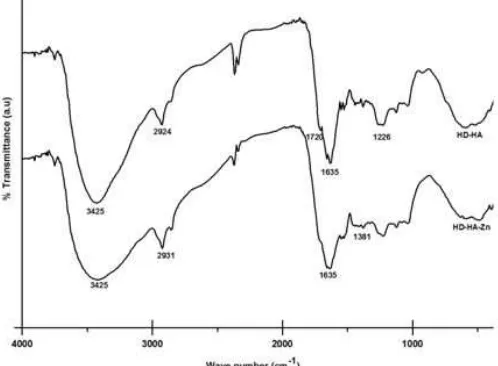
Fig 6. FT-IR spectra of HD-HA before and after sorbing Zn2+sorption
sorbed per gram sorbent at equilibrium; B, Freundlich isotherm capacity and n, constants.
If it is assumed that sorption follows the Langmuir isotherm model, the sorption capacity (b) and constant of equilibrium (K) can be calculated respectively from the slope and intercept of plot between C/m and C. If it is assumed that sorption follows the Freundlich isotherm model, the sorption capacity (B) can be obtained from the intercept of plot between ln m versus ln C. The application of the two models was resulted the sorption parameters shown in Table 1. Compared to the Freundlich model (Fig. 4), the experimental data appeared to match better in Langmuir isotherm model (Fig. 5). The plot of Langmuir model yielded better linearity (R2 = 0.992) than Freundlich model (R2 = 0.983). The sorption capacity of HD-HA for Zn2+
obtained in this study i.e., 1.070 × 10⁻³ mol g-1, or equivalent to 69.978 mg g-1.
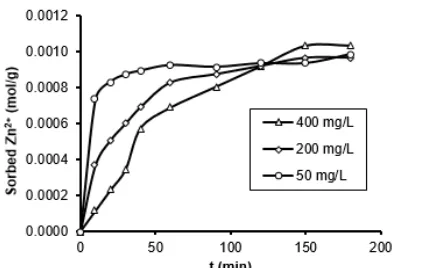
[image:5.595.67.293.110.292.2] [image:5.595.316.559.118.295.2] [image:5.595.50.299.330.513.2]Fig 7. Sorption profile of various concentrations of Zn2+ onto HD-HA as a function of interaction time
Sorption Kinetics
The sorption profile of HD-HA as a function of time interaction is presented in Fig. 7. The sorption of Zn2+ 50 mg/L is initially rapid and then goes slower. The initial rapid sorption was observed for the first 45 min and then goes slower after 60 min. After 120 min, it is relative no additional Zn2+adsorbed on HD-HA, so it can be argued that the sorption has reached equilibrium.
Considering the sorption of Zn2+ on sorbent is an equilibrium process as illustrated bellow:
ka kd
At time, t= 0 a b
A + S
-At time, t = t a-x b-x
A
x *S
whereA is a metal Zn2+;S is an sorbent (HD-HA); ka is the sorption rate constant and kd desorption rate constant.
Ifa is the initial concentration of metal A (mol/L),b
is the Langmuir sorption capacity (mol/L) and x is the number of A is adsorbed on the S (mol/L), so the equation rate can be written:
ads a d
dx
r k a x b x k x
dt
(1)
At equilibrium, dx 0 dt , so
a e e
d
e
k a x b x k
x
(2)
Substituting eq. (2) into eq. (1) yields
a
a e e
e
k dx
k a x b x a x b x
dt x (3)
It can be simplified in a simple form
e
e
aek dx
dt
abx x x x x (4)
At time = 0, sorption has not happen yet so ka is 0 and metal ion of A has not adsorbed on sorbent S, so
x = 0. Taking integration for the eq. (4) with limit (ab) to (ab-xex), 0 to (x), and 0 to t, so eq. (4) can be written
e
ab x x x t
e a
2 ab 2 0 0
e e e
e e
x 1 1 1 k
dx dx dt
ab x x x x x
x ab ab x
(5)Integration of eq. (5) results
2
e e e
a
e e
ab x x x ab x
ln k t
x x ab x
(6)
Rearranged eq. (6) gives
2
e e e
a
e e
ab x x ab x x
ln k t ln
x x x ab
(7)
Or
e
e
2xe a
e
x ab x x ab x
ln x x ln k t
ab x
(8)
The eq. (8) is surprisingly the same as Lagergren equation, ln q
e q
ln q
e k tlag , where qe and xe has the same unit (mol/L). Thus allegedly linearity of eq. (7) will be similar to the linearity Lagergren pseudo-first order. The same plot between eq. (8) with a Lagergren pseudo-first-order model is ln (xe-x) versus t will generate relationships, klag = ka ((ab-xe2
)/xe). If the eq. (8) give a straight line, the intercept ln qe from Lagergren has a value equal to ln (xe(ab-xe
2
))/ab) and answered questions of Aharoni and Sparks [38] why the parameterln qealways have different values withln
qeobtained from experimental data.
Lagergren kinetics equation assume that sorbat concentration (a) is in excess rather than adsorption capacity (b), so from eq. (1) if a assumed to be in excess, ax a,
x
a, eq. (1) can be rewritten:
'
a d
dx
k a b x k x
dt (9)
At equilibrium dx 0 dt , so
'
a e
d
e
k a b x k
x
(10)
Substituting eq. (10) into eq. (9) yields
' a e e e k dxb x x b x x
dt x (11)
It can be simplified to be a simple form
' a e e k ab dx dtx x x (12)
At time = 0, sorption has not happen yet so kais 0 and metal ion of A has not adsorbed on sorbent S, so
x = 0. Taking integration for the eq. (12) with limit 0 to (x), and 0 tot, so eq. (12) can be written
' X t a 0 0 e e k ab dx dt x x x
(13)Integration results and rearranged gives
'e e a
e
ab ln x x ln x k t
x
(14)
If assumption a»bis right, value of '
a
[image:6.595.75.287.112.246.2]Fig 8.Plotln (xe-x)vs.torln (qe-qt)vstfrom Lagergren kinetics equation at various concentrations of Zn2+ onto HD-HA
[image:7.595.48.299.112.233.2]Fig 9. Plot ln ((ab-xex)/(xe-x)) vs. t from eq. (7) at various concentrations of Zn2+onto HD-HA
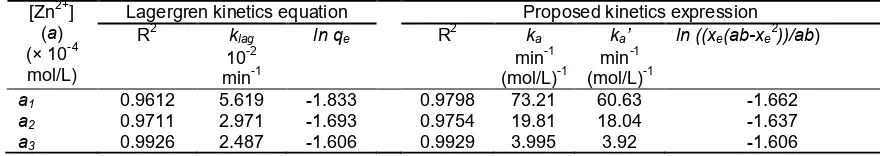
Table 2. Linearity (R2) and rate constant of Lagergren pseudo-first order (klag), proposed kinetics expression (ka), and proposed kinetics expression assuming a >> b (ka’), and for the sorption of various concentration Zn
2+ on HD-HA
Lagergren kinetics equation Proposed kinetics expression R2 klag ln qe R2 ka ka’ ln ((xe(ab-xe2))/ab) [Zn2+]
(a) (× 10-4
mol/L) 10
-2 min-1
min-1 (mol/L)-1
min-1 (mol/L)-1
a1 0.9612 5.619 -1.833 0.9798 73.21 60.63 -1.662
a2 0.9711 2.971 -1.693 0.9754 19.81 18.04 -1.637
a3 0.9926 2.487 -1.606 0.9929 3.995 3.92 -1.606
been done time variation for concentration of Zn2+i.e.a1,
a2, and a3 are 50 mg/L (8.075 × 10
-4
mol/L), 200 mg/L (14.81 × 10⁻⁴ mol/L) and 400 mg/L (61.11 × 10⁻⁴mol/L), respectively. The parameters of kinetics model can be seen in Table 2. Plot ln (xe-x)vs. tor ln (qe-qt)vst onto Lagergren model (Fig. 8) showed higher linearity at the increasingly excessive concentration of Zn2+. The value of R2 from plot ln ((ab-xex)/(xe-x)) vs. t in eq. (7) has similarity to the Lagergren model, this indicate the both kinetics model is suitable in the same optimum condition (Fig. 9).
When the concentration of Zn2+ increased from 8.07 to 61.11 × 10⁻⁴ mol/L, the value of klag was also changed from 0.05619 to 0.02487 min-1. The same thing was also shown by the eq. (7) change from 73.210 to 3.995 min-1(mol/L)-1. Although the adsorption is done on the isotherm condition,ka andklagchange with an initial concentration of Zn2+. Value of '
a
k shows closer toka at higher initial concentration of a. Changing values of ka and klag indicates that k is not only affected by temperature, but also it considered a complex function of the initial sorbate concentration (a). Intercept of Lagergren pseudo-first-order kinetics,ln qealways has a different value from the ln qe from experiments [38]. From eq. (8), it can be seen that the intercept plot
ln (qe-q) vs. t is more complex functions. The results of the calculation ofln ((xe(ab-xe
2
))/ab) of the data ona1, a2, and a3 is -1.662; -1.637; -1.606, respectively. The calculations showed results nearly close to the value of
the intercept Lagergren kinetics equation in Table 2. Data of time variation of the concentration of the sorbate (a) in this study indicates the proposed kinetics of the eq. (14) gives linearity which is similar to Lagergren kinetics equation and has value of intercept nearly close from calculation.
CONCLUSION
HD-HA has physical apparent similar with PS-HA. Characterization HD-HA using spectrophotometer UV-Vis and FT-IR gives the characteristic pattern and characteristics absorption bands based on Stevenson (1994). The proposed kinetic expression derived from the second order sorption reaching equilibrium has been proved successfully to be applied to determine the value of intercept of the well known Lagergren equation which has same value with calculation of
ln ((xe(ab-xe2))/ab). The proposed kinetics expression has the same condition with Lagergren kinetics model and gives better linearity at higher concentration of Zn2+.
ACKNOWLEDGEMENT
[image:7.595.316.564.113.236.2] [image:7.595.84.524.315.393.2]REFERENCES
1. Manahan, S.E., 2000, Environmental Chemistry, 7th ed., Lewis Publisher, Boca Raton.
2. Son, D.J., Kim, W.Y., Yun, C.Y., Chang, D., Kim, D.G., Chang, S.O., Kim, J.H., Sunwoo, Y., Bae, Y.S., and Hong, K.H., 2014,Int. J. Electrochem. Sci., 9 (8), 4548–4557.
3. Kulkarni, S.J., and Goswami, A.K., 2014, IJESRT, 3 (9), 446–450.
4. Amalle, P., Kulkarni, S., and Kulkarni, K., 2014,
IJEEME, 1 (9), 1–4.
5. Amalle, P., Kulkarni, S., and Kulkarni, K., 2014,
IJESIT,3 (5), 268–272.
6. Stoller, M., Sacco, O., Sannino, D., and Chianese, A., 2013,Membranes, 3 (3), 126-135.
7. Mahvi, A.H., and Bazrafshan, E., 2007, World App. Sci. J., 2 (1), 34–39.
8. Qdais, H.A., and Moussa, H., 2004, Desalination,
164 (2), 105–110.
9. Denizli, A., Say, R., and Arica, Y., 2000, Sep. Purif. Technol., 21 (1-2), 181–190.
10. Gering, K.L., and Scamehorn, J.F., 1988, Sep. Sci. Technol., 23 (14-15), 2231–2267.
11. Kulkarni, S.J., and Kaware, J.P., 2013,IJESIT,2 (4), 465–469.
12. Visa, M., and Duta, A., 2008, Scientific Study and Research,9 (1), 73–82.
13. Boparai, H.K., Joseph, M., and O’Carroll, D.M., 2010,J. Hazard. Mater.,186 (1), 458–465.
14. Maleki, A., Mahvi, A.H., Zazouli, M.A., Izanloo, H., and Barati, A.H., 2011, Asian J. Chem., 23 (3), 1373–1376.
15. Yavuz, Ö., Guzel, R., Aydin, F., Tegin, I., and Ziyadanogullari, R., 2007, Pol. J. Environ. Stud., 16 (3), 467–471.
16. Malakootian, M., Nouri, J., and Hossaini, H., 2009,
Int. J. Environ. Sci. Technol., 6 (2), 183–190.
17. Mousavi, H.Z., and Seyedi, S.R., 2011, Int. J. Environ. Sci. Technol.,8 (1), 195–202.
18. Mockaitis, G., Rodrigues, J.A.D., Foresti, E., and Zaiat, M., 2012,J. Environ. Manage.,106, 75–84. 19. López-Pérez, P.A., Neria-González, M.I.,
Flores-Cotera, L.B., and Aguilar-López R., 2013, Int. J. Environ. Res.,7 (2), 501–512.
20. Leyva-Ramos, R., Rangel-Mendez, J.R., Mendoza-Barron, J., Fuentes-Rubio, L., and Guerrero-Coronado, R.M., 1997, Water Sci. Technol., 35 (7), 205–211.
21. Pourret, O., Davranche, M., Gruau, G., and Dia, A., 2007,Chem. Geol., 243 (1-2), 128–141.
22. Bradl, H.B., 2004, J. Colloid Interface Sci., 277 (1), 1–18.
23. Santosa, S.J., Siswanta, D., Sudiono, S., and Utarianingrum, R., 2008,Appl. Surf. Sci., 254 (23), 7846–7850.
24. Santosa, S.J., Siswanta, D., Sudiono, S., and Sehol, M., 2007,Surf. Sci., 601 (22), 5148–5154. 25. Santosa, S.J., Siswanta, D., Kurniawan, A., and
Rahmanto, W.H., 2007,Surf. Sci.,601 (22), 5155– 5161.
26. Rahmawati, A., and Santosa, S. J., 2012,Alchemy, 2 (1), 46–57.
27. Dwipurwani, O., Maiyanti, S.I., Bangun, P.B.J., Zuhair, Samat, and Lesbani, A., 2012,JPS,15 (1), 22–25.
28. Hooijer, A., Silvius, M., Wösten, H., and Page, S., 2006,Delft Hydraulics Report,Q3943.
29. Barot, N.S., and Bagla, H.K., 2009, Green Chem. Lett. Rev., 2 (4), 217–221.
30. Rupiasih, N.N., and Vidyasagar, P.B., 2009, Int. J. Des. Nat. Ecodyn., 4 (1), 32–41.
31. Li, X., Xing, M., Yang, J., and Huang, Z., 2011,J. Hazard. Mater., 185 (2-3), 740–748.
32. Aiken G.R., Mcknight, D.M., and Wershaw, R.L., 1985, Humic Substance in Soil, Sediment, and Water, John Willey & Sons, New York.
33. Lagergren, S., 1898, K. Sven. Vetensk. Akad. Handl., 24 (4), 1–39.
34. Tseng, R.L., Wu, F.C., and Juang, R.S., 2010, J. Taiwan Inst. Chem. Eng., 41 (6), 661–669.
35. Ho, Y.S., 2004,Scientometrics, 59 (1), 171–177. 36. Foo, K.Y., and Hameed, B.H., 2010, Chem. Eng.
J.,156 (1), 2–10.
37. Santosa, S.J., 2014,CLEAN-Soil Air Water, 42 (6), 760–766.
38. Aharoni, C., and Sparks, D.L., “Kinetics of Soil Chemical Reactions—A Theoretical Treatment” in
Rates of Soil Chemical Processes, Sparks, D.L., and Suarez, D.L., ed., Soil Science Society of America, 1991, 1–18.
39. Stevenson, F.J., 1994,Humus Chemistry: Genesis, Composition, Reaction, 2nded., John Wiley & Sons, New York.
40. Salwer, C.N., McCarty, P.L., and Parkin, G.F., 1994,Chemistry for Environmental Engineering, 4th ed., McGraw-Hill Inc., New York.
41. Agarwal, S.P., Anwer, M.D.K., Khanna, R., Ali, A., and Sultana, Y., 2010,J. Serb. Chem. Soc., 75 (3), 413–422.
42. Domeizel, M., Khalil, A., and Prudent, P., 2004,
Bioresour. Technol.,94 (2), 177–184.
43. Gieguzynska, E., Kocmit, A., and Gołezbiewska,
P., and Gonet, S.S., Eds., Slovak Agricultural University: Nitra, Slovakia.
44. Albrecht, R., Le Petit, J., Terrom, G., and Périssol, C., 2011,Bioresour. Technol., 102 (6), 4495–4500. 45. Zbytniewski, R., and Buszewski, B., 2005,Bioresour.
Technol., 96 (4), 471–478.
46. El-Hajjouji, H., Fakharedine, N., Ait-Baddi, G., Winterton, P., Bailly, J.R., Revel, J.C., and Hafidi, M., 2007,Bioresour. Technol., 98 (18), 3513–3520. 47. Atkins, P.W., 1990, Physical Chemistry, 4th ed.,
Oxford University Press, Oxford.