Bacterioplankton strategies for leucine and glucose uptake after a
cyanobacterial bloom in an eutrophic shallow lake
V. Kisand
a,b,*, H. Tammert
a,ba
Vo˜rtsja¨rv Limnological Station, Rannu 61101, Tartumaa, Estonia
b
Institute of Zoology and Hydrobiology, University of Tartu, Vanemuise 46 51014, Estonia
Accepted 25 June 2000
Abstract
Extracellular enzyme activities and the kinetics of glucose and leucine uptake were measured to study the role of different substrate pools for bacterioplankton in a shallow eutrophic lake. The study took place during the period of cyanobacterial bloom in late summer and its collapse in the autumn. Leucine aminopeptidase activity (LAP),b-glucosidase activity (b-Gluc),3H-leucine incorporation (LI) and14 C-glucose incorporation (GI) were measured in Lake Vo˜rtsja¨rv during the autumn of 1997 (September–October). The kinetic parameters Vmax and KMwere determined for both enzymes using artificial fluorogenic substrates (leucine amino-methylcoumarin and methyl-umbelliferylb -glucose). Leucine and glucose uptake were measured using radiolabelled compounds. Abundance and production of bacterioplankton were also measured. Several environmental parameters including temperature, nutrient concentrations, seston content, and phytoplankton char-acteristics such as biomass, chlorophyll a concentration, and primary production were followed. The GI (Vmax) correlated positively with release of low molecular weight products of primary production,b-Gluc activity was more closely correlated with polymeric substrates released after breakdown of cyanobacterial bloom. LAP specific activity (i.e. activity per cell) increased towards the end of the experimental period and correlated more closely with the presence of specific populations than to the total number of bacteria. By the end of the experiment time, LI switched to a lower affinity system with higher specific Vmaxand KM. Bacteria preferentially used available carbon (as dissolved glucose) over carbon sources derived from the exoenzymatic hydrolysis of polymers. However, both sources of leucine (dissolved and hydrolysis products) were used equally by bacteria. Phytoplankton (dominated by cyanophytes) was the main origin of readily available dissolved low molecular weight compounds. After a cyanobacterial bloom some populations of bacteria grew on the dead cell material of algae, but the total number of heterotrophic bacteria decreased from approximately 7×10⁶to 1:9×10⁶ml21:q2000 Elsevier Science Ltd. All rights reserved.
Keywords: Extracellular hydrolytic enzymes; Glucose and leucine uptake; Bacterioplankton; Shallow eutrophic lake
1. Introduction
Most organic matter in soil and aquatic environments is composed of polymeric compounds and is not directly permeable through bacterial cell membranes. The activities of extracellular enzymes increase the soluble “available” carbon sources, which are then taken up and metabolised by bacteria. Glucolytic and proteolytic enzymes associated with bacterial cells are the most widely studied extracellular enzymes in water bodies (Chrost and Riemann, 1994; Chrost, 1991; Chrost et al., 1986; Mu¨nster, 1991).
Bacterioplankton is considered to be a major pool of organic matter, as many bacteria are able to degrade organic
polymers into small compounds for subsequent rapid uptake and assimilation. In principle, this process has two impor-tant consequences: (1) bacteria incorporate these products into their biomass; and (2) via the microbial loop, its carbon becomes available to higher food web organisms (Azam et al., 1983). Bacterial extracellular enzymes (Ammerman, 1991; Billen, 1991; Chrost, 1991) have been shown to have an important function in the degradation of polymers in aquatic ecosystems (Chrost, 1990).
b-d-Glucosidases (b-d-glucoside glucohydrolase; EC 3.2.1.21, b-Gluc) and leucine aminopeptidase (LAP, EC 3.4.1.1), are responsible for the hydrolysis of organic consti-tuents in the dissolved (DOM) and particulate organic matter (POM) pools. As a result of their activities glucose and amino acids are released into the environment. These compounds are then available to the uptake systems of the bacterial cells. It has been suggested that the corresponding
0038-0717/00/$ - see front matterq2000 Elsevier Science Ltd. All rights reserved. PII: S 0 0 3 8 - 0 7 1 7 ( 0 0 ) 0 0 1 7 1 - 1
www.elsevier.com/locate/soilbio
* Corresponding author. Address: Department of Microbiology, Umea˚ University S-90187, Umea˚, Sweden. Fax:146-90-77-26-30.
hydrolytic and transport systems should form a closely related unit (a ‘complex’) to ensure the efficient utilisation of substrates.
Although the transport of small molecules through membranes is believed to be not a limiting step for the system (Chrost, 1989; Mu¨nster and Chrost, 1990), both components of a complex can become saturated. Compar-ison of the kinetics of the extracellular enzyme/uptake complex could give an insight into the ecology and substrate utilisation in aquatic (and soil) systems.
The highest extracellular enzymatic activities are usually found during the period after phytoplankton bloom when algae are dying and being lysed (e.g. Chrost, 1989). During this time bacterial uptake of the products of hydrolysis, rather than algal exudates (as during the bloom) are believed to support metabolism and growth. Extracellular enzymes may not have great importance during the period of active phytoplankton growth as most of the newly produced organic carbon available to bacteria originates directly from the release of photosynthesis products (Chrost and Overbeck, 1990; Middelboe et al., 1995) and zooplankton grazing of algae (Vrba et al., 1992). However, during the period after the phytoplankton bloom, production of extra-cellular enzymes is the response of bacterioplankton to carbon sources of different type which become available.
The objectives of the present study were to follow both the uptake of two readily utilisable substrates, glucose and leucine, and the extracellular enzymatic activities of theb -glucosidase and leucine aminopeptidase, both during and after the cyanobacterial bloom. Several other bacterioplank-ton parameters, such as biomass and production, phyto-plankton biomass, chlorophyll concentration, and the physico-chemical properties of water were also followed.
2. Material and methods
Samples were collected over a period of a week from Lake Vo˜rtsja¨rv, a shallow, highly eutrophic lake in Central Estonia (area, 270 km2; maximum depth, 6 m; and mean depth, 2.8 m). Lake water was collected at the surface and then at 1, 2, 3, 4, 5, 6 m depth (2 l of each sample) using a Ruttner sampler. These samples were mixed in a sterile plastic barrel in order to get vertically integrated plankton samples. The total number of bacteria was determined by fluorescence microscopy on DAPI stained 0.22-mm black membrane (Osmonics Inc., Livermore, USA) filters (Porter and Feig, 1980). The productivity of bacteria was estimated using the 3H-leucine incorporation method (Simon and Azam, 1989). The colony forming units (CFU) were measured as plate counts on standard method agar (SMA, Becton Dickinson). Samples of 0.2–0.5 ml undiluted water were inoculated on two replicate Petri dishes containing growth medium and incubated for 7 d at 208C (Ott et al., 1997).
2.1. Kinetics of hydrolytic enzymes
Extracellular enzyme activity was measured from the increase in fluorescence due to the products of the non-fluorescent substrates. Methyl-umbelliferyl glucose (MUF-glucose) and leucine amino-methylcoumarin (Leu-AMC) hydrolyses (b-Gluc and LAP activities) were measured according to Hoppe (1983) and Chrost et al. (1986).
Fluorescence was measured at 450 (MUF) and 440 nm (AMC) for emission and at 365 (MUF) and 315 nm (AMC) for excitation (Perkin–Elmer 203 spectrofluorometer). Quantification of MUF and AMC was achieved by calibra-tion with standard solucalibra-tions (MUF 30 nM–20mM; AMC 50 nM–2mM). Stock solutions of the substrates (2.5 and 25 mM MUF-glucose; 1 and 10 mM AMC) were stored at 2258C. Triplicate water samples, 5 ml, were supplemented with different amounts of the stock solution to give a 5mM– 4 mM concentration range of MUF-glucose and 0.8– 200mM of Leu-AMC. Samples were incubated for 4 h at 258C. Michaelis–Menten kinetics parameters of enzyme reactions (KM and Vmax) were calculated using non-linear
regression analyses from original experimental data. Kinetics parameters were used to estimate changes in enzyme activity.
2.2. Monomer substrate uptake kinetics
Substrate uptake was measured in 5-ml duplicate water samples by addition of different amounts of radiolabelled glucose (1–50 nM, 180 mCi/mmol, Sigma) and leucine (3– 277 nM, 59.0 Ci/mmol, Amersham Ltd.): 1–50 and 3– 277 nM, respectively. Samples were incubated at 258C for 1 h (leucine) or 2 h (glucose). Incubation was terminated by adding formaline (final conc. 2 v/v) and the samples were filtered through 0.2-mm pore-size cellulose acetate filters (Millipore). The vials were rinsed once with 1 ml and filtered six times with 1 ml of 0.8% NaCl. Kinetics para-meters were calculated as for the enzyme reactions.
2.3. Other parameters
Primary production (PPpart) of phytoplankton and the
release of phytoplankton products into the extracellular dissolved fraction (PPdiss) were estimated on the basis of
the 14C assimilation method (Kisand et al., 1998). In brief, primary production (PP) was estimated in situ by NaH14CO3
(final activity 0.07mCi ml21, VKI, Denmark) assimilation. Samples were incubated for 2 h at six depths in the lake. For measurements of phytoplankton PP (PPpart), water was
filtered through membranes of 0.45mm pore-size (Millipore HA), for measurements of dissolved PP (PPdiss) the filtrate
and total PP (PPtot) water was acidified (pH ,2) by HCl
(Niemi et al., 1983; Hilmer and Bate 1992; Lignell 1992). The radioactivity of water, filtrate and filters was assessed using a scintillation counter (LSC RackBeta 1211, Wallac, Finland). Non-photosynthetic carbon fixation was measured in dark incubations and subtracted from light assimilation. V. Kisand, H. Tammert / Soil Biology & Biochemistry 32 (2000) 1965–1972
Samples for phytoplankton biomass were preserved and fixed with Lugol’s iodine. Species were identified and the biomass was determined using an inverted plankton micro-scope (Olympus IMT-2), magnification of 400× (Uter-mo¨hl, 1958). Algal pigments (chlorophyll a, pheopigments) were extracted with 90 v/v acetone and analysed spectrophotometrically (Strickland and Parsons, 1972). Zooplankton samples were preserved in the 4 v/v formaldehyde solution and studied by conventional quanti-tative analysis (Kiselev, 1956). Chemical analyses were performed in depth integrated water samples, using the methods described by Grasshoff et al. (1983).
2.4. Statistics
For comparisons of independent groups, Wilcoxon signed rank non-parametric tests were used. Comparing differences between single samples in one time series, known distribu-tion (Poisson distribudistribu-tion for counting measurements, normal distribution for others) and independence of single samples was assumed. Absolute difference between samples was compared using confidence intervals of each single measurement.
3. Results
3.1. Bacterioplankton abundance and heterotrophic activity
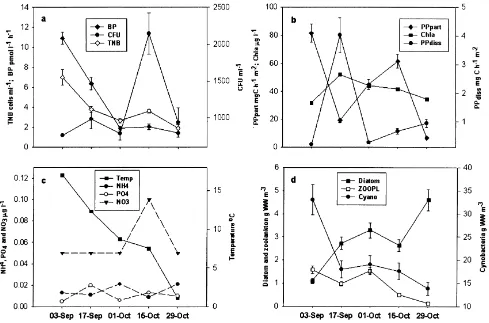
The total number of bacteria (TNB) decreased from the beginning (sampling week 1, 7:02×10
6
cells ml21) to the end (sampling week 5, 1:91×10
6
cells ml21of the experi-ment. In sampling week 4, a small peak occurred 3:65× 106cells ml21;different from the weeks 3 and 5 values at p0:021 and p0:0007;respectively; Fig. 1a). Bacterial production (BP) decreased rapidly within 3 weeks from the initial value of 10.9 to 1.4–2.0 pmol l21h21 at sampling weeks 4 and 5. The number of colony forming units (CFU) was in the range of 750–950 cells ml21, with the exception of 2146 cells ml21at sampling week 4 (Fig. 1a).
3.2. Extracellular enzyme activities and monomer uptake rates
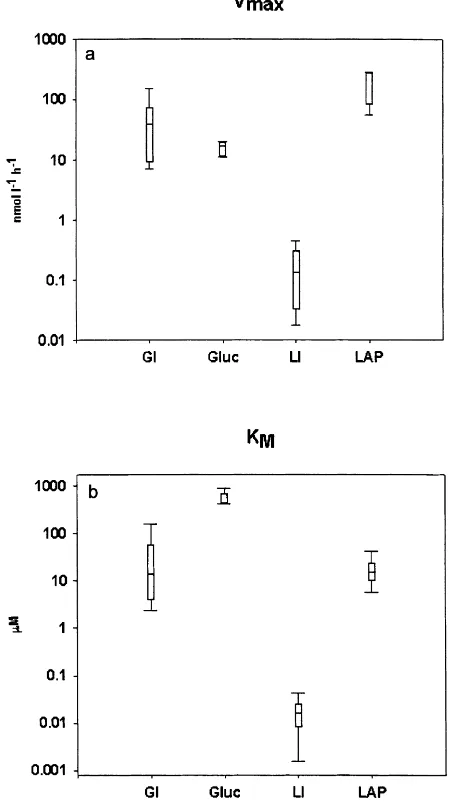
Vmax of glucose uptake (GI) and b-glucosidase activity
(b-Gluc) had approximately the same range of values (GI Vmax 7–150 nmol l21h21, median 38.6 nmol l21h21; b
-Gluc Vmax 11–20 nmol l21h21, median 16.8 nmol l21h21;
were approximately 1000 times lower (Vmax 17.5–
441 pmol l21h21, median 132 pmol l21h21) compared to aminopeptidase hydrolysis (LAP) values which were 100– 285 nmol l21h21, median 275.6 nmol l21h21(Fig. 2a).
The uptake KMhad lower values than the KMof hydrolysis
(Wilcoxon sign rank test, p,0:05;Fig. 2b). In addition the KM of GI/b-Gluc were lower (GI 2.4–161mM, median
13.7mM,b-Gluc 409–883mM, median 435mM) than the KMof LI/LAP (LI 1.6–43 nM, median 15.8 nM, LAP 5.7–
41mM, median 15.3mM).
For comparison of KMand Vmaxwith the other parameters
the specific activity (i.e. KM or Vmax per cell) values were
calculated. Glucose uptake affinity (KM) and activity (Vmax)
coincided with the release of the low molecular weight products of primary production (PPdiss) in sampling week
1 (September). On the other hand, b-glucosidase affinity was better correlated with polymeric substrates released
(measured as PPdiss) after the end of the cyanobacterial
bloom (Fig. 3a and c). While enzyme specific activity per cell and affinity increased, the uptake of glucose declined from sampling week 3.
LAP switched from a less active but higher affinity (lower KM) system in sampling weeks 1–2 (September) to a more
active (higher Vmax) system. The leucine uptake kinetics
changed in a similar manner. The only difference being that in September, leucine uptake was more active and had higher affinity (Fig. 3b and d). In October, leucine uptake was less active with slightly lower affinity. The specific affinity and activity of leucine uptake had the lowest values in sampling week 3, its KMincreased almost 10 times
by sampling week 5 (Fig. 3d).
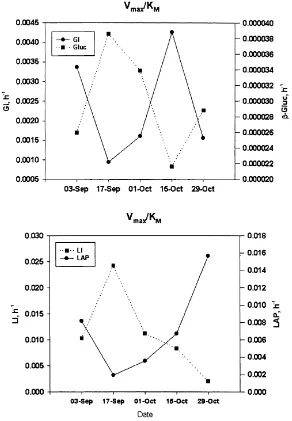
Vmaxand KMcoefficients of uptake and hydrolysis, which
may also be used to compare efficiency, had a reciprocal relationship with each other (Fig. 4): uptake efficiency was higher when enzyme efficiency was lower. Glucose uptake was much greater than the amount of glucose generated by hydrolysis ofb-glucosidase. On the other hand, the rate at which leucine was taken up and the aminopeptidase effi-ciency had nearly the same values, which were also close to glucose uptake values.
3.3. Physicochemical, phytoplankton and zooplankton variables
Water temperature decreased from 178C (sampling week 1) to 1.18C (sampling week 5, Fig. 1c), NO2-N concentration
was very low, throughout the sampling period and near to the detection limit (1mg N m23). NO3-N was constant for
most of the sampling period (approx. 0.05 mg N m23), but twice as much as the mean level at sampling week 4 (0.1 mg N m23). The concentration of PO4-P was the
high-est in sampling week 2 (0.02 mg N m23) and the concentra-tion of NH4-N was highest in sampling week 3
(0.021 mg N m23, Fig. 1c). The concentrations of total nitrogen (0.92–1.9 mg N m23) and phosphorus (0.036– 0.059 mg P m23) followed the changes in chlorophyll a concentration (Chl a), which had a maximum value in sampling week 2 (Fig. 1b). Although within the phytoplank-ton community cyanobacteria dominated, abundance of cyanobacteria decreased continuously throughout the sampling period (from 33 to 13.8 g WW m23). In contrast, the abundance of diatoms increased almost five times with the maximum value (4.6 g WW m23) occurring in sampling week 5 (Fig. 1d). Some species of Chrysophycea (e.g. mixo-trophic Dinobryon sp., Hyalobryon sp., Pseudokephyrion sp.) became more abundant in sampling week 3 (biomass 0.4 g WW m23). PPpart was at a high level (81.5
mg C m22h21) in sampling week 1, but declined suddenly in sampling week 2. This coincided with the highest values of released PPdiss and Chl a (Fig. 1b). PPpart increased in
weeks 2 and 3, but declined again in week 5 (the lowest recorded values, 6.7 mg C m22h21).
Macrozooplankton biomass decreased to about 10% of V. Kisand, H. Tammert / Soil Biology & Biochemistry 32 (2000) 1965–1972
1968
the original level during the investigation period (1.5– 0.15 g WW m23, Fig. 1d). Numerically, rotator Polyarthra luminosa dominated with the exception of week 1–2 when copepods, cladocerans and rotators had almost equal abun-dance. Biomass of copepods dropped in week 2. At the same time biomass of rotators (mainly Polyarthra luminosa) increased and reached the same level as that of cladocerans (dominant species Chydorus sphaericus).
4. Discussion
LAP andb-Gluc are common bacterial enzymes (Hale-mejko and Chrost, 1986; Chrost and Krambeck, 1986; Chrost et al., 1986; Chrost, 1989; Unanue et al., 1993; Somville, 1984), and their activities are assumed to be related to the total bacterioplankton community. Extracel-lular enzyme activities and specific compound uptake rates (based upon kinetic parameters such as apparent KM and
Vmax) may give a rough idea about the scale of metabolic
activities of bacterioplankton under in situ conditions. However, the artificial substrates commonly used for extra-cellular enzyme measurements differ significantly from naturally occurring substrates. Another drawback of model substrates is that they do not reflect the complexity of
natural substrates in aquatic (and soil) environments (Nagata et al., 1998).
Glucose utilisation relies on the available glucose pool, which mainly originates from phytoplankton, possibly via the release of primary products into the extracellular envir-onment (Fig. 1). Increases inb-glucosidase activity did not cause higher glucose uptake rates, instead glucose uptake was closely related to the PPdiss. Extracellular enzyme
activ-ity increased when biomass (mainly cyanobacterial) began to decline from the end of September but uptake of available dissolved glucose did not increase (Fig. 3). Glucose uptake was more closely related to the total number of bacteria (TNB) and to bacterial production measured as leucine incorporation into proteins (Figs. 1 and 3a,c). The dynamics of extracellular b-glucosidase production could have also been influenced by water temperature as has been shown previously (Coveney and Wetzel, 1992; Chrost, 1989). Therefore, despite the increase in polysaccharides after the cyanobacterial bloom, bacteria did not benefit by metabolis-ing the soluble sugars.
Leucine uptake was closely coupled to LAP: leucine aminopeptidase and leucine uptake kinetics parameters had similar distribution patterns (Fig. 3b and d). Leucine uptake was correlated to both the degradation of phyto-plankton detritus and cytoplasmic compounds originating from phytoplankton. In other lakes, low LAP activities
were found during blooms of phytoplankton, and protein hydrolysis became more important after the end of the algal bloom (Chrost, 1991). An unexpected decrease in both LAP and Leu uptake activity in week 3 coincided with high NH14 concentration (Figs. 1c and 3b,d). The explanation for the increase in NH14 concentration could be that intensive grazing by zooplankton (high zooplankton biomass was measured) was taking place. Also, amino acids could have been an important C source (excess N released as NH14 for bacteria (Jørgensen, 1992). Perhaps peptidase activity was repressed and decreased because ammonium could be used directly. Decrease of LAP activity due to high NH14 has been reported before (Wounters and Bieys-man, 1977), whereby only the Vmaxof hydrolysis has been
affected but the affinity did not change (Chrost, 1991). This was the case in Lake Vo˜rtsja¨rv (Fig. 3b and d). According to Tryland and Fiksdal (1998) some enzymes can also be ‘signature’ enzymes for specific bacterial species. In this
case LAP could have been expressed by a certain compo-nent of the bacterial population, although its activity corre-lated with total CFUs in October. At this time some changes in bacterioplankton species composition could have occurred because CFU started to increase and a general decline of TNB was observed (Fig. 1a).
The phytoplankton community showed a clear succession during the investigated period. Cyanobacteria dominated in the beginning of September (sampling week 1) and then decreased as the temperature decreased. In contrast, diatoms increased their biomass almost five times by the end of October. The total biomass of phytoplankton (measured as Chl a) decreased less p0:028;difference between week 1–2 and 4–5 values) (Fig. 1d) than primary production p 0:000:Previous studies in this lake have suggested that the phytoplankton community is an important energy and substrate source for bacteria (Kisand and No˜ges, 1998; Kisand and Tammert, 1998) although the specific fraction V. Kisand, H. Tammert / Soil Biology & Biochemistry 32 (2000) 1965–1972
1970
of the PP, which was utilised by bacterioplankton, was not determined. During the period of the investigation, both phyto- and bacterioplankton production and their biomass declined. The phytoplankton community provided some easily utilisable low molecular mass organic compounds, such as mononosaccharides and amino acids, which are utilised preferentially by bacterioplankton. After a typical cyanobacterial bloom, dying phytoplankton cells released polymeric compounds such as polysaccharides and proteins, into the water. The secretion of extracellular enzyme increased only slightly in response. The total bacterial community during the time of the algal bloom did not increase as a result of the presence of polymeric substrates. However, it is possible that a successional change of species within the bacterial community occurred. In this context, bacteria growing on rich media (CFU) increased relatively more in week 4 than TNB (Fig. 1a), and bacteria which could utilise proteins and peptides became more abundant. For comparisons of different enzyme-uptake systems, Vmaxand KM coefficients should be used because this gives
the possibility of comparing kinetic parameters with differ-ent magnitudes. Also, the Vmax/KM ratio characterises how
effectively the system is functioning: a higher value is an indicator of higher efficiency (and vice versa). GI efficiency was much higher than theb-Gluc Vmax/KMcoefficient, while
in the case of LI/LAP nearly the same Vmax/KM range of
coefficients occurred (Fig. 4). Activity of both components in GI/b-Gluc were in same range (Wilcoxon rank test, p 0:225 but the Vmax of b-Gluc was lower. Interestingly, in both cases uptake and enzyme Vmax/KMcoefficients had
reci-procal dynamics (i.e. uptake coefficient increased when enzyme activity coefficient decreased, and vice versa, Fig. 4), which can be an indication of simultaneous regulation. GI affinity (and also Vmax/KMcoefficient) increased in
Octo-ber whenb-glucosidase activity was high and affinity low (probably high concentrations of polymeric substrates and low concentrations of low molecular weight saccharides following lysis and breakdown of cyanobacterial bloom, see also Fig. 3a and c). Leucine uptake had a very high affinity (Fig. 2) and the Vmaxand KMvalues of both uptake
and enzyme activity were related. Nonetheless, LI/LAP had a different feature compared to GI/b-Gluc: LAP efficiency increased together with an increase in substrate concentra-tion, but at the same time LI efficiency declined. Thus it appears that the bacteria spent more energy producing extra-cellular enzymes, resulted in more available soluble amino acids which were incorporated by a less efficient and less energy costly uptake system.
Acknowledgements
Financial support for this project was provided by the Estonian Science Foundation (Grant to Dr Tiina No˜ges). We also thank Dr Ivo Leito from University of Tartu, Institute of Chemical Physics, for access to the spectrofluorometer and all
members of Vo˜rtsja¨rv Limnological station staff who were involved in the L. Vo˜rtsja¨rv monitoring program.
References
Ammerman, J.W., 1991. Role of ecto-phosphohydrolases in phosphorus regeneration in estuarine and coastal ecosystems. In: Chrost, R.J. (Ed.). Microbial Enzymes in Aquatic Environments, Springer, Berlin, pp. 165–186.
Azam, F., Fenchel, T., Field, I.G., Gray, I.S., Meyer-Reil, L.-A., Thingstad, F., 1983. The ecological role of water column microbes in the sea. Marine Ecology Progress Series 10, 257–263.
Billen, G., 1991. Protein degradation in aquatic environments. In: Chrost, R.J. (Ed.). Microbial Enzymes in Aquatic Environments, Springer, Berlin, pp. 123–143.
Chrost, R.J., 1989. Characterization and significance of b-glucosidase activity in lake water. Limnology and Oceanography 34, 660–672. Chrost, R.J., 1990. Microbial ectoenzymes in aquatic environments. In:
Overbeck, J., Chrost, R.J. (Eds.). Microbial Ecology, Springer, New York, pp. 47–78.
Chrost, R.J., 1991. Environmental control of the synthesis and activity of aquatic microbial ectoenzymes. In: Chrost, R.J. (Ed.). Microbial Enzymes in Aquatic Environments, Springer, Berlin, pp. 29–59. Chrost, R.J., Krambeck, H.J., 1986. Fluorescence correction for
measure-ments of enzyme activity in natural waters using methylumbelliferyl-substrates. Archiv fu¨r Hydrobiologie Beiheft 106, 79–90.
Chrost, R.J., Overbeck, J., 1990. Substrate–ectoenzyme interactions: significance of beta-glucosidase activity for glucose metabolism by aquatic bacteria. Archiv fu¨r Hydrobiologie Beiheft 34, 93–98. Chrost, R.J., Riemann, B., 1994. Storm-stimulated enzymatic
decomposi-tion of organic matter in Benthic Pelagic Coastal Mesocosms. Marine Ecology Progress Series 108, 185–192.
Chrost, R.J., Wcislo, R., Halemejko, G.Z., 1986. Enzymatic decomposition of organic matter by bacteria in an eutrophic lake. Archiv fu¨r Hydro-biologie Beiheft 107, 145–165.
Coveney, M.F., Wetzel, R.G., 1992. Effects of nutrients on specific growth rate of bacterioplankton in oligitrophic lake water cultures. Applied and Environmental Microbiology 58, 150–156.
Grasshoff, K., Ehrhardt, M., Kremling, K., 1983. Methods of Seawater Analysis. Verlag Chemie, Weinheim (419pp.).
Halemejko, G.Z., Chrost, R.J., 1986. Enzymatic hydrolysis of proteinac-eous particulate and dissolved material in an eutrophic lake. Archiv fu¨r Hydrobiologie Beiheft 107, 1–21.
Hilmer, T., Bate, G.C., 1992. Filter types, filtration and post-filtration treat-ment in phytoplankton production studies. Applied and Environtreat-mental Microbiology 33, 1225–1228.
Hoppe, H.G., 1983. Significance of exoenzymatic activities in the ecology of brackish water: measurements by means of methylumbelliferyl substrates. Marine Ecology Progress Series 11, 299–308.
Jørgensen, N.Ø.G., 1992. Incorporation of [3H]leucine and [3H]valine into protein of freshwater bacteria: field applications. Applied and Environ-mental Microbiology 58, 3647–3653.
Kisand, V., No˜ges, T., 1998. Seasonal dynamics of bacterio- and phyto-plankton in large and shallow eutropic Lake Vo˜rtsja¨rv, Estonia. Inter-national Revue Hydrobiology 83, 205–216.
Kisand, V., No˜ges, T., Zingel, V., 1998. Diel dynamics of bacterioplankton activity in eutrophic shallow Lake Vo˜rtsja¨rv, Estonia. Hydrobiologia 380, 93–102.
Kisand, V., Tammert, H., 1998. Bacterioplankton in Lake Vo˜rtsja¨rv. Limnologica 28, 41–47.
Kiselev, J., 1956. Metody issledovaniya planktona. Methods of plankton investigation. In: Pavlovski, E.N., Zhadin, V.I. (Ed.), Zhizn Presnykh Vod SSSR IV Moscow–Leningrad, pp. 183–265.
Middelboe, M., Søndergaard, M., Letarte, Y., Borch, N.H., 1995. Attached and free-living bacteria: production and polymer hydrolysis during a diatom bloom. Microbial Ecology 29, 231–248.
Mu¨nster, U., 1991. Extracellular enzyme activity in eutrophic and polyhu-mic lakes. In: Chrost, R.J. (Ed.). Microbial Enzymes in Aquatic Envir-onments, Springer, Berlin, pp. 96–122.
Mu¨nster, U., Chrost, R.J., 1990. Origin, composition and microbial utiliza-tion of dissolved organic matter. In: Overbeck, J., Chrost, R.J. (Eds.). Microbial Ecology, Springer, Berlin, pp. 8–46.
Nagata, T., Fukuda, R., Koike, I., Kogure, K., Kirchman, D.L., 1998. Degradation by bacteria of membrane and soluble protein in seawater. Microbial Ecology 14, 29–37.
Niemi, M., Kuparinen, J., Uusi-Rauva, A., Korhonen, K., 1983. Preparation of algal samples for liquid scintillation counting. Hydrobiologia 106, 149–159.
Ott, I., Laugaste, R., Lokk, S., Ma¨emets, A., 1997. Plankton changes in Estonian small lakes in 1951–93. Proceedings of the Estonian Academy of Sciences, Biology Ecology 46, 58–79.
Porter, K.G., Feig, Y.S., 1980. The use of DAPI for identifying and count-ing aquatic microflora. Limnology and Oceanography 25, 943–948. Simon, M., Azam, F., 1989. Protein content and protein synthesis rates of
planktonic marine bacteria. Marine Ecology Progress Series 51, 201– 213.
Somville, M., 1984. Measurement and study of substrate specificity of
exoglucosidase activity in eutrophic water. Applied and Environmental Microbiology 48, 1181–1185.
Strickland, J.D.H., Parsons, T.R., 1972. A practical handbook of seawater analysis. Bulletin of the Fisheries Research Board of Canada, Ottawa, 310pp.
Tryland, I., Fiksdal, L., 1998. Enzyme characteristics ofb -D-galactosidase-andb-D-glucuronidase-positive bacteria and their interference in rapid methods for detection of waterborne coliforms and Escherichia coli. Applied and Environmental Microbiology 64, 1018–1023.
Unanue, M., Azua, I., Barcina, I., Egea, L., Iriberri, J., 1993. Size distribu-tion of aminopeptidase activity and bacterial incorporadistribu-tion of dissolved substrates in 3 aquatic ecosystems. FEMS Microbiology Ecology 102, 175–183.
Utermo¨hl, H., 1958. Zur Vervollkommung der quaatitativen Phytoplank-tonmethodik. Mitteilungen de Internationalen Vereinigung fuer Theo-retische und Angewandte Limnologie 9, 1–38.
Vrba, J., Nemoda, J., Simek, K., Seda, J., 1992. Microbial decomposition of polymer organic matter related to plankton developement in a reservoir: activity of alfa, b-glucosidase, and b-N-acetylglucosaminidase and uptake of N-acetylglucosamine. Archiv fu¨r Hydrobiologie Beiheft 126, 193–211.
Wounters, J., Bieysman, P., 1977. Production of some exocellular enzymes by Bacillus licheniformis 749/C in chemostat cultures. FEMS Letters 1, 109–112.
V. Kisand, H. Tammert / Soil Biology & Biochemistry 32 (2000) 1965–1972