www.elsevier.com / locate / livprodsci
Reduction of the number of parameters needed for a
polynomial random regression test day model
*
M.H. Pool , T.H.E. Meuwissen
Department of Genetics and Reproduction, Institute for Animal Science and Health (ID-Lelystad), P.O. Box 65, 8200 AB Lelystad,
The Netherlands
Received 24 June 1999; received in revised form 11 October 1999; accepted 18 October 1999
Abstract
Legendre polynomials were used to describe the (co)variance matrix within a random regression test day model. The goodness of fit depended on the polynomial order of fit, i.e., number of parameters to be estimated per animal but is limited by computing capacity. Two aspects: incomplete lactation records and heterogeneous variances were investigated to reduce the order of fit needed. Analysis of the original data set, which contained 50% incomplete lactation records, required a fifth-order of fit and showed too high variances at the end of the lactation. Variance component estimates from only complete lactation records improved the goodness of fit. Correlations estimated were more alike those observed and substantially lower variances at the end of lactation were obtained, such that a fourth-order seemed sufficient. Correction for heterogeneous variances across classes of days in milk improved the estimated correlation structure further and the mean square errors of prediction were better, resulting in a third-order of fit being sufficient. Overall, use of only complete lactation records for parameter estimation and correction for heterogeneous variances allowed a reduction of two parameters that need to be estimated per animal. 2000 Elsevier Science B.V. All rights reserved.
Keywords: Breeding value estimation; Covariance functions; Random regression model; Heterogeneous variances; Test day model
1. Introduction are also used for traits such as feed intake (Veerkamp
and Thompson, 1998b), live weight (Koenen and Genetic evaluation models in dairy cattle that use Veerkamp, 1998) and longevity (Veerkamp et al., test day records instead of (305-d) lactation records 1999). The models for production traits are known as are of great interest in the area of cattle breeding for test day models (TDMs) and can account for the production traits (e.g., Schaeffer and Dekkers, 1994; effect of test date (Reents and Dopp, 1996), number, Kettunen et al., 1998; Veerkamp and Goddard, order and intervals between test day records, and 1998a; Pool and Meuwissen, 1999). These models provide information about persistency by modeling the pattern of the lactation curve (Schaeffer and Dekkers, 1994).
*Corresponding author. Tel.:131-320-238-265; fax:1
31-320-Different types of TDM are described in the 238-050.
E-mail address: [email protected] (M.H. Pool) literature (see review by Swalve, 1995). TDMs
describe longitudinal measurements which change (1998) observed that data points at the beginning and over time, i.e., for milk production the model has to end of the lactation trajectory for which an animal allow a continuous change of variances and co- has records have a relatively large impact on the variances of test day yields during the lactation regression coefficient estimates, when polynomials period. In the random regression approach (Schaeffer are used as the covariance function.
and Dekkers, 1994) the lactation curve is split into Incomplete lactation records might affect the two parts: a fixed part (average lactation curve) and a weighting of data points because the model has to random animal specific part (deviations from the extrapolate the lactation record. Further most models average curve). The variance components of the assume that the residuals are distributed normally random regression coefficients determine the covar- and independent with zero mean and equal variance, iance function of each pair of days in milk (DIM). but in practice a systematic pattern was observed in In the literature, several lactation curves were the residuals over the lactation trajectory (Jamrozik investigated to describe the covariance function (e.g., et al., 1997; Liu et al., 1998). The latter may be Ali and Schaeffer, 1987; Kirkpatrick et al., 1994; removed by heterogeneity of variance correction Guo and Swalve, 1997; Jamrozik et al., 1997 and over DIM. When one of these two aspects is signifi-Pool and Meuwissen, 1999). Generally, the goodness cant, it may be expected that by including it in the of fit increased with the number of function parame- model, a lower order of fit can be achieved without ters describing the curve. Although differences be- significantly reducing the goodness of fit of the tween functions were small, Guo and Swalve (1997) model.
recommended exploiting those. Besides a more This study investigated the effect of two aspects, simple and understandable model, the number of namely, incomplete lactation records and heteroge-parameters to be estimated per animal is limited for neous variance over DIM on the estimated covar-computational reasons. iance function parameters, especially at the outer Jamrozik and Schaeffer (1997) and Kettunen et al. parts of the trajectory. The aim of this study was to (1998) showed unexpected high estimates of minimize the order of fit of Legendre polynomials heritabilities for daily yields as well as negative within the TDM, i.e., to reduce the required number genetic correlations between the most distant test of parameters to be estimated per animal in order to days when using the Ali and Schaeffer curve (1987) make the application of the TDM feasible in prac-as the random regression function. Kettunen et al. tice.
(1998) concluded that the overestimation of the genetic variances at the edges of the defined lactation
curve trajectory was likely due to the mathematical 2. Materials and methods
characteristics of the sub-model, i.e., the function
chosen within the TDM. Another type of function, 2.1. Data Legendre polynomials (LEG, Kirkpatrick et al.,
For the effect of incomplete lactation records only Models used to investigate the effect of incom-full, completed lactation records, i.e., last test con- plete lactation records and heterogeneous variance ducted at or after day 280 DIM and at least 22 tests over cDIM were termed C-LEG(m) and H-LEG(m), were selected. Such lactation records describe the respectively, where m specifies the order of fit of the whole trajectory of 305 days, i.e., no longer was any Legendre polynomials applied. The random regres-implicit extrapolation embedded in the model. The sion coefficients used for C-LEG(m) and H-LEG(m) selected data contained 15 907 test day records from were estimated from the selected data set, i.e., the 370 completed lactation records, 192 first and 178 370 completed lactation records. All results were later parity, from 267 animals, with an average and compared to previous results which were based on standard deviation for test day milk yield of 27.3 and parameters estimates from all 951 lactation records, 7.4 kg, respectively. i.e., the reference model, termed as model LEG(m),
Both data sets, i.e., the original with 951 lactation as described in Pool and Meuwissen (1999). records and the selected with 370 completed
lacta-tion records, were used. Covariance funclacta-tion
parame-2.3. Covariance function ters were estimated using the selected data set.
Criteria for the goodness of fit of the models were
The estimated covariance function of test day calculated using the original data set with variance
records over DIM is:
for j±j9, and where K5Var(k)5estimated variance–
covariance matrix of the random regression coeffi-TDMs with different orders of fit, based on
cients over animal3lactations and of size m3m;
Legendre polynomials (Kirkpatrick et al., 1990 and
2
s 5residual variance. Furthermore the model as-Kirkpatrick et al., 1994), were applied to the data e
sumed E[k ]50, E(e )50 and E( y )5x b. The sets to determine the goodness of fit, i.e., the order of i(m) ij ij ij
2
covariance matrix of k , i.e., K, and s were fit needed to model individual lactation curves i(m) e
obtained by residual maximum likelihood estimation accurately for the aspects investigated. The following
(REML, see Patterson and Thompson, 1971) and the TDM, as suggested by Pool and Meuwissen (1999)
expectation maximization algorithm (Henderson, where yij5test day milk yield j in the animal3
lactation i (i.e., lactations of the same animal were A phenotypic correction for heterogeneous
vari-9
assumed independent); xij5incidence row vector for ances was applied over weekly classes of days in fixed effects b; b5[m; ys; age; cDIM; TD]9 with milk (2344 classes within first and later parity) respectively, the overall mean, year season of calv- according to the method of Meuwissen et al. (1996). ing, age at calving, weekly classes for DIM within Estimation of variance components and calculation first and later parity and test date effect (for details of scaling factors to correct for phenotypic
heteroge-9
see Pool and Meuwissen, 1999);fij(m)5tijLmwhere neous variances over cDIM were carried out
2
variance and scaled observations were calculated as required estimates for Var(k) and se. For models follows: C-LEG(m) and H-LEG(m) those parameters were estimated using the selected data set and for model LEG(m) using the original data. The residual
vari-ˆ
C-LEG(m) and varied over cDIM for model H-LEG(m). The model with the best order of fit, is the ]]2
ˆ
se0( q) model that expects a (co)variance and a correlation
]]
yi( q11 )5yi( q) 2 (4) structure which is equal, i.e., same shape as the
ˆ
sei( q)
œ
observed ones (OBS and C-OBS).The second criterion, MSEP, investigates how well
2
ˆ
where sei( q)5estimated residual variance for cDIM missing records could be predicted. Therefore,
differ-2 ent patterns of records were deleted from the original
ˆ
class i and se0( q)5overall residual variance in the
2 data set to obtain subsets with missing records, i.e.,
ˆ
model estimated in iteration q (se0( q) was
re-esti-2 part lactation records of different lengths were
ˆ
mated in each iteration, as the mean of sei( q)); yi( q)
created. The deleted observations were predicted and yi( q11 )5vector with the current and updated
using the information in the subset and compared to observations in the cDIM class i in iteration q,
the actually observed records (see Pool and
Meuwis-ˆ
respectively; ei( q)5vector with residuals for cDIM
sen, 1999). MSEP values were calculated as: class i in iteration q; ni5number of observation in
cDIM class i; sc5[N2rank(X)] /N5scaling factor s i
accounting for the degrees of freedom used by the 2 ˆ
MSEPi5
O
( yij2y ) /sij i (5) model, where N5the total number of test day j51records and X5design matrix of the fixed effects
(one sc factor was used for all cDIM classes, because where y 5missing record j in subset i, which was
ij
sci5[ni2rank(X )] /n for cDIM class i could not bei i known in the complete data set; yˆ 5predicted value
ij
calculated since the design matrix X extends acrossi of missing record j in subset i, and si5number of the cDIM). missing records in subset i. The pattern in MSEP was expected to decrease steadily over DIM if information accumulates, i.e., if part lactations be-2.5. Comparison of models
come longer. The model with the lowest and con-tinuously decreasing MSEP pattern has the best fit. The criteria for the goodness of fit used were as in
Pool and Meuwissen (1999), namely: (1) a graphical comparison of the variance of the data [Var(y)], and
(2) mean square errors of predictions of missing 3. Results
observations (MSEP) for the different TDMs.
The first criterion compares the pattern of the 3.1. Variance estimates Var(y) predicted by the model and that observed
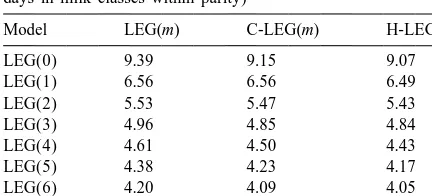
Table 1 C-LEG(m) from 20.64 to 0.23 [r and
k ,
2 1( 7 ) 6( 7 )
Residual variances of daily milk yield (kg ) estimated by the
rk , respectively] and for H-LEG(m) from model using Legendre polynomials with an order of fit m for 5( 6 ),6( 6 )
20.33 to 0.39 [r and r , respectively] LEG(m) [the reference model, based on the original data] and the k5( 7 ),6( 7 ) k0( 2 ),k1( 2 )
models C- and H-LEG(m) (based on complete lactation records, (only results for the third- and fifth-order of fit are respectively after a correction for heterogeneous variances over
presented in Table 2). Although correlations were in days in milk classes within parity)
general not very strong, they were not negligible. Model LEG(m) C-LEG(m) H-LEG(m) Where C-LEG(m) estimated the strongest (negative)
LEG(0) 9.39 9.15 9.07 correlation between the higher order random regres-LEG(1) 6.56 6.56 6.49 sion coefficients, H-LEG(m) estimated the strongest
LEG(2) 5.53 5.47 5.43
(positive) correlation between the lower order
ran-LEG(3) 4.96 4.85 4.84
The covariances of milk yields expected by each model [LEG(m), C-LEG(m) and H-LEG(m)] were calculated from the (co)variance matrix of random between the random regression coefficients k and ki j
regression coefficients (k ) and the residual vari-for the order of fit m [r and i±j] in Table 2
j(m) ki(m), kj(m)
ance for each DIM (Eq. (2)). In Figs. 1 and 2 the and are comparable between the models. Values
variances observed in the data and expected are showed differences between the models LEG(m),
presented for the reference model [LEG(m), charts in C-LEG(m) and H-LEG(m) and varied also slightly
the upper right corner, described by Pool and with the order of fit (estimated up to a seventh-order
Meuwissen (1999)] and C-LEG(m) (main graphs). of fit). Correlations ranged for LEG(m) from 20.51
The shape of the variance curve expected for the to 0.52 [rk0( 0 ),k1( 0 ) and rk5( 6 ),k6( 6 ), respectively], for
Table 2
Correlations between random regression coefficients using a third- and fifth-order fit Legendre polynomial expected by the model LEG(m), C-LEG(m) and H-LEG(m) (i.e., for the reference model, based on complete lactation records, respectively, after a correction for heterogeneity of variances of milk yield over days in milk classes within parity)
a
Fig. 1. Variances of milk yield observed by a test day model based on complete lactation records (model C-OBS) and expected for the order of fit 0, 1 and 3 using Legendre polynomials [C-LEG(m), based on the selected data], compared with the variances observed versus expected by the reference model [OBS and LEG(m), based on the original data, chart in upper right corner].
different orders of fit should be compared to the pattern expected was sufficiently accurate for model observed ones, i.e., OBS in the upper graphs and C-LEG(4), where the reference model needed C-OBS in the main graphs. In general, the goodness LEG(5). The increase at the end of the lactation of fit increased with the order of fit for both models. period for the reference model [LEG(4)] was not However, the variances expected by C-LEG(m) (i.e., observed for C-LEG(4) for which random regression using only complete lactation records of at least 280 coefficient estimates from the reduced data set were days long) approximated the observed variances used. For H-LEG(m) the data was scaled such that better than model LEG(m) did. Fig. 3 shows the the observed variance equals the variance that was expected variances of the records that were corrected expected by the model, which means that the choice for heterogeneous variances [H-LEG(m)]. The pat- of the model did no longer depend on the expected terns of the curves in Fig. 3 are different from those covariance matrix, but on the correlation matrix. of the other models [LEG(m) and C-LEG(m)] and
not comparable because the variances of the cor- 3.3. Expected versus observed correlation rected records were scaled towards the variances structures
expected by the TDM. Variance estimates for all
Fig. 2. Variances of milk yield observed by a test day model based on complete lactation records (model C-OBS) and expected for the order of fit 4, 5 and 7 using Legendre polynomials [C-LEG(m), based on the selected data], compared with the variances observed versus expected by the reference model [OBS and LEG(m), based on the original data, chart in upper right corner].
somewhat lower correlations between days early in Legendre polynomial seemed to fit the observed lactation and higher between days late in lactation structure in the data accurately. The fit of C-LEG(4) for the reduced data set compared to the original data was better than C-LEG(3) because stacked areas set (C-OBS and OBS, respectively). The observed showed a slightly odd bend between days in the correlation structure shows the overall pattern clear- middle of the lactation, especially for the lower ly, although the observed correlations were not correlation areas, which was generated probably by smoothed. Observed correlations were calculated for the increased variances expected at the end of the weekly classes of DIM so that number of observa- lactation (see Fig. 1). Compared to C-LEG(5) the tions was large enough for each class given the size goodness of fit of C-LEG(4) was more smoothed, of the data set. Reducing the class length for DIM suggesting that C-LEG(4) would be less sensitive to and a larger data set is expected to smooth the uncertainties in the data. Based on the expected observed correlations more. covariance and correlation pattern (Figs. 2 and 4) In general the correlation structure was modeled C-LEG(4) and C-LEG(5) were almost identical better for the higher orders of fit for both models, suggesting that the order of fit, i.e., the number of C-LEG(m) and LEG(m). Estimated correlations parameters to be estimated per animal could be ranged from almost unity for successive days to reduced by one to a fourth-order of fit.
Fig. 3. Variances of milk yield expected by a test day model using Legendre polynomials after correction for heterogeneity of variance for milk yield over cDIM classes for an order of fit of 0, 1, 3 and 5 [i.e., H-LEG(m), based on complete lactation records].
one resulted in a better fit of the observed correlation accumulated compared to the reference model structure (C-OBS in Fig. 4) compared to model [LEG(m)]. Comparing different orders of fit for C-C-LEG(m), especially for days late in the lactation LEG(m) the MSEP-pattern improved up to C-[e.g., the observed stacked correlation range 0.8–0.9 LEG(4) and was stable for higher orders of fit (Fig. after day 210 observed in the data was expected by 6, right chart).
H-LEG(3), but not by model C-LEG(3)]. Overall, A correction for heterogeneity of variance im-H-LEG(3), two-orders of fit lower than the reference proved the MSEP-pattern further, especially for the model [LEG(5)], seemed to yield a good fit of the lower orders of fit, up to LEG(3) (Fig. 7, left chart). correlation structure observed in the reduced data. The MSEP for H-LEG(m) improved especially when part lactation records of 80 days and longer had to be 3.4. MSEP of missing observations extrapolated implicitly by the TDM. The unexpected increase of MSEP, when part lactation records of 100 In Fig. 6 (left chart) the MSEP is given for several days or longer were used, was almost stabilized subsets with part lactations of different lengths for completely for the lower orders of fit in model the reference model [LEG(m)] and for the model H-LEG(3) compared to C-LEG(m) (Fig. 7, left C-LEG(m). The MSEP was expected to decrease chart). For the higher order of fits [H-LEG(2) and continuously if information accumulates, i.e., if part higher] MSEP-patterns were stable (Fig. 7, right lactations becomes longer. For the lower orders of fit chart).
.H
.
P
ool
,
T
.H
.E
.
Meuwissen
/
Livestock
Production
Science
64
(2000
)
133
–
145
141
Fig. 5. Correlation structures for milk yield among days in milk expected by a test day model using Legendre polynomials with different orders of fit m after correction for heterogeneity of variances of milk yields over classes for days in milk [H-LEG(m)]. Stacked areas, from left to right, are H-LEG(2) (upper triangle) and H-LEG(3) (lower triangle); H-LEG(4) (upper triangle) and H-LEG(5) (lower triangle).
records with information over the whole lactation parameters to be estimated per animal) without period should be used. Further, the unexpected significantly reducing the goodness of fit for the increase of MSEP probably generated due to unequal expected variance–covariance matrix using Legendre weighting of the data points was improved clearly polynomials in a random regression TDM. The after the correction for heterogeneity of variance. goodness of fit was measured here by MSEP and a graphical comparison of the observed versus ex-pected variance and correlation structures.
Differ-4. Discussion ences in goodness of fit could be compared by
maximum likelihood tests, but for breeding value The aim of this study was to determine the estimation the accuracy and fluctuations of predic-minimum order of fit (i.e., reducing the number of tions as information accumulates are more important
Fig. 6. Mean square error of predictions of missing observations from a test day model using Legendre polynomials of different orders of fit
m for the reference model [i.e., LEG(m)] and C-LEG(m) [i.e., based on complete lactation records with last test day at or after day 280], for
Fig. 7. Mean square error of predictions of missing observations from a test day model using Legendre polynomials of different orders of fit
m for the model H-LEG(m) with correction for heterogeneity of variance of milk yields over classes for days in milk and based on only
complete lactation records [i.e., C-LEG(m)] for several subsets with different part lactation lengths.
(Pool and Meuwissen, 1999). The model suggested favorably, since extrapolation can affect the weight-here will be developed further into a multi-trait, ing of data points unequally (Kirkpatrick et al., multi-lactation random regression TDM for genetic 1990) with relatively more weight at the ends of the evaluations, which should have as few parameters as recorded trajectory (Meyer, 1998). To avoid im-possible because of limited computer resources and plicitly generated extrapolation within the model to avoid estimation errors of redundant parameters. only complete lactation records were used. Estima-The current data set was too small to estimate tion of random regression parameters and therefore separated genetic and environmental lactation curves. the goodness of fit of the model improved in general It was expected that if the same function was used to and the order of fit required to model the observed model the environmental and genetic curve as sug- variance and correlation structure accurately was gested by Kettunen et al. (1998), that it will be sufficient with a fourth-order polynomial [C-identical to the phenotypic curve (Pool and Meuwis- LEG(4)], i.e., one-order of fit less as in the reference sen, 1999). Hence, the presented results for the model.
that the selection bias due to selecting only complete step separately until convergence. Total number of lactation records was less severe than the bias that iterations for the estimation of model parameters was introduced by the poor extrapolation of the H-LEG(m) was three times as much as for the model polynomial random regression function when all C-LEG(m), for all orders of fit. For correction of lactation records were used. In conclusion, estima- heterogeneity of variance alone the number of itera-tion of polynomial random regression coefficients tions was somewhat less than for model parameter was more biased by use of incomplete lactation estimation. However, computer time for one round of records and therefore only complete lactation records correction took longer than one round of variance should be used. component estimation, thus time in total was
approx-Correction for heterogeneity of variance for milk imately six-times as much as for C-LEG(m). yields over cDIM within first and later parity was Heterogeneous variance along the lactation trajec-expected to correct for the systematic pattern ob- tory was corrected for by the method of Meuwissen served in the residual terms over DIM (Jamrozik et et al. (1996). With this method the variance of the al., 1997; Liu et al., 1998; Pool and Meuwissen, data was scaled towards the expected variances by 1999). A phenotypic correction before hand by the model. Both the fixed and random effects were scaling the data or afterward by correcting for the scaled toward the values expected by the model. The residual terms in the genetic evaluation (Kistemaker method was justified if it is used to scale hetero-and Schaeffer, 1998) is possible. Here we opted for geneity of variance in the data, but questionable if it joint estimation of breeding values and heteroge- is used to scale, for example, a variance peak neous variances (Meuwissen et al., 1996) because by expected by the model but not observed in the data. this method the observed variances are scaled to- In the latter case, the scaling of fixed effects is not wards the variances expected by the model. Hence, justified, because observations in the same fixed the random regression part of the TDM, modeled not effect class can be scaled differently. An alternative, the (co)variances but only the correlations between would be to exclude the fixed effect from the scaling the test days. The latter improved the goodness of fit (Eq. (4)), i.e., to pre-correct test day yields for fixed (Figs. 5 and 7) such that H-LEG(3) seemed to yield effects before the heterogeneity standardization and a similar fit as C-LEG(4), i.e., a further reduction of add them back afterwards. Changing the fixed effect one-order of fit was achieved. Compared to H- correction of cDIM would not affect the results LEG(4) the correlation structure estimated by model because cDIM levels are within subclasses of correc-H-LEG(3) was more smoothed which suggested that tion of heterogeneous variances. Further research is it will damp out the sampling errors for the estimated needed to test whether heterogeneity of variance random regression coefficients better. Compared to correction without scaling of fixed effects would C-LEG(3), H-LEG(3) yielded better MSEP for part improve the goodness of fit of the RRM further. lactations with a length of 100 days or more (Fig. 7),
correlation structure predicted was as good as C-LEG(3) (Figs. 4 and 5) and the overestimation of
variance after day 250 (Fig. 1) was corrected for in 5. Conclusions
model H-LEG(3).
Kirkpatrick, M., Hill, W.G., Thompson, R., 1994. Estimating the correction for heterogeneous variances the order of
covariance structure of traits during growth and ageing, illus-fit needed could be reduced further to a third-order
trated with lactation in dairy cattle. Genet. Res. Camb. 64, polynomial. Overall a reduction of two regression 57–69.
coefficients to be estimated per animal fewer was Kistemaker, G.J., Schaeffer, L.R., 1998. Adjustment for heteroge-achieved without reducing the goodness of fit of a neous Herd–Test–Day variances. INTERBULL Mtg., Rotorua, 18–19 January. In: Bull. 17th Int. Bull Eval. Serv., Uppsala, random regression test day model using Legendre
pp. 55–59. polynomials.
Koenen, E.P.C., Veerkamp, R.F., 1998. Genetic covariance func-tions for live weight, condition score, and dry-matter intake measured at different lactation stages of Holstein Friesian
Acknowledgements heifers. Livest. Prod. Sci. 57, 67–77.
Liu, Z., Jamrozik, J., Jansen, G., 1998. A comparison of fixed and random regression models applied to dairy test day production The authors gratefully acknowledged the financial
data. INTERBULL Mtg., Rotorua, New Zealand, 18–19 support of the division NRS of CR-DELTA,
sug-January. In: Bull. 17th Int. Bull Eval. Serv., Uppsala, pp. gestions and support from the people at the depart- 60–63.
ment of Genetics and Reproduction at ID-Lelystad, Meuwissen, T.H.E., De Jong, G., Engel, B., 1996. Joint estimation Animal Breeding and Genetics at WIAS and division of breeding value and heterogeneous variances of large data
files. J. Dairy Sci. 79, 310–316. NRS of CR-DELTA.
Meyer, K., 1998. Estimating covariance functions for longitudinal data using a random regression model. Genet. Sel. Evol. 30, 221–240.
References Patterson, H.D., Thompson, R., 1971. Recovery of inter-block
information when block sizes are unequal. Biometrika 58, 545–554.
Ali, T.E., Schaeffer, L.R., 1987. Accounting for covariances
Pool, M.H., Meuwissen, T.H.E., 1999. Prediction of daily milk among test day milk yields in dairy cows. Can. J. Anim. Sci.
yields from a limited number of test days using test day 67, 637–644.
models. J. Dairy Sci. 82, 1555–1564. Guo, Z., Swalve, H.H., 1997. Comparison of different lactation
Reents, R., Dopp, L., 1996. Genetic evaluation for dairy pro-curve sub-models in test day models. INTERBULL Open Mtg.,
duction traits with a test day model for multiple lactations. Vienna, 28–29 August. In: Bull. 16th Int. Bull Eval. Serv.,
INTERBULL Open Mtg., Veldhoven, 23–24 June. In: Bull. Uppsala, pp. 75–79.
14th. Int. Bull Eval. Serv., Uppsala, pp. 113–117. Henderson, C.R., 1984. In: Applications of Linear Models in
Schaeffer, L.R., Dekkers, J.C.M., 1994. Random regressions in Animal Breeding, University of Guelph, Guelph, pp. 196–206.
animal models for test-day production in dairy cattle. In: Proc. Jamrozik, J., Schaeffer, L.R., 1997. Estimation of genetic
parame-5th World Congr. Genet. Appl. Livest. Prod., Guelph, pp. ters for a test day model with random regressions for yield
443–446, Vol. 18. traits of first lactation Holsteins. J. Dairy Sci. 80, 762–770.
Swalve, H.H., 1995. Test day models in the analysis of dairy Jamrozik, J., Kistemaker, G.J., Dekkers, J.C.M., Schaeffer, L.R.,
production data – a review. Arch. Tierz. 38 (6), 11–31. 1997. Comparison of possible covariates for use in a random
Veerkamp, R.F., Goddard, M.E., 1998a. Covariance functions regression model for analysis of test day yields. J. Dairy Sci.
across herd production levels for test day records on milk, fat 80, 2550–2556.
and protein yield. J. Dairy Sci. 81, 1690–1701.
¨ ´ ¨ ¨
Kettunen, A., Mantysaari, E.A., Stranden, I., Poso, J., Lidauer, M.,
Veerkamp, R.F., Thompson, R., 1998b. A covariance function for 1998. Estimation of genetic parameters for first lactation test
feed intake, liveweight and milk yield estimated using a day milk production using random regression models. In: Proc.
random regression model. J. Dairy Sci. 82, 1565–1573. 6th World Congr. Genet. Appl. Livest. Prod., Armidale, pp.
Veerkamp, R.F., Brotherstone, S., Meuwissen, T.H.E., 1999. 307–310, Vol. 23.
Survival analysis using random regression models. Workshop Kirkpatrick, M., Lofsvold, D., Bulmer, M., 1990. Analysis of the
on Genetic Improvement of Functional Traits in Cattle-longevi-inheritance, selection and evolution of growth trajectories.
![Fig. 1. Variances of milk yield observed by a test day model based on complete lactation records (model C-OBS) and expected for the orderof fit 0, 1 and 3 using Legendre polynomials [C-LEG(by the reference model [OBS and LEG(m), based on the selected data], compared with the variances observed versus expectedm), based on the original data, chart in upper right corner].](https://thumb-ap.123doks.com/thumbv2/123dok/1051078.933081/6.612.47.494.85.355/variances-lactation-legendre-polynomials-reference-compared-variances-expectedm.webp)
![Fig. 2. Variances of milk yield observed by a test day model based on complete lactation records (model C-OBS) and expected for the orderof fit 4, 5 and 7 using Legendre polynomials [C-LEG(by the reference model [OBS and LEG(m), based on the selected data], compared with the variances observed versus expectedm), based on the original data, chart in upper right corner].](https://thumb-ap.123doks.com/thumbv2/123dok/1051078.933081/7.612.50.503.89.359/variances-lactation-legendre-polynomials-reference-compared-variances-expectedm.webp)
![Fig. 3. Variances of milk yield expected by a test day model using Legendre polynomials after correction for heterogeneity of variance formilk yield over cDIM classes for an order of fit of 0, 1, 3 and 5 [i.e., H-LEG(m), based on complete lactation records].](https://thumb-ap.123doks.com/thumbv2/123dok/1051078.933081/8.612.51.501.78.327/variances-expected-legendre-polynomials-correction-heterogeneity-variance-lactation.webp)
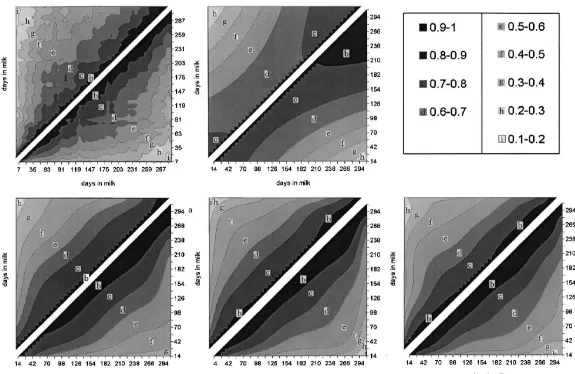
![Fig. 5. Correlation structures for milk yield among days in milk expected by a test day model using Legendre polynomials with differentorders of fit m after correction for heterogeneity of variances of milk yields over classes for days in milk [H-LEG(m)]](https://thumb-ap.123doks.com/thumbv2/123dok/1051078.933081/10.612.59.493.469.620/correlation-structures-legendre-polynomials-differentorders-correction-heterogeneity-variances.webp)
![Fig. 7. Mean square error of predictions of missing observations from a test day model using Legendre polynomials of different orders of fitm for the model H-LEG(m) with correction for heterogeneity of variance of milk yields over classes for days in milk and based on onlycomplete lactation records [i.e., C-LEG(m)] for several subsets with different part lactation lengths.](https://thumb-ap.123doks.com/thumbv2/123dok/1051078.933081/11.612.59.493.84.232/predictions-observations-legendre-polynomials-correction-heterogeneity-onlycomplete-different.webp)
