Maternal Labor Supply and the
Introduction of Kindergartens into
American Public Schools
Elizabeth U. Cascio
a b s t r a c t
Since the mid-1960s, many state governments have introduced subsidies for school districts that offer kindergarten. This paper uses the staggered timing and age targeting of these grants to examine how the childcare subsidy implicit in public schooling affects maternal labor supply. Using data from five Censuses, I estimate that four of ten single mothers with no younger children entered the work force with public school enrollment of a five-year-old child. No significant labor supply responses are detected among other mothers with eligible children. Results also indicate that at least one in three marginal public school enrollees would have otherwise attended private school.
I. Introduction
Public schools have long served a dual purpose, providing children with valuable skills and parents with an implicit subsidy for their care. The generos-ity of this subsidy differs greatly across countries. In some, such as France and Swe-den, public education is highly integrated with female labor markets, with young children eligible to attend low- to no-cost preschools for the entire work day. In the United States, by contrast, public schooling has historically begun at age five Elizabeth U. Cascio is an assistant professor in the Department of Economics at Dartmouth College, faculty research fellow at the National Bureau of Economic Research, and research fellow at the Institute for the Study of Labor. The author thanks Hilary Hoynes, Ethan Lewis, Ann Huff Stevens, two anonymous referees, and seminar participants at the Second Annual UKCPR Small Grants Conference, the University of California Davis, and the Federal Reserve Bank of Chicago for helpful comments. This research was supported with a grant from the U.K. Center for Poverty Research through the U.S. Department of Health and Human Services, Office of the Assistant Secretary for Planning and Evaluation, grant number 5 ASPE417-02. The opinions and conclusions expressed herein are solely those of the author and should not be construed as representing the opinions or policy of the UKCPR or any agency of the Federal government. The data used in this article can be obtained beginning July 2009 through June 2012 from Elizabeth U. Cascio, Department of Economics, Dartmouth College, 6106 Rockefeller Center, Hanover, NH 03755, [email protected].
½Submitted April 2006; accepted September 2007
ISSN 022-166X E-ISSN 1548-8004Ó2009 by the Board of Regents of the University of Wisconsin System
on a half-day basis. This has changed in recent years, as some American schools have introduced full-day kindergartens and pre-kindergarten programs for children younger than age five (Doherty 2002; Ewen et al. 2002). While the primary rationale for these subsidies is to make investments in human capital that parents cannot af-ford, they also have been justified as a tool to raise maternal employment and lower reliance on public assistance (Gelbach 2002; Karoly and Bigelow 2005).
But do extensions of public schooling to young children raise maternal labor sup-ply? Which mothers respond? Though many studies have estimated the sensitivity of maternal employment to childcare costs, their elasticity estimates cannot be easily generalized to answer these questions.1In theory, public school does provide a 100 percent price subsidy for childcare on the employment margin, encouraging mothers to enter paid work. However, for mothers who would otherwise work more hours than in the school day, the price subsidy for childcare is inframarginal. The effect of public school eligibility on labor supply is therefore neither a price elasticity nor an income elasticity of employment, but rather a combination of the two (Gelbach 2002). The size (and sign) of this effect relies on the relative magnitude of these elasticities and the preexisting distribution of hours worked, which may differ across time and space. Identification of this reduced-form effect also is difficult, as the age at which a child is able to enter a local public school may be related to unobserved correlates of maternal labor supply—demand for childcare, in particular.
I address this identification problem using a policy experiment that led to massive increases in the supply of seats for children in American public schools. From the mid-1960s to the late 1970s, a number of states introduced grants for school districts offering kindergarten programs. Before these grants were available, kindergarten provision appears to have relied more on the tax base of a school district than on con-stituent preferences: In the average state, kindergarten supply went from sporadic to universal within few years of passing an initiative, and many new programs operated full-day. While much like today, the goal of these initiatives was to develop child-ren’s cognitive and social skills (Cascio 2007), they in effect put in place a system of free childcare for all five-year-olds. My analysis contrasts the labor force decisions of women with five-year-old children before and after these initiatives, using their staggered timing and age targeting to generate comparison groups. Similar analyses are conducted for children’s private and public school enrollment. Data are drawn from the five Decennial Censuses spanning 1950 through 1990.
I find that for single mothers of five-year-olds with no younger children, employment responses to the funding initiatives were relatively large. In particular, for every ten chil-dren enrolled in public school as a result of the initiatives, about four of these mothers entered the labor force. On the other hand, estimates for married mothers with no children younger than five are close to zero, not statistically significant, and precise enough to con-clude that employment responses of such a magnitude were unlikely. Estimates for moth-ers with younger children, regardless of marital status, also hover around zero and are not statistically significant. With the exception of single mothers with five-year-olds and younger children, all groups exhibited significant substitution away from private school-ing alongside strong takeup of seats in new public school kindergartens.
1. See Anderson and Levine (2000), Blau (2003), or Blau and Currie (2006) for reviews of this literature.
If supporting maternal employment were the only goal of subsidizing education for young children, these findings would suggest that the costs outweigh the benefits: Only single mothers responded to the subsidy implicit in new public school kindergartens— and among these, the only significant findings are for those without children younger than age five—and married mothers responded by switching from comparable and presumably affordable childcare arrangements without increasing their labor supply. Maternal employment rates today are also high relative to the period under consid-eration, suggesting that the estimates presented here may provide an upper bound on the likely employment responses to recent expansions of public schooling in the United States. However, mothers today may respond differently to the price and in-come subsidies implicit in public schooling. This study has also not measured the primary benefit of these programs, which is the long-run return to improved school readiness; any conclusions regarding the desirability of public investments in pre-school education would need to take this return into account.
II. The Program
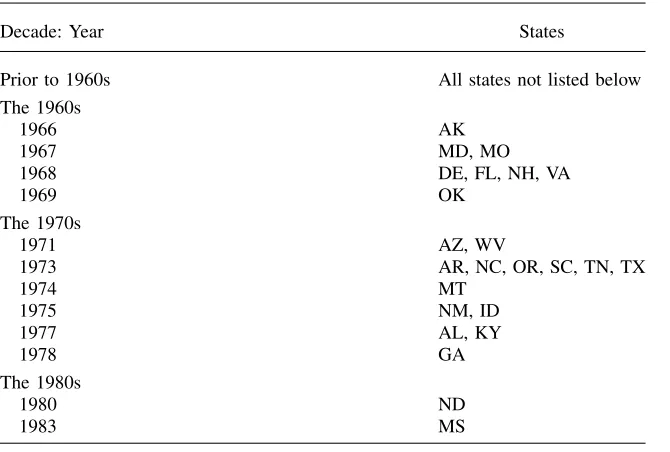
Table 1 gives the year of funding for kindergartens in the United States, focusing on states that did not have funding regimes in place by the mid-1960s (here-after referred to as the ‘‘treated states’’ or the ‘‘treated region’’).2 The majority of treated states and the vast majority of the treated population were from the South.3 Many of the initiatives were passed in the late 1960s and early 1970s, though there was considerable variation across states in timing. Most incorporated kindergartens into school foundation-aid formulas, making funding for kindergarten as secure as that for other grades. While none was accompanied by a mandate for kindergarten provi-sion, the state grants would have covered a substantial fraction of kindergarten operat-ing costs in the typical school district, providoperat-ing a strong incentive for districts to found programs (Cascio 2007). This was particularly the case in the South, where in 1965 the median state government provided half of school revenues.4
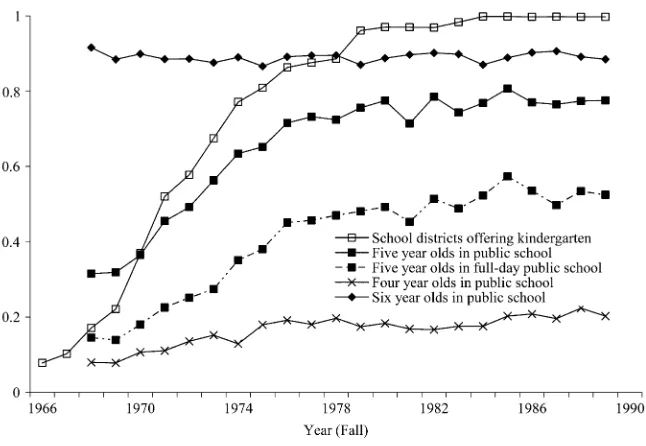
Figure 1 shows that there were in fact dramatic increases in kindergarten supply and fall enrollment of five-year-olds in the South over the period that the funding ini-tiatives were passed. Underlying data are from the Common Core of Data and its predecessors (for supply) and the October Current Population Survey (CPS) School Enrollment Supplements (for enrollment).5Between 1966 and 1989, the probability
2. See Cascio (2007) for a description of data collection and sources. The present analysis focuses only on states in the treated region, not those passing initiatives prior to 1960, because information on the public/ private breakdown of school enrollment is not available prior to the 1960 Census, and data on provision of kindergartens are only systematically collected starting in the 1960s. As a result, it is impossible to dem-onstrate how earlier initiatives affected the provision of kindergarten programs, public school enrollment, and substitution across different types of schooling among five-year-olds.
3. For example, 84 percent of five-year-olds in the treated region resided in Southern states in October 1977 (author’s calculations from the October Current Population Survey).
4. This figure was 46 percent across all treated states and 31 percent across states elsewhere in the United States in Fall 1965 (U.S. Department of Health, Education, and Welfare 1969).
5. I restrict attention to the Southern census region because until 1977, state of residence was not univer-sally reported in the October CPS. Only 6.1 percent of Southern five-year-olds were not in treated states in 1977.
that a Southern school district offered kindergarten rose from 7.9 to 99.7 percent. Over roughly the same period, the likelihood that a Southern five-year-old was en-rolled in public school rose from 32 to 78 percent.6 However, the probability that a Southern four- or six-year-old was enrolled in public school changed little. This suggests that the initiatives were not accompanied by other policies that affected school enrollment opportunities for young children more generally. Further, much of the rise in public school attendance among five-year-olds was driven by enroll-ment on a full-day basis, suggesting that the subsidy implicit in new kindergartens was large, covering 100 percent of childcare costs for most of the work day.7
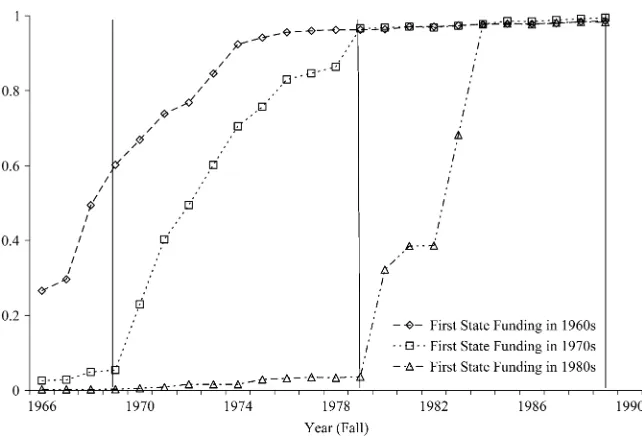
Figure 1 also suggests that school districts responded rapidly to funding availabil-ity, as most gains in kindergarten supply and enrollment were achieved by the late 1970s. Figure 2 shows this more directly, plotting the fraction of districts offering kindergartens by year and decade of initiative. The underlying data now include all treated states, not just those in the South. The role of funding is particularly Table 1
Year of First State Funding for Kindergarten
Decade: Year States
Prior to 1960s All states not listed below
The 1960s
1966 AK
1967 MD, MO
1968 DE, FL, NH, VA
1969 OK
The 1970s
1971 AZ, WV
1973 AR, NC, OR, SC, TN, TX
1974 MT
1975 NM, ID
1977 AL, KY
1978 GA
The 1980s
1980 ND
1983 MS
Source: See Cascio (2007).
Notes: Date of first state funding for kindergarten is defined as the year in which state grants to offset the costs of providing kindergarten were available to all districts in a state.
6. I do not plot public kindergarten enrollment rates because the initiatives may have induced substitution toward public kindergarten from other public preschool programs and from enrollment in public first grade. Trends in public kindergarten enrollment nevertheless look quite similar.
7. In the treated region overall, 41 percent of five-year-olds (53 percent of public school attendees) attended public school on a full-day basis in 1980. In the rest of the United States, only 16 percent of five-year-olds (20 percent of public school attendees) enrolled in public school full day.
apparent for states that first funded kindergartens in the 1970s or 1980s: For both groups, it was not until the decade of first state funding that kindergarten supply be-gan to rise, and universal provision was achieved within the same decade. Anecdot-ally, the lags in takeup that arose did so largely due to a scarcity of qualified teachers and constraints on classroom space.8
My empirical strategy uses this funding-induced variation across states and over time in kindergarten supply to predict labor supply among mothers of five-year-olds in a differences-in-differences (DD) framework. I limit the analysis to women in trea-ted states, as they are likely to be more comparable to each other than to women out-side of the treated region.9Because new kindergartens would only have provided free Figure 1
Fraction of School Districts Offering Kindergarten and Fraction of Four to Six-year-olds Enrolled in Public School in the South
Sources: Enrollment calculations from the October CPS. See Appendix 1 for description of sources for public school kindergarten supply.
Note: The South includes all states in the South Atlantic, East South Central, and West South Central Census divisions.
8. See Murray (1973) p. 88, Forgione (1977) p. 73, and Harris (1987) pp. 117-18.
9. If the price or income elasticity of employment or preinitiative employment rates differed across regions, the estimates presented here would be representative of the treated region only. For all subpopulations and all years considered in this analysis, employment rates and hours are in fact slightly lower in the nontreated region. However, I have estimated the relationship between public school attendance and employment of women with five-year-olds in 1980 using quarter of birth dummies as instruments for enrollment (the ap-proach used in Gelbach (2002)), and I cannot reject the null that the two-stage least squares coefficients on public school attendance are identical in the treated and nontreated regions.
childcare for olds, I use other women in treated states without five-year-olds to construct comparison groups. To minimize bias, I limit the comparison groups to mothers with children slightly older or slightly younger than age five. These triple-difference (DDD) models remove biases from state-specific shocks to employment shared by mothers with children of about same age, such as changes in state labor market conditions or in the generosity of state welfare benefits.
The available data make it possible for me to arrive at estimates that are poten-tially less biased than those previously presented in studies using a similar research design. In particular, studies of the effect of public schooling expansions for young children on maternal employment for other countries have generally used variation from all geographic areas in a country, regardless of their likely comparability. Also, they have either not estimated DDD models (Berlinski and Galiani 2007; Lefebvre and Merrigan 2005) or not had sufficient data to define comparison groups as nar-rowly as I do here (Schlosser 2006; Baker, Gruber, and Milligan 2005). Further, pre-vious studies have lacked enough preinitiative data to rule out that estimates are not biased from reversion to the mean; positive labor supply responses to preschool expansion—particularly if concentrated in areas with relatively low initial levels of female labor supply—may reflect a return to some longer-run trend, rather than a true policy impact. I alleviate these data constraints by using the Census, which offers large samples and observations on labor supply more than 15 years before the first funding initiatives were passed.
Figure 2
Fraction of School Districts Offering Kindergarten, by Year and Decade of First State Funding
Sources: See Appendix 1.
The responsiveness of American women to the provision of free childcare through public schools is also likely to differ dramatically from that of women in other coun-tries. The present paper therefore complements Gelbach (2002), the first study using the Census to examine how public school kindergartens affect maternal labor supply in the United Sates. Gelbach compares mothers whose children were close in age but differed in their kindergarten eligibility in 1980, at which point kindergartens were present in most American public schools. In the preceding decades, the generosity of public assistance and women’s preferences for and wages from market work changed dramatically, likely affecting the sensitivity of maternal employment to childcare costs. While mothers in the United States today may have different price and income elasticities of employment—and a relatively high fraction of these moth-ers already work—the different economic environments that underlie our studies may provide insight into the likely employment effects of modern-day schooling expansions, as discussed further below.
III. Data
A. Source and Sample
My analysis focuses on the reduced-form relationship between kindergarten funding and maternal labor supply. To estimate this relationship, I use data from the 1950-90 Decennial Census Public-Use Microdata Samples (PUMS).10The PUMS span the funding initiatives and provide information on state of residence, which is lacking in higher frequency data, such as the CPS, for this period. Because the PUMS in-clude entire households, not just individuals, I can also follow Gelbach (2002) in es-timating separate models for mothers of five-year-olds with and without younger children. My primary estimates are for mothers without children younger than the age of five, as the introduction of kindergartens would have represented a relatively large reduction in childcare expenditure—and a relatively large increase in net earnings— for this group.
Use of the Census imposes two constraints on my analysis. First, the data are available only on ten-year intervals. As a result, I am not able to exploit all variation in initiative timing shown in Table 1. However, I am able to use more than simply the decade in which a funding initiative was passed: Cascio (2007) shows that public kindergarten enrollment rates increased substantially (and close to linearly) in the first two years that kindergarten funding was available, most likely because the sup-ply-side constraints described above induced a one-year lag in takeup for some dis-tricts. Thus, there is arguably exogenous variation in kindergarten supply across states that subsidized kindergarten in the two years immediately preceding any Cen-sus. To capture this idea, I define the key policy variable as the fraction of the two years prior to the Census that kindergarten funding was available in the state in which a woman currently resides. All models nevertheless yield similar estimates when this variable is replaced with a post-initiative indicator or the fraction of the previous three or four years that funding has been in place, as discussed below.
10. See Appendix 2. Because the fraction of the population represented in the PUMS differs across years, all means and regressions are weighted to be population representative.
Second, age in the Census is measured as of April 1, and respondents’ quarter of birth is not reported in 1950 and 1990. This makes it impossible to limit the sample to women whose children would have likely been eligible to enter kindergarten in the previous fall.11Instead, the treatment group includes all women residing in the treated region with at least one child aged five or six.12It thus covers all mothers potentially treated by the introduction of state funding: The eldest five-year-olds and the youngest six-year-olds would have had relatively high probabilities of entering kindergarten, if offered, the prior fall. However, the treatment group also includes mothers whose chil-dren would not have been eligible for kindergarten, as well as mothers whose chilchil-dren should have currently been enrolled in first grade. Because enrollment of these children would not have changed with the introduction of state funding, as suggested by Figure 1, their inclusion in the sample should bias downward the effect of the initiatives.
To illustrate, Table 2 shows the fraction of five- and six-year-olds in the estimation sample attending public school by Census year, separately by marital status of the mother and the presence of younger siblings.13In 1960—the first year in which school enrollment is measured for Census respondents aged five and older—slightly over 40 percent of five- and six-year-olds in the sample were in public school, a figure that well exceeds the public enrollment rate of five-year-olds in the October CPS nearly a decade later. The gain in the public school enrollment rate of five- and six-year-olds in the Cen-sus during the 1970s was also on the order of 20 percentage points—roughly half of the gain observed over the same period among five-year-olds shown in Figure 1. The effect of the funding initiatives on maternal labor supply should therefore be slightly over half the magnitude of what it would be if the sample could be limited to women whose chil-dren could have truly gained access to public school kindergarten. The indirect effect of public school enrollment on maternal labor supply—the parameter estimated in Gel-bach (2002)—can nevertheless be identified.14
B. Summary Statistics
The first panel of Table 3a shows summary statistics for available labor supply meas-ures by Census year, focusing on mothers of five- and six-year-olds (hereafter re-ferred to as ‘‘five-year-olds’’) without younger children. Along both employment dimensions observed in all years—employment (an indicator) and hours worked, both in the prior week—the typical single mother consistently supplied more labor than her married counterpart. However, there were large increases in labor supply for married mothers over the sample period. The gain in employment was particu-larly large during the 1970s, when the majority of the funding initiatives were passed; the econometric models described below allow me to test whether any of this gain was a response to the funding of kindergartens. Table 3b shows that married
11. Most state and local guidelines require entering kindergartners to reach age five sometime between September 1 and January 1.
12. A further description of the sample and construction of key variables is given in Appendix 2. 13. In the analysis of enrollment patterns, the unit of analysis is the child, not the mother. Children included are those whose mothers are in the estimation sample.
14. In the 1950 Census, enrollment information is limited to a small number of ‘‘sample line’’ respondents. The 1950 enrollment question also does not distinguish between public and private schools. As a result, I limit the enrollment regressions to children aged five and older who are observed between 1960 and 1990. Because I use 1950 data in the employment regressions, I do not present instrumental variables estimates.
Table 2
School Enrollment Rates of Five-year-olds, by Marital Status of Mother and Presence of Younger Siblings: 1960–90
1960 1970 1980 1990 1960 1970 1980 1990
Mother Single, No Younger Siblings Mother Married, No Younger Siblings
Public school (¼1) 0.43 0.52 0.73 0.70 0.42 0.48 0.67 0.64
Private school (¼1) 0.05 0.12 0.14 0.10 0.07 0.15 0.18 0.17
N 950 1457 12706 20548 8749 10822 47878 51001
Mother Single, With Younger Siblings Mother Married, With Younger Siblings
Public school (¼1) 0.42 0.47 0.74 0.70 0.39 0.46 0.66 0.61
Private school (¼1) 0.04 0.07 0.09 0.09 0.07 0.14 0.16 0.16
N 1,356 1,354 7,694 13,630 14,347 10,654 40,636 43,603
Notes: Data are from the Decennial Census. Calculations are weighted by population weights. Sample includes children aged five or six as of the Census who are matched to mothers residing in the treated region (see Table 1). See text and Appendix 2 for further description of sample.
148
The
Journal
of
Human
Table 3a
Characteristics of Mothers of Five-year-olds with No Younger Children, by Marital Status: 1950–90
Single, No Younger Children Married, No Younger Children
1950 1960 1970 1980 1990 1950 1960 1970 1980 1990
Employment
Worked last week (¼1) 0.52 0.56 0.59 0.65 0.67 0.18 0.30 0.37 0.51 0.64
Hours last week 20.9 20.5 22.5 24.7 25.8 6.7 10.5 12.9 17.9 22.8
(21.9) (20.3) (20.4) (19.9) (20.4) (15.6) (17.7) (18.2) (19.3) (19.8) Background
High school degree (¼1) 2 0.35 0.50 0.67 0.76 2 0.52 0.61 0.75 0.85
White (¼1) 0.71 0.65 0.61 0.59 0.58 0.89 0.90 0.89 0.85 0.83
Children aged 7–12 0.84 1.01 1.13 0.66 0.62 0.91 1.05 1.18 0.82 0.80
(1.00) (1.10) (1.09) (0.83) (0.77) (0.92) (0.94) (1.03) (0.78) (0.75)
Children Aged 13–17 0.41 0.36 0.51 0.28 0.22 0.45 0.37 0.50 0.32 0.26
(0.75) (0.66) (0.87) (0.66) (0.52) (0.75) (0.67) (0.82) (0.66) (0.55)
Age 34.9 35.2 33.7 30.8 31.8 34.7 34.9 33.9 32.5 33.9
(8.5) (8.6) (7.8) (6.8) (6.4) (6.9) (6.7) (6.7) (5.7) (5.5)
N 1,041 807 1,276 11,955 19,248 10,248 7,457 9,753 45,139 48,076
Notes: Data are from the Decennial Census. Calculations are weighted by population weights. Standard deviations are in parentheses. Sample includes mothers of children aged five or six as of the Census residing in the treated region (see Table 1). See text and Appendix 2 for further description of sample.
Cascio
Table 3b
Characteristics of Mothers of Five-year-olds with Younger Children, by Marital Status: 1950–90
Single, With Younger Children Married, With Younger Children
1950 1960 1970 1980 1990 1950 1960 1970 1980 1990
Employment
Worked last week (¼1) 0.33 0.38 0.43 0.42 0.45 0.10 0.17 0.23 0.34 0.48
Hours last week 12.5 13.2 15.4 15.5 16.8 3.3 5.7 8.0 11.6 16.4
(19.8) (19.1) (19.1) (19.4) (20.1) (11.2) (13.9) (15.7) (17.5) (19.3) Background
High school degree (¼1) — 0.25 0.36 0.56 0.65 — 0.45 0.57 0.74 0.83
White (¼1) 0.53 0.48 0.46 0.46 0.50 0.80 0.81 0.84 0.82 0.84
Children ages 0–4 1.47 1.68 1.42 1.27 1.30 1.55 1.61 1.35 1.24 1.22
(0.67) (0.84) (0.67) (0.54) (0.58) (0.73) (0.80) (0.61) (0.49) (0.47)
Children Aged 7–12 1.04 1.06 1.05 0.51 0.47 1.03 0.98 0.85 0.43 0.40
(1.10) (1.14) (1.21) (0.80) (0.74) (1.11) (1.11) (1.08) (0.73) (0.67)
Children Aged 13–17 0.39 0.26 0.36 0.14 0.11 0.39 0.23 0.23 0.09 0.08
(0.78) (0.63) (0.79) (0.50) (0.39) (0.77) (0.61) (0.64) (0.40) (0.34)
Age 31.3 30.4 29.6 27.7 28.4 31.2 30.4 29.5 29.0 30.6
(7.0) (6.8) (6.9) (5.6) (5.6) (5.9) (5.6) (5.4) (4.6) (4.8)
N 1,252 1,109 1,152 7,091 12,620 19,977 12,243 9,453 38,454 41,628
Notes: See Table 3a.
150
The
Journal
of
Human
mothers of five-year-olds with younger children experienced similar gains in employ-ment and hours over the same 30 year period, though their employemploy-ment levels were lower in each year, arguably due to the presence of younger children.
More generally, the ages and quantity of other children may affect labor supply decisions. The next panels of Tables 3a and 3b show trends in the number of children in different age groups and in other maternal demographic characteristics. Because these trends may underlie rising female labor supply (Blau 1998), my models control for maternal observables.15I show below that the funding initiatives do not strongly predict these maternal characteristics, so the primary consequence of adding these controls is to lower standard errors.
IV. Findings
A. Kindergarten Funding and Maternal Employment: Conventional Differences-in-Differences Estimates
My analysis begins with a model that is similar to the conventional DD specification:
yist¼usharest+x#istb+as+gt+e1ist; ð1Þ
whereyistrepresents employment or hours for motheriin statesin Census yeart;xistis
the vector of maternal characteristics described above; andasandgtrepresent state and
year fixed effects, respectively. Theasremove fixed differences across states in
em-ployment (for example, due to differences in norms), while thegtaccount for common employment shocks (for example, due to federal programs).sharestis the policy
vari-able described above, defined as the fraction of the two previous years (t- 1 andt- 2) that a kindergarten funding regime has been in place in states.16
The parameter of interest in Model 1 isu, the expected change in maternal em-ployment associated with having kindergarten funding in place for at least two years. It is important to note that a one-unit increase insharest does not necessarily mean
that a state went from having no kindergartens to universal availability. Instead, full implementation of the funding program, so defined, was associated with a 53.7 point percentage point increase in kindergarten supply.17Some localities operated kinder-garten programs before state funding was made available, and since kinderkinder-garten provision was not mandated, other districts may have taken more than two years to respond.uwill be identified by ordinary least squares (OLS) regression if funding
15. Specifically, all models include indicator variables for black and other race, a quadratic in maternal age, and quadratics in the number of children in the household between the ages of zero and four, age five, age six, between the ages of seven and 12, and between the ages of 13 and 17. I do not control for educational attainment, since this variable is not available for all women until 1960, and the estimation sample includes mothers from 1950.
16. Since the Census is taken in April, the relevant academic year begins the prior fall.
17. In a model including state fixed effects and year fixed effects estimated using data from 1966 (the first available year for kindergarten supply), 1969, 1979, and 1989, a one-unit increase insharestis associated
with a 53.7 percentage point increase in the share of a state’s school districts with kindergarten programs (standard error¼0.119). (Standard errors are clustered on state, and the regression is weighted by state pub-lic school enrollment in first grade.)
for kindergartens was not otherwise related to employment (or to the error term, e1ist), conditional on the fixed effects and observables.
The second column of Table 4a shows OLS estimates ofu for mothers whose youngest child was five years old at the time of the Census.18For single mothers (Panel A), kindergarten funding was associated with a 4.5 percentage point increase in employment during the prior week (Row a) and a 1.314 increase in weekly hours worked (Row b). Neither of these estimates is statistically significant. For married mothers (Panel B), both of these estimates are statistically significant, but imply that employment rates and hours worked fell as a result of the funding initiatives. Similar findings emerge for married mothers of five-year-olds with younger children, as shown in the same column and panel of Table 4b.
Given that some families received an income subsidy from the establishment of a public school kindergarten, a negative effect of kindergarten funding on maternal employment is theoretically possible. However, it seems implausible given that only 21–36 percent of married mothers were working prior to the initiatives (Column 1 of Tables 4a and 4b). Single women also exhibited positive (though insignificant) responses to kindergarten funding despite having higher preinitiative employment rates. A more reasonable explanation for the negative coefficient estimates is that OLS estimates of u from Model 1 are confounded by some unobserved correlate of kindergarten funding and employment.
To examine this possibility, I tested whether Model 1 uncovered effects of kinder-garten funding on employment and hours worked among womenwithout five-year-olds. As shown in Table 5, the average married mother whose youngest child was three or four years old (Panel B, Column 2) was a significant 3.1 percentage points less likely to be working and worked a significant 1.366 fewer hours per week after passage of a funding initiative. These coefficients are surprisingly similar to those observed for married mothers of five-year-olds, as well as for married women with-out five-year-olds, but with seven- or eight-year-olds and no younger children (Panel B, Column 5). They are also similar in magnitude to those observed for single moth-ers with seven- or eight-year-olds and no younger children (Panel A, Column 5). I have also estimated similar models for women without five-year-olds, but with chil-dren in these same age groups and younger. Here again, the estimates suggest that women with young children experienced a common, negative labor supply shock af-ter the initiatives were passed.19
These findings imply that conventional DD estimates yield downward biased esti-mates of the true causal effect of the funding initiatives on maternal employment. In particular, there appears to be some time- and state-varying unobservable that is pos-itively (negatively) correlated with the funding initiative, but negatively (pospos-itively) correlated with employment of women with children close to the margin of school
18. In these and all subsequent models, standard errors are consistent for heteroskedasticity and correlation of error terms within states over time. Because of the small number of clusters, I attempt to obtain tests of correct size by drawing a critical value from at-distribution with 22 (number of clusters less two) degrees of freedom (Cameron, Miller, and Gelbach 2006).
19. Among married mothers of seven- or eight-year-olds with younger children (but no five-year-olds), the coefficient (standard error) onsharestin the employment model is -0.038 (0.013) and in the hours model is
-1.509 (0.439). For married mothers of three- or four-year-olds with younger children (but no five-year-olds), these figures are -0.034 (0.011) and -1.057 (0.405), respectively.
Table 4a
Kindergarten Availability, Maternal Employment, and School Enrollment: Mothers of Five-year-olds with No Younger Children
Coefficient onshare*five
(Model 2) Comparison Group
Preinitiative Mean
Coefficient onshare
(Model 1)
(Has) 3- or 4-Year Old
(Has) 7- or 8-Year Old
Dependent Variable (1) (2) (3) (4) (5)
A. Single, no younger children
a. Worked last week 0.58 0.045 0.075** 0.060 0.069**
(0.033) (0.037) (0.037) (0.033)
b. Hours last week 21.85 1.314 2.777* 1.616 2.402*
(1.419) (1.429) (1.549) (1.287)
N 34,327 34,327 65,168 66,787
c. Child in public school 0.48 0.151*** 0.106** — 0.152**
(0.050) (0.048) (0.059)
d. Child in private school 0.12 20.050* 20.050* — 20.056*
(0.026) (0.025) (0.033)
N 35,322 35,322 — 68,827
B. Married, no younger children
a. Worked Last Week 0.36 20.032*** 20.013 20.001 20.011
(0.011) (0.015) (0.010) (0.011)
b. Hours last Week 12.66 21.259** 20.365 0.107 20.309
(0.461) (0.599) (0.368) (0.475)
N 120,673 120,673 226,088 230,368
c. Child in public school 0.43 0.153*** 0.140*** 0.145***
(0.035) (0.027) (0.032)
d. Child in private school 0.15 20.058** 20.056** — 20.057**
(0.022) (0.023) (0.021)
N 116,891 116,891 — 225,028
Cascio
Controls
Smoth state trends X
State*fivefixed effects X X
Year*fivefixed effects X X
Notes: Underlying data are from the 1950-90 Censuses for employment and the 1960-90 Censuses for school enrollment. Each entry in Panels A-B, Rows a-d, Columns 2-5 represents a coefficient from a different regression. In Rows a-b, the mother is the unit of observation; in Rows c-d, the child is the unit of observation. All regressions include state fixed effects, year fixed effects,five, and a vector of maternal background characteristics (indicator variables for black and other race, a quadratic in maternal age, and quadratics in the number of children in the household between the ages of 0 and 4, age 5, age 6, between the ages of 7 and 12, and between the ages of 13 and 17). Regressions in Columns 4 and 5 also include the interactions of these background variables withfive. Where noted, employment regressions include quadratic state trends, and enrollment regressions include linear state trends. All means and regressions are weighted by population weights, and standard errors are consistent for heteroske-dasticity and error correlation within states over time. ***, **, * denote statistical significance at the 0.01, 0.05, and 0.10 levels, respectively.
154
The
Journal
of
Human
Table 4b
Kindergarten Availability, Maternal Employment, and School Enrollment: Mothers of Five-year-olds with Younger Children
Coefficient onshare*five(Model 2) Comparison Group
Preinitiative Mean
Coefficient onshare (Model 1)
(Has) 3- or 4-Year Old
(Has) 7- or 8-Year Old
Dependent Variable (1) (2) (3) (4) (5)
A. Single, with younger children
a. Worked last week 0.43 20.010 20.027 20.021 20.022
(0.023) (0.037) (0.038) (0.044) b. Hours last week 15.19 20.236 20.855 20.094 0.098
(0.887) (1.543) (1.577) (1.622)
N 23,224 23,224 36,422 36,107
c. Child in public school 0.45 0.093** 0.072** — 0.081** (0.037) (0.032) (0.033) d. Child in private school 0.06 0.013 0.017 — 0.019
(0.023) (0.024) (0.022)
N 23,520 23,520 — 36,755
B. Married, with younger children
a. Worked last week 0.21 20.016 0.000 0.018 0.022
(0.010) (0.011) (0.013) (0.014) b. Hours last week 7.26 20.755** 20.016 0.301 0.754
(0.335) (0.415) (0.472) (0.510)
N 121,755 121,755 191,585 189,108
c. Child in public school 0.40 0.177*** 0.166*** — 0.167*** (0.040) (0.037) (0.038) d. Child in private school 0.13 20.056** 20.054** — 20.055**
(0.021) (0.021) (0.021)
N 107,394 107,394 — 169,514
Controls
Smoth state trends X
State*fivefixed effects X X
Year*fivefixed effects X X
Notes: See Table 4a. ***, **, * denote statistical significance at the 0.01, 0.05, and 0.10 levels, respectively.
Cascio
Table 5
Do the Funding Initiatives Predict Employment and School Enrollment in Nontreated Groups?
(Has) 3- or 4-Year Old (Has) 7- or 8-Year-Old
Preinitiative Mean
Coefficient onshare (Model 1)
Preinitiative Mean
Coefficient onshare (Model 1)
Dependent Variable (1) (2) (3) (4) (5) (6)
A. Single, no younger children
a. Worked last week 0.56 20.015 0.011 0.63 20.024 0.010
(0.018) (0.032) (0.021) (0.018) b. Hours last week 21.44 20.302 0.619 23.57 21.088 0.733
(0.668) (1.280) (1.139) (0.862) 30,841 30,841 32,460 32,460 c. Child in Public school — — — 0.911 20.001 0.003
(0.013) (0.018) d. Child in Private school — — — 0.047 0.006 0.001
(0.012) (0.016)
N — — 33,505 33,505
B. Married, no younger children
a. Worked last week 0.33 20.031** 20.020 0.40 20.021** 20.005
(0.013) (0.014) (0.010) (0.014) b. Hours last week 11.88 21.366*** 20.966* 14.05 20.950** 20.357
(0.456) (0.484) (0.410) (0.537)
N 105,415 105,415 109,695 109,695
c. Child in Public school — — 0.905 0.008 0.009 (0.008) (0.009) d. Child in Private school — — 0.068 20.001 20.004
(0.008) (0.008)
N — — 108,137 108,137
Controls
Smoth state trends X X
Notes: Underlying data are from the 1950-90 Censuses for employment and 1960-90 Censuses for school enrollment. Each entry in Panels A-B, Rows a-d, and Columns 2, 3, 5, and 6 represents a coefficient from a different regression. All regressions include state fixed effects, year fixed effects, and a vector of maternal background character-istics (see Table 4a). Where noted, employment regressions include quadratic state trends, and enrollment regressions include linear state trends. All means and regres-sions are weighted by population weights, and standard errors are consistent for heteroskedasticity and error correlation within state over time. ***, **, * denote statistical significance at the 0.01, 0.05, and 0.10 levels, respectively.
156
The
Journal
of
Human
entry. The next section presents estimates from two models that account for this un-observable in different ways.
B. Kindergarten Funding and Maternal Employment: Alternative Estimates
My first approach to uncovering consistent estimates is to add smooth state-specific trends to Model 1. Because a linear trend appears too restrictive for employment over a 40-year span, I include a state-specific quadratic in year.20My second approach is to estimate a DDD model on a sample that includes treated and nontreated mothers:
yist¼usharestfivei+u2sharest+x#istb1+ðxistfiveiÞ#b2 +a1s+a2sfivei+g1t+g2tfivei+e2ist
ð2Þ
wherefivei is an indicator for whether motherihas a five-year-old child. The
coef-ficient onsharestfiveiis the difference in Model 1 coefficients onsharestbetween the
treatment and comparison groups.21
The identifying assumptions differ across these models. With quadratic trends, Model 1 identifiesu if all unobserved determinants of maternal labor supply were trending smoothly over time within states. Columns 3 and 6 of Table 5 present sug-gestive evidence that this assumption is satisfied, as the coefficient onsharesttends to
be smaller and less likely to be significant for nontreated mothers in this specifica-tion. By contrast, Model 2 provides a consistent estimate ofuif no shocks coincided with the initiatives and affected only women with five-year-olds. Model 2 thus allows unobservable determinants of labor supply to trend in an unrestricted manner, as long as shared by mothers with and without five-year-olds. To make this assumption as plausible as possible, I restrict the comparison groups to mothers of three or four-year-old and seven- or eight-four-year-old children. I also limit the comparison groups to mothers with (without) children younger than the ages specified when estimating Model 2 for mothers with (without) younger children.22
The remaining columns of Table 4a present estimates ofufrom both of the alter-native models. For single mothers with a youngest child aged five (Panel A), esti-mates for employment and hours are larger in these alternative specifications. For example, in Model 1 with smooth trends (Column 3), kindergarten funding was as-sociated with a significant 7.5 percentage point increase in the likelihood of working and a marginally significant 2.78 more hours worked in the prior week. When com-pared to single mothers of seven- or eight-year-olds, these mothers were 6.9 percent-age points more likely to be working and worked a marginally significant 2.4 hours more per week as a result of the program (Column 5). In the version of Model 2 that
20. With a linear trend, I find stronger evidence of a relationship between the funding initiatives and em-ployment of mothers without five-year-olds, particularly married mothers.
21. An alternative, less restrictive version of Model 2 includes state-by-year fixed effects instead ofsharest.
These models yield estimates that are quantitatively quite similar to those presented below.
22. Thus, in Table 4a, the ‘‘seven- or eight-year-old’’ comparison group includes mothers whose youngest child is seven or eight. The DDD estimates based on this comparison group are then the difference in DD estimates shown in Column 2 of Table 4a and Column 5 of Table 5. In Table 4b, the ‘‘seven- or eight-year-old’’ comparison group includes mothers with seven- or eight-year-oldsandat least one younger child not of kindergarten age.
uses mothers of three or four-year-olds as a comparison group (Column 4), the coef-ficients are slightly smaller and not significant. However, they are statistically indis-tinguishable from those in Columns 3 and 5.
There are several ways to interpret the magnitudes of these estimates. When com-pared to preinitiative means (Column 1), estimates in Column 5 imply an 11 percent increase in hours and a 12 percent increase in employment. Given the estimated ef-fect of the initiatives on kindergarten supply, a lower-bound estimate of the childcare price elasticity for this subpopulation is then -0.22.23Using the estimated effect of funding on enrollment and assuming 100 percent takeup of new kindergarten seats, I calculate an upper-bound elasticity of -0.79.24These elasticity estimates are within the realm of those previously found in the broader literature on childcare costs (see Anderson and Levine 2000; Blau 2003; Blau and Currie 2006).
Another way of interpreting the estimates is to calculate the effect of enrollment—or use of the subsidy—on maternal employment. This can be done using estimates of the effect of kindergarten funding on public schooling of five-year-olds, shown in Row c of Panel A.25By this measure, at least four single mothers with no children younger than age five entered the work force for every ten additional children enrolled in public school as a result of the initiatives, based on the estimates presented in Column 5 (0.069/0.1520.45). Enrollment of the average single mother’s youngest child in pub-lic school also allowed her to work around 16 more hours per week (2.402/0.15215.8). Together, these estimates are consistent with the marginal single mother with no youn-ger children entering the work force on roughly a full-time basis.26Such an effect size is plausible, given that a significant fraction of the gain in public school enrollment among five-year-olds over the period of interest was in full-day programs (Figure 1).
It is highly unlikely that married mothers with five-year-olds and no younger chil-dren (Table 4a, Panel B) responded so strongly to the increase in kindergarten supply. For example, in estimates of Model 2 shown in Column 4, kindergarten funding was associated with a 0.1 percentage point decline in employment (Row a) and a 0.107 increase in weekly hours (Row b) of the typical mother in this group. This suggests that mothers of three- and four-year-olds and mothers of five- and six-year-olds ex-perienced indistinguishable changes in labor supply after the introduction of a kin-dergarten funding initiative. Estimates from the other specifications (Columns 3 and 5) are negative, but close to zero and also not statistically significant. Upper-bound 95 percent confidence intervals on these estimates yield Upper-bounds on the child-care price elasticity of employment that barely overlap with those calculated above
23. Assuming that 53.7 percent of mothers received a 100 percent subsidy for childcare on the extensive employment margin, the childcare price elasticity of employment would be approximately -0.22 (12/-53.7). 24. The policy variable predicted a 15.2 percentage point increase in the public school enrollment of five-year-olds with single mothers and no younger siblings (Table 4a, Panel A, Column 5). Assuming that 15.2 percent of mothers received a 100 percent subsidy for childcare on the extensive employment margin, the childcare price elasticity of employment would equal approximately -0.79 (12/-15.2).
25. This coefficient is less than half of that found when the public school kindergarten-to-first grade enroll-ment ratio is used as a dependent variable (Cascio 2007). This is expected, since about half of five- and six-year-olds were not eligible for the program, and some may have substituted public kindergartens for other public school programs.
26. Suppose that the marginal single woman worked full time, and there was no effect on hours for women already working. Then the implied effect the program on hours worked would be between 15.75 (0.45*35) and 18 (0.45*40).
for single mothers. For example, using the upper bound on the employment estimates shown in Column 4 and the smallest estimated impact of the initiatives on public school enrollment (Column 3), I calculate that this elasticity lies between -0.1 (0.053/ 0.537) and -0.38 (0.053/0.140). The true effect of enrollment on employment among for this group is also highly unlikely to exceed 0.14 (0.019/0.140)—an effect size more than three times smaller than that found for single mothers with no chil-dren younger than age five.27
That the implied effect on employment of increasing kindergarten supply is con-siderably smaller for married mothers is not necessarily surprising. Previous studies have also found childcare costs to have relatively large effects on employment of sin-gle mothers (Anderson and Levine 2000; Han and Waldfogel 2001; Connelly and Kimmel 2003). As well documented for more recent years, the fraction of family in-come devoted to childcare is also much higher for single women (Anderson and Lev-ine 2000; Blau and Currie 2006; Rosenbaum and Ruhm 2007). The same appears to have held during the period of interest, suggesting that the introduction of kindergart-ens would have been a more intkindergart-ensive intervention for single mothers.28
Similarly, mothers whose youngest child was five would have experienced a rela-tively large reduction in childcare costs, regardless of marital status. If anything, es-timated labor supply responses to the funding initiatives should thus be smaller for mothers who have both five-year-olds and younger children, as noted above. Col-umns 3 through 5 of Table 4b give findings from specifications that mirror those shown in the same columns of Table 4a. For single mothers with five-year-olds and younger children (Panel A), coefficients onsharest andsharestfivei in the
em-ployment and hours regressions fluctuate between slightly negative and zero and are never statistically significant. The estimates are noisy, however, so it is impossi-ble to rule out the effect sizes observed for other single mothers with five-year-olds in the DDD specifications.29For married mothers in this group, coefficients tend to be positive, but none are statistically significant. I also cannot rule out that they are iden-tical to those for other married women or for single women with children younger than age five.
C. Kindergarten Funding and Private School Enrollment
The funding initiatives should only have affected maternal labor supply if new kin-dergarten programs represented a shock to the price of childcare. Though data on
27. However, I reject equality of coefficients onsharestfor single and married mothers of five-year-olds
without younger children only in the specification shown in Column 3. For the estimates presented in Col-umn 5, thep-value on this test is 0.184 for employment and 0.206 for hours worked.
28. Using data on formal childcare costs from Coelen, Glantz, and Colore (1979), Gelbach (2002) con-cludes that availability of half-day kindergarten would have provided at least a 12.5 percent increase in the typical single (working) mother’s effective hourly wage in 1980, provided that she would have paid for center-based childcare. In early 1975, nearly a quarter of working mothers (and nearly a third of full-time working mothers) used formal day care or care from a nonrelative when their five-year-olds were notin school (Waite 1976). And in the late 1970s, well over half of working mothers with young children paid for care by other relatives, the most common alternative (Lueck, Orr, and O’Connell 1982). 29. With quadratic trends, Model 1 coefficients onsharestare statistically different for single mothers of
five-year-olds with and without younger children (p-value¼0.031 for employment andp-value¼0.098 for hours).
childcare use, cost, and quality are very limited for the sample period, indirect evidence of a price change can be deduced from changes in the enrollment of five-year-olds in private (presumably fee-based) schools, which were arguably sim-ilar in quality to new public programs. These estimates are also independently inter-esting, as a universal education or childcare program may be less socially desirable if it provides services that a large fraction of parents can already afford.
Row d of each panel of Tables 4a and 4b presents estimates from Models 1 and 2 where private school enrollment is the dependent variable. As shown in Panel A of Ta-ble 4a, there was a 5–6 percentage point reduction in the private school enrollment rates of five-year-olds with single mothers and no younger siblings after the funding initia-tives. This effect represents roughly half of the preinitiative fraction of children in pri-vate school (Column 1). Given the 11 to 15 percentage point increase in public school enrollment (Row c), it also suggests that one child left private school for every two to three additional public school enrollees. A slightly smaller, but still significant degree of substitution between private and public programs also appears for children in intact families, as shown in the lower panels of Tables 4a and 4b, with three to four children foregoing private schooling for every ten additional children enrolled in public school. Thus, married mothers did respond significantly to the change in childcare prices asso-ciated with new public kindergartens, even if not by increasing their labor supply.
V. Robustness
Thus far, I have detected labor supply responses for a subpopulation that should have experienced the largest percentage increase in its take-home earn-ings with the establishment of public school kindergarten. Within each subpopulation under consideration, estimates from Model 1 (with trends) and Model 2 also yield similar findings. I have also found evidence of private-school crowd-out, which sug-gests that the funding initiatives generated an increase in kindergarten supply that overwhelmed any positive shock to kindergarten demand that may have brought about their enactment. This section examines whether the funding initiatives were in fact exogenous and discusses the results from several additional robustness checks.
A. Was Kindergarten Funding Exogenous?
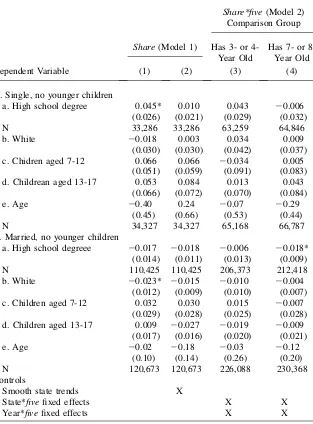
As noted, the models estimated above only identify the effect of raising kindergarten supply if the funding initiatives were not related to other factors affecting employ-ment of women with five-year-old children. I cannot unequivocally demonstrate that this assumption is satisfied. However, finding significant relationships between the funding initiatives andobservablecorrelates of employment would strongly suggest that my estimates are biased.
comparison mothers also tend to be similar in magnitude and not statistically differ-ent from one another (Columns 3 and 4).30In general, coefficients are also small in magnitude relative to the strong trends in many of these observables over the sample period (Table 3a). This same finding holds when I consider mothers of five-year-olds with younger children (results not shown). The initiatives also do not predict a wom-an’s marital status or the presence of younger children, suggesting that the estimates presented above are not biased by sample selection.31
If the funding initiatives were exogenous, one would also expect maternal employ-ment not to diverge from trend before the initiatives are passed. I therefore next reesti-mated Model 1 including an indicator,prest, equal to one in the Census year prior to the
initiative. Formally, the coefficient on this variable gives the predicted difference in em-ployment between two observationally similar mothers of five-year-olds, one of whom resided in a state about to subsidize public school kindergarten; intuitively, it gives the effect of the initiative on the employment of treated mothers before it is put in place. I also reestimated Model 2 withprestand its interaction with the treatment group dummy, prestfivei. Here, the coefficient of interest is onprestfivei, which gives the difference
be-tween treatment and comparison mothers in these ‘‘placebo’’ effects.
Table A2 shows these coefficients—once again focusing on the subpopulation of mothers without children younger than age five—along with the coefficients on
sharestandsharestfivei, as appropriate, from the same regressions. There are few
sig-nificant deviations in maternal employment from its predicted level in the year imme-diately preceding an initiative. Where there are significant deviations for single mothers—the only group for which I have found a significant labor supply response— they are positive. With the preinitiative variables included, the estimated effect of kin-dergarten funding on their labor supply also tends to be larger (Panel A, Columns 2 and 4).32These estimates do appear to represent a divergence from trend: When I estimate similar models that substitute an indicator for the Year 2 Censuses prior to an initiative forprest, the coefficient on this variable tends to be closer to zero and not statistically
significant.33This is an important result, as existing studies on other countries have gen-erally derived variation from preschool expansions in areas that have low ex ante levels of maternal employment and few years of preinitiative data. In these cases, the bias might work in the opposite direction, leading to overstatement of the effect of public schooling on labor supply.
B. Alternative Policy Variables
As noted, Census data are available only every ten years, making it impossible to ex-ploit the exact timing of all kindergarten funding initiatives in the treated region. I
30. It is therefore not surprising that when all models described above are estimated without controls, the estimates are less precise but very similar in magnitude to those reported.
31. Specifically, I tested whethersharestin Model 1 predicted marital status, the presence of younger
chil-dren, marital status conditional on the presence of young chilchil-dren, and the presence of young children con-ditional on marital status. For both treatment and comparison mothers, the estimated coefficient onsharest
was always very small in magnitude and not distinguishable from zero.
32. This is also true for single mothers with younger children, though the estimated effect of funding remains imprecise.
33. Models withprestand this variable entered simultaneously yield estimates with the same implication.
However, the estimates are noisy.
justified construction ofsharestby noting that there may have been a one-year lag in
takeup of the subsidy for exogenous reasons. However, if supply-side constraints on kindergarten provision were not resolved very quickly, it may be possible to exploit more variation in timing. On the other hand, I cannot rule out that the lags in takeup were related to demand. Table A3 shows how the estimates for women with no chil-dren younger than age five change whensharestis replaced with the fraction of the
prior three or four years that state kindergarten funding has been available and a sim-ple post-initiative indicator. For single mothers (Panel A), coefficient estimates in both the employment and enrollment models tend to rise with the number of years over which the policy variable is averaged. However, using the metrics introduced above, effect sizes are quite similar to those found above regardless of the policy measure employed.34The estimates also consistently point to no positive employ-ment response among married mothers (Panel B). The implied effect sizes for moth-ers with younger children (results not shown) are also not greatly changed with the use of alternative policy variables.
C. Other Policies Affecting Childcare Costs
A final concern about the estimates is that subsidies for kindergarten were correlated with the introduction of other programs that lowered childcare costs for mothers of five-year-olds. One candidate program is pre-kindergarten. Although pre-kindergarten programs serve four-year-olds, my estimates could be picking up their effect on ma-ternal labor supply if women tend to stay in the labor force once their children enter school. Only seven treated states funded pre-kindergarten during the sample period, and the resulting programs appear to have served a small fraction of children who would have been served by public school kindergarten.35This suggests that the omis-sion of a control for pre-kindergarten funding likely had little effect on the estimates presented in Tables 4a and 4b. To investigate this directly, I reestimated all models controlling for an indicator for whether treated children would have been eligible to attend state-funded pre-kindergarten; in Model 2, I also controlled for the interac-tion between this variable andfivei. Model 1 estimates tended to be similar in
mag-nitude, but a bit less precise, with this control added, and Model 2 estimates were virtually unchanged.
VI. Conclusions
This paper has examined how the introduction of state funding for public school kindergartens in the 1960s, 1970s, and 1980s affected maternal
34. For instance, the indirect effect of enrollment on employment ranges between 0.31 and 0.41 in the DDD models; for weekly hours, these estimates range between 8.4 and 15.1.
35. These states were Florida (1978), Maryland (1978), New Hampshire (1988), Oklahoma (1978), Oregon (1987), South Carolina (1984), and Texas (1984). (These dates were downloaded from http://www.ecs.org.) In all of these states except Texas and Maryland, the public school pre-kindergarten-to-kindergarten ratio averages less than 0.06 between 1979 (the first year that pre-kindergarten enrollment is separately reported by state) and 1989. In Texas and Maryland, this ratio averages 0.16 and 0.17, respectively, over this period. (These are the author’s calculations based on state enrollment data described in Appendix 1.)
employment. The employment of some single women—specifically those whose youngest children were age-eligible—appears to have been highly responsive to the childcare subsidy implicit in new kindergarten programs. This basic finding is maintained when I control for smooth, state-specific trends or when I account for state employment shocks using mothers of young children without five-year-olds as a comparison group. I have improved upon recent literature in this area by employing a very large data set, which has yielded ample preinitiative data and nar-rowly defined comparison groups, and by performing a number of specification checks that have been generally been neglected.
This paper also provides an alternative set of estimates to Gelbach (2002), the seminal work examining how public kindergartens have affected maternal labor sup-ply in the United States. While my estimates for married women are consistent with effects of the magnitude that Gelbach finds in the 1980 cross-section, they are also consistent with no employment impact for this group. Gelbach also finds employ-ment effects of kindergarten eligibility for single and married women that are quite comparable in magnitude to each other and smaller than those found here. The differ-ences in our findings could result if the parameter of interest were not constant over time. I have uncovered suggestive evidence that this is the case by applying Gel-bach’s estimation strategy to earlier years of Census data. In particular, I estimated the effect of a five-year-old’s public school enrollment on maternal employment for each of 1960, 1970, and 1980, using quarter of birth dummies as instrumental vari-ables for enrollment. The two-stage least squares estimates tend to be relatively large, particularly for single women, in 1960.36
Unfortunately, the data do not exist to perform a similar exercise for more recent years. However, the different economic environments that underlie Gelbach (2002) and the present study are useful for contemplating the applicability of my findings to the current policy setting. In the 1960s, cash welfare was much less generous than it would later become and remain through the 1990s (Moffitt 2003). Under such con-ditions, entering the labor force may have been considerably more desirable than remaining on welfare, particularly once all of a woman’s children were enrolled in school. Today, single mothers may also be relatively responsive to the childcare sub-sidy implicit in public schooling, not because benefits are low, but rather because they are contingent on securing employment (Blau and Tekin 2007). By the same token, though, more women today on the margin of needing public assistance already work, suggesting that the employment impact of modern-day schooling expansions for single women may be substantially lower than that found here.
There are other reasons to be hesitant to generalize from this study’s findings. Re-gardless of marital status, more American mothers today already work. Even if the preferences of mothers with five-year-olds had remained constant or were compara-ble today, women with three- and four-year-old children—the target population of
36. See Appendix 2 for a description of the sample and model. The TSLS estimates for my 1980 sample are slightly smaller than those found by Gelbach and not statistically significant for single women. In 1970, the only (marginally) significant estimates are for married mothers of five-year-olds with younger children. However, in 1960, labor supply responses for single women appear much stronger, with public school en-rollment of a five-year-old estimated to generate a 22 to 34 percentage point increase in employment and an additional 8.5 to 16.1 hours of work per week. Estimated effects for married women with children younger than the age of five are also a bit larger relative to later Census years.
recent pre-kindergarten expansions—may also behave differently when faced with the same constraints and choice sets. More research is needed to understand how mothers today change their employment in response to these programs.
Finally, and perhaps most importantly, while public schooling for young children may involve an efficiency loss—crowding out comparable private care that is afford-able for many families—there is a case to be made for expanding such programs on equity grounds. Indeed, public school programs for young children are generally estab-lished in the hopes of promoting school readiness in populations where it is lacking.37 In the context of the present study, for example, many children would have lacked an early education experience in the absence of kindergarten expansion and would have been less productive adults (Cascio 2007). Whether the benefits of a universal program exceed the costs is therefore a question that this study alone cannot address.
Appendix 1
Data on Kindergarten Supply and Enrollment
Data on grade span were used to construct the fraction of districts offering kindergarten programs. These data were drawn from both published state tabulations (1967–68 to 1970–71) and computer-coded microdata (1972–73 to 1990–91), each file of which was downloaded from ICPSR.38To create the longest possible consistent series, the published tabulations of grade span for 1967–68 through 1970–71 were replicated us-ing the microdata for later years. Specifically, for each state and year, the fraction of primary school districts offering kindergarten was coded as the sum of operating tricts offering kindergarten (K-6, K-8, K-9, and K-12) over the sum of operating dis-tricts offering kindergarten or first grade (K-6, K-8, K-9, K-12, 1-6, 1-8, 1-9, and 1-12). In years when grade span data was not available (1971–72, 1974–75, and 1984–85), the rate of kindergarten availability was estimated through linear interpolation.
Starting in 1967–68, comparable data on enrollment are supposedly given in the
prior year’s version of the publication from which I draw enrollment aggregates
(see below). However, instructions for completing the relevant survey form (Appen-dix A in published versions of the data from 1971–72 forward) indicate that a state is to update its grade span (but not necessarily project its enrollment) for the current (reported) academic year. It is unclear whether all districts updated their grade span in this way, or if the updates were indeed reflected in the microdata. As a result of this uncertainty, I lag the kindergarten availability series by one year. Thus, the series discussed above spans the academic years 1966–67 through 1989–90.
The state-by-grade enrollment aggregates used at various points in this paper were taken from several administrative sources. Data on a yearly basis from
37. Intensive early education programs have been found to have both short- and long-term benefits for chil-dren (Barnett 1995; Karoly et al. 1997; Currie 2001).
38. Published state-level tabulations of grade span are fromEducation Directory: Public School Systems (1967-68) and Elementary and Secondary Education Directory: Public School Systems (1968-69 to 1970-71). District-level data are available at ICPSR for various academic years from 1972-73 forward: 1972-73 to 1979-80, not including 1974-75, are ICPSR #2125 through #2131; 1980-81 to 1985-86, not in-cluding 1984-85, are ICPSR #2132 through #2136; and 1986-87 to 1990-91 are ICPSR #2423, #2424, #6904, #2427, and #2430, respectively.
Table A1
Do the Funding Initiatives Predict Characteristics of Mothers with Five-year-olds?
Share*five(Model 2)
Comparison Group
Share(Model 1) Has 3- or
4-Year Old
Has 7- or 8-Year Old
Dependent Variable (1) (2) (3) (4)
A. Single, no younger children
a. High school degree 0.045* 0.010 0.043 20.006 (0.026) (0.021) (0.029) (0.032)
N 33,286 33,286 63,259 64,846
b. White 20.018 0.003 0.034 0.009
(0.030) (0.030) (0.042) (0.037)
c. Chidren aged 7-12 0.066 0.066 20.034 0.005
(0.051) (0.059) (0.091) (0.083) d. Childrean aged 13-17 0.053 0.084 0.013 0.043
(0.066) (0.072) (0.070) (0.084)
e. Age 20.40 0.24 20.07 20.29
(0.45) (0.66) (0.53) (0.44)
N 34,327 34,327 65,168 66,787
B. Married, no younger children
a. High school degreee 20.017 20.018 20.006 20.018* (0.014) (0.011) (0.013) (0.009)
N 110,425 110,425 206,373 212,418
b. White 20.023* 20.015 20.010 20.004
(0.012) (0.009) (0.010) (0.007) c. Children aged 7-12 0.032 0.030 0.015 20.007
(0.029) (0.028) (0.025) (0.028) d. Children aged 13-17 0.009 20.027 20.019 20.009
(0.017) (0.016) (0.020) (0.021)
e. Age 20.02 20.18 20.03 20.12
(0.10) (0.14) (0.26) (0.20)
N 120,673 120,673 226,088 230,368
Controls
Smooth state trends X
State*fivefixed effects X X
Year*fivefixed effects X X
Notes: Underlying data are from the 1960-90 Censuses for educational attainment and from the 1950-90 Censuses for all other variables. Each entry in Panels A-B, Rows a-e, and Columns 1-4 represents a coefficient from a different regression. All regressions include state fixed effects, year fixed effects, andfive. In Column 2, regressions for edu-cational attainment include linear state trends; for all other variables, quadratic state trends are included. Regressions are weighted by population weights, and standard errors are consistent for heteroskedasticity and error correlation within state over time. ***, **, * denote statistical significance at the 0.01, 0.05, and 0.10 levels, respectively.