A Simple Photometer and Chemometrics Analysis for Quality
Control of Sambiloto (
Andrographis Paniculata
) Raw Material
Rudi Heryanto,1,2* Derry Permana,1 Aryo Tedjo,3 Eti Rohaeti,1,2 Mohamad Rafi,1,2 and Latifah K. Darusman,1,2
1
Department of Chemistry, Faculty of Mathematics and Natural Sciences, Bogor Agricultural University, Jl. Tanjung, Kampus IPB Dramaga, Bogor 16680, Indonesia
2
Tropical Biopharmaca Research Center, Bogor Agricultural University, Jl. Taman Kencana No. 3 Kampus IPB Taman Kencana, Bogor 16128, Indonesia
3
Department of Medical Chemistry, Faculty of Medicine, University of Indonesia, Jl. Salemba Raya No. 4, Kampus UI Salemba, Jakarta 10430, Indonesia
*
Corresponding email: [email protected]
Received 29 July 2017; Revised 26 August 2017; Accepted 29 August 2017
ABSTRACT
In this paper, we described the use of a light emitting diode (LED)-based photometer and chemometric analysis for quality control of king of bitter or sambiloto (Andrographis paniculata) raw material. The quality of medicinal plants was determined by their chemical composition. The quantities of chemical components in medicinal plants can be assessed using spectroscopic technique. We used an in-house photometer to generate spectra of
sambiloto. The spectra were analyzed by chemometric methods, i.e. principal component analysis (PCA) and partial least square discriminant analysis (PLS-DA), with the aim of herbal quality classification based on the harvesting time. From the results obtained, based on thin layer chromatography analysis, sambiloto with different collection times (1, 2, and 3 months) contained different amounts of active compounds. Evaluation of sambiloto, using its spectra and chemometric analysis has successfully differentiated its quality based on harvesting time. PCA with the first two PC’s (PC-1 = 60% and PC-2 = 35%) was able to differentiate according to the harvesting time of sambiloto. Three models were obtained by PLS-DA and could be used to predict unknown sample of sambiloto according to the harvesting time.
Key word: sambiloto, Andrograpis paniculata, photometer, chemometrics
INTRODUCTION
There is increasing trend globally for the use of bio-resources products, in particular, herbal medicines for diseases treatment or prevention. In Indonesia, the use of herbal medicines or jamu has been practiced throughout history. Currently, there are almost 5,310 jamu products available on the market. These products are derived from more than 500 medicinal plants [1].
quality [2]. Therefore, introducing raw material analysis and classification procedure for the farmers will alleviate the problem of payment solely by weight, and the implementation of such measures will eventually increase the farmer’s revenue. Therefore, it is important to develop simple quality control tool to be applied by the farmers.
Commonly, the quality control of medicinal plant from raw materials is performed using chromatographic techniques, such as high-performance liquid chromatography (HPLC), gas chromatography (GC), and thin layer chromatography (TLC) [3-5]. These techniques will generate fingerprint chromatograms, which characterize materials by showing specific chemical compounds contained in the extracts [6]. Spectroscopic techniques also can be employed to check quality of herbal raw materials [4]; and offer some advantages compare to chromatographic techniques, such as simpler and easier to use. Several studies have been reported using spectroscopic methods for determining quality control of medicinal plants [7-9]. The instruments used are typically FTIR or UV-Vis spectrophotometer. However, these tools are costly and not easy to operate in the field. Therefore, in this study, we build an in-house portable photometer using electronic parts that were locally available. The photometer utilizes light emitting diodes (LED) as radiation sources, light dependent resistors (LDR) as transducers, and a voltmeter as readout and display. This photometer has been used for classification of cancerous and healthy skin tissue [10].
In this study, the ability of the photometer to check the optical properties of samples which obtained from sambiloto (Andrographis paniculata) of different quality levels (harvesting time) was tested. Sambiloto is well known for its anticancer, antidiabetic, antipyretic, and antibacterial activity [11]. The data obtained using from the photometer was then evaluated using pattern recognition techniques, namely Principle Component Analysis (PCA) and Partial Least Square Discriminant Analysis (PLS-DA). PCA was used to perform classification pattern according to the harvesting time of sambiloto, whereas PLS-DA was used to build a predictive model that can be utilized for the classification of unknown samples.
EXPERIMENT Chemicals
All chemicals and solvents were analytical grade and obtained from Merck (Darmstadt, Germany), they were used without further treatment. Dried material samples of sambiloto were cultivated and collected from Conservation and Cultivation Unit of Tropical Biopharmaca Research Center, Bogor Agricultural University, Indonesia. Samples were collected at different harvesting times (1 month (Q1), 2 months (Q2) and 3 months (Q3) after planting) that represent different chemical quality levels.
Procedure TLC Analysis
One gram of dried sample powder was macerated using 10 mL ethanol for 3 hours. After filtering the mixture, solvent from filtrate was removed using rotary evaporator. A total of 0.1 g of the extract was dissolved in 5 mL of ethanol. An aliquot was spotted onto silica gel F254 plates using a Linomat 5 (Camag, Muttez, Switzerland). The TLC plate was
Measurement of the Optical Properties of the Samples
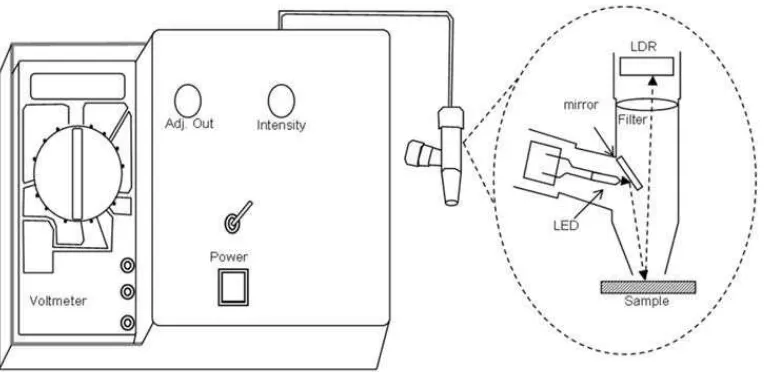
The optical properties of the samples were measured using a photometer (Figure 1) as employed by Zain et al. [10].. Firstly, 400 mg of dried sample powder was formed into a solid pellet. Before the sample analysis, the intensity of the photometer was adjusted using a standard white color. The sample was placed in the bottom of the optical probe, and measurement results (in V) appeared immediately on the voltmeter display. The photometer measured three types of samples (Q1, Q2, and Q3), with ten replicates for each sample. In order to extend the variability of optical properties of the samples, measurements were also carried out using different LED sources and different filters. The photometer used UV LED, blue LED, red LED, and 17 different filters. There was a total of 51 measurements for each sample carried out by the photometer.
Figure 1. Schematic diagram of in-house photometer.
Chemometric Analysis
The data collected was tabulated as shown in the Supplementary information. In order to explore the variation patterns of material quality based on its chemical composition, PCA analysis was performed using Unscrambler 9.7 software [13]. A model for the following prediction was generated by PLSDA analysis, using the same software.
RESULT AND DISCUSSION
Chemical Profiling using TLC
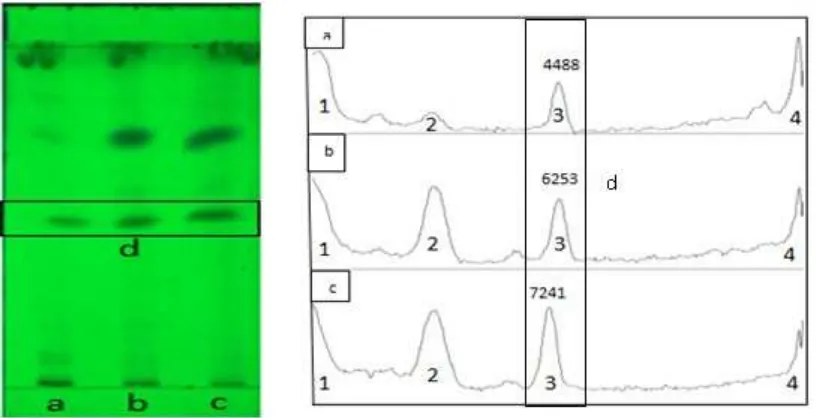
The TLC chromatogram shows the variability of the chemical profiles of the samples in Figure 3. All of samples resulted in similar TLC profiles (number of spots), but with different spot intensities. From the TLC chromatogram, spot intensities were correlated with compound concentrations. Image transformation from each chromatogram was performed using ImageJ software to produce more detailed chemical quality comparison between samples. One spot in the chromatogram, in Rf value of 0.58, was characterized as
andrographolide (Figure 2). Andrographolide is one of the most abundant active compounds found in sambiloto, and usually, it is used as a marker compound. This compound is a diterpene lactone and caused the bitter taste of sambiloto [14,15]. The densitogram showed that the Q3 sample has more andrographolide compared to the others. A study conducted by Pandey and Mandal [16] showed that the highest concentrations of andrographolide were found in sambiloto at the age of 3-4 months after planting when 50% of the crop starts to flower.
Figure 2. The chemical structure of andrographolide
Classification of sambiloto by PCA
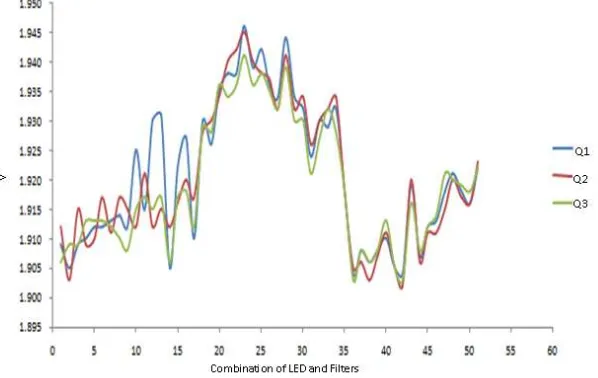
Thirty samples of dried material of sambiloto were measured using the photometer. Three LED and 17 filters were used to measure the optical properties of each sample. In total, there were 30 x 51 matrix data results in this experiment. Figure 4 showed an example of the curve plot of the data. Pattern of the curve seems similar for the different harvesting times. The differences were shown from the absolute value of the measurements. Singh et al. [4] explained that samples from the same species or family would have same spectral pattern. The differences will be seen from the peak intensity from each sample. Therefore, pattern recognition like PCA is needed to depict the differences between samples.
Figure 4. Data curve from photometer measurement. In x axis, the numbers 1-17 represent data measurement using UV LED and 17 filters, 18-34 was for blue LED and 17 filters, and 35-51 was for red LED and 17 filters.
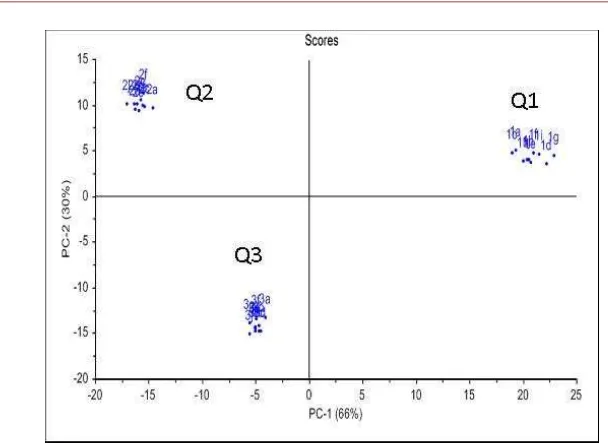
Figure 5. Plot score of the first two principal components, PC1 represents 66% of the variation of the data and PC2 represents 30% of the variation of the data.
Quality Prediction Model by PLS-DA
For identification of the quality of unknown samples, a prediction model of the data was generated using PLS-DA. PLS-DA is a supervised recognition technique and used for classification of the priority given classes of objects. Furthermore, PLS-DA is a regression extension of PCA, which develops a calibration model from the two data matrices. Matrix X is the predictor matrix that contains the original data derived from sample measurements and matrix Y is the response matrix which is usually consist of dummy variables from the class of the objects (1 represents “belongs to the class” and 0 represents “not”). Then, PLSDA calculates scores of the X and Y matrix and uses them to create regression models between these values [8].
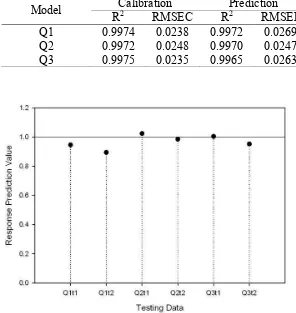
Table 1 The goodness of fit parameters from PLS-DA calibration and prediction model
Model Calibration Prediction
R2 RMSEC R2 RMSEP
Q1 0.9974 0.0238 0.9972 0.0269 Q2 0.9972 0.0248 0.9970 0.0247 Q3 0.9975 0.0235 0.9965 0.0263
Figure 6. Response values of testing dataset (Reference value is 1).
CONCLUSION
The chemical composition and quality of medicinal plant raw materials were influenced by planting age of the plants. The research demonstrated that in-house photometer, combined with pattern recognition techniques, successfully used to classify sambiloto raw materials with different chemical quality levels.
ACKNOWLEDGMENT
The authors gratefully acknowledged the financial support of this research by the Penelitian Unggulan Perguruan Tinggi Research Grant 2014 from Ministry of Research, Technology and Higher Education, Republic of Indonesia.
REFERENCES
[1] Afendi FM, Okada T, Yamazaki M, Hirai-Morita A, Nakamura Y, Nakamura K, Kanaya S,2012, Plant Cell Physiol., 53(2), e1(1-12).
[2] Torri MC, 2012, J. Entrep., 21, 59-90.
[3] Rafi M, Wulansari L, Heryanto R, Darusman LK, Lim LW, Takeuchi T, 2015, Food Anal. Methods, 8(9), 2185-2193.
[4] Singh SK, Jha SK, Chaudhary A, Yadava RDS, Rai SB, 2010, Pharm. Biol., 48, 134-141.
[7] Li M, Zhou X, Zhao Y, Wang DP, Hu XN, 2009, Bull. Korean Chem. Soc., 30, 2287-2293.
[8] Lucio-Gutiérrez, JR, Coello J, Maspoch S, 2011, Food Res. Int., 44, 557-565.
[9] Rohaeti E, Rafi M, Heryanto R, Syafitri UD, 2015, Spectrochim. Acta Part A: Mol. Biomol. Spectrosc., 137, 1244-1249.
[10] Zain, H., Tedjo, A., Kusmardi, 2007, Makara Kes., 11, 69-75. [11] Jarukamjorn K, Nemoto N, 2008, J. Health Sci., 54, 370-381.
[12] National Institutes of Health. ImageJ software. https://imagej.nih.gov/ij/index.html. Accessed date 2 August 2016.
[13] CAMO. The Unscrambler 9.7. http://www.camo.com. Accessed date 23 September 2014.
[14] Akowuah GA, Zhari I, Norhayati I, Mariam A, 2006, J. Food Comp. Anal., 19, 118-126.
[15] Rafi M, Nurasiah E, Darusman LK, Syafitri UD, 2014, Indo. J. Pharm., 25(3), 145-152.
[16] Pandey AK, Mandal AK, 2010, IJEE, 1, 165-169.
[17] Miller JC, Miller JN, Statistics and Chemometrics for Analytical Chemistry, 6th ed.,
2010, Pearson Education Limited, Harlow.
[18] Brereton, RG, Chemometrics: Data analysis for the laboratory and chemical plant,