The Effect of Phosphatation and Granulation Zeolite in the
Adsorption of Cr(VI)
Sri Wardhani*, Danar Purwonugroho, Reno Sunarinda Endrayana
Department of Chemistry, Faculty of Mathematics and Natural Sciences, Brawijaya University
*
Corresponding email : [email protected] Email author 1: [email protected]
Email author 2: [email protected]
Received 6 July 2017; Revised 5 August 2017; Accepted 21 August 2017
ABSTRACT
This research was aimed to study the effect of contact time on adsorption of Cr(VI) using Granules Alumino Silico Phosphate (GASP) and to determine the adsorption capacity of GASP. The GASP synthesis process was carried out in several main stages: 1) activation of zeolite with addition 0.4 M HCl, 2) Zeolite phosphatation by addition of NH4H2PO4 ratio
Si/P = 1/6 at 235ᴼC for 5 hours, 3) Granulation of phosphated zeolite using chitosan to afford the GASP. The GASP was characterized using XRF, FT-IR and SAA. The contact time effects was tested using 0.1 g of GASP in K2CrO4 100 mg/L and the contact time
variation of 0.5; 1.0; 1.5; 2.0 and 2.5 hours. The result of the research showed that the optimum contact time occurred for 2 hours. The concentration effect on adsorption capacity was tested out using 0.1 g of GASP in K2CrO4 and the concentration variation of
25, 50, 75, 100 and 150 mg/L for 2 hours. The adsorption capacity can be determined using the Langmuir equation. XRF characterization results showed an emergence of P2O5 34.70
% and decrease in SiO2 levels of 18.10% and Al2O3 by 2.2% after phosphatation process.
The result of characterization by FTIR indicated the success of the phosphatation process as evidenced by the shift of wavenumber to the lower region of tetrahedral silica and alumina uptake was shifted to wavenumber the region of tetrahedral phosphate uptake in accordance with Hooke's law. Characterization results by SAA showed increased surface area, pore volume and pore count after phosphatation process. The concentration variation was directly proportional to the increase of the adsorbed Cr(VI) mass. The presence of phosphatation and granulation process can increase the value of adsorption capacity by 48.077 mg/g on GASP rather than 15.601 mg/g on active zeolite
Key words: adsorption capacity, ASP, concentration, contact time, Cr(VI), granulation, phosphatation
INTRODUCTION
Nowadays, tannery industry still generates a lot of liquid waste discharged into the aquatic environment. The liquid waste contains a chromium (Cr) compound in the form of chromium sulfate (Cr2(SO4)3). High levels of Cr2(SO4)3 of 60-70% is not entirely absorbed by
The journal homepage www.jpacr.ub.ac.id 208 can be improved by activation using strong acid and modification of zeolite by ammonium dihydrogen phosphate (NH4H2PO4) through phosphatation process. In the phosphatation
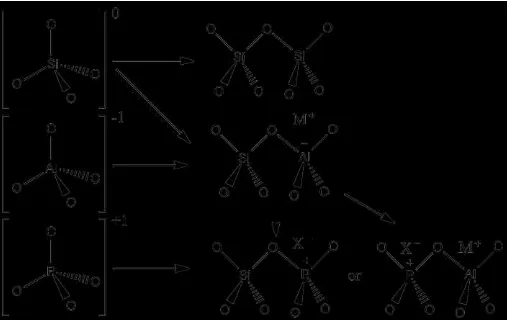
process of neutral (SiO4) or negative charge (AlO4-) in the zeolite will be replaced by positive
charged (PO4+). Increasing of the positive charge on zeolite may improve its Cr(VI)
adsorption capacity [5]. According to [6–8] the optimum phosphatation process occurs at a
temperature of 235ᴼC was using ammonium dihydrogen phosphate (NH4H2PO4) for 5 hours
because under such conditions NH4H2PO4 would decompose free ammonia. Therefore, there
is no NH4+ ions can interfere with the phosphatation process.
According to Suraya [9], at the optimum pH 4 to 0.1 g of Alumino Silico Phosphate (ASP) Si/P ratio of 1:6 (mol/mol) was obtained by adsorption percentage of 29.53%. So it is necessary to do research the influence of contact time and adsorption capacity of Alumino Silico Phosphat (ASP) in the form of granule. The addition of chitosan to Granules Alumino Silicon Phosphate (GASP) not only used as adhesive but also can increase the adsorption capacity of Cr(VI) due to the presence of amine groups (-NH3+) in zeolite. This can be proved
based on the results of the study[10] which reported the adsorption capacity of chitosan zeolite granules of 4.05 mg/g greater than the zeolite powder adsorption capacity of 3.48 mg/g against anionic waste (phosphate ions). In addition, ASP in the form of granules can easily be separated from the adsorbate process compared to the form of powder. This research will investigate about the effect of phosphatation and granulation zeolite in the adsorption of Cr(VI). The zeolite utilized a natural zeolite from the Blitar city.
EXPERIMENT
Materials and instruments
Materials used in this research include zeolite, HCl (Merck), distilled water, ammonium dihydrogen phosphate (SAP), ammonium molybdate (Merck), nitric acid (Merck), chitosan (Merck), glacial acetic acid (Merck), Sodium Hydroxide (Merck), Potassium Chromate (Merck), and 1,5-diphenylcarbazid (Merck).
The instruments used in this study are magnetic stirer, UV-Vis spectrophotometer (Shimazu), analytical balance, furnace 6000 (Barnstead Thermolgne), oven (Memmert), sieve of 150 mesh and 200 mesh, syringe pump type BYZ-810T Byond), shaker (Wise Shake), hot plate, Fourier Transformation Infrared (FT-IR) 8400S, X-Ray Fluorescence (XRF) Minipal 4 type (PANalytical), Surface Area Analyzer (SAA), Porcelain cup and glassware.
Procedure of zeolite activation
with a magnetic stirrer for 1 hour. Then zeolite was filtered and dried at 105ᴼC. A dried zeolite was mixed with 0.4 M HCl with a ratio of 1 g zeolite / 10 mL HCl for 4 hours stirred with a magnetic stirrer. Active zeolite was rinsed with distilled water to pH filtrate 7 then
precipitate)[11]. The residue was dried at 105ᴼC to obtain Alumino Silico Phosphate (ASP) powder. ASP was characterized using X-Ray Fluorescence (XRF).
Procedure of Granules Alumino Silico Phosphate (GASP) manufacturing
ASP of 3 g was mixed with 0.18 g of chitosan and 9 mL of 2% acetic acid, then stirred by magnetic stirrer until homogeneous. ASP-chitosan was dripped into 1 M NaOH solution used syringe pump until granules was formed. Then granules was washed with distilled water
until pH filtrate reaches 7 and dried at 105ᴼC to obtain Granules Alumino Silico Phosphate (GASP). GASP was characterized using Fourier Transformation Infrared (FT-IR). As a comparison, granules preparation was also performed for active zeolite.
Procedure for determining the optimal contact time GASP on Cr(VI) adsorption
GASP of 0.5 g was added 25 mL of K2CrO4 100 mg/L into 250 mL erlenmeyer flasks
on pH 6.3 – 7.1 and shuffled with shaker at 100 rpm. Used variations of contact time 0.5; 1.0; 1.5; 2.0 and 2.5 hours. The mixture was separated between the filtrate and the adsorbent through the filtration process. The filtrate was taken and the determination of Cr (VI) content with complexing of 1.5-diphenylcarbazide acidic condition pH ≤ 2(acetic acid)[11]. Then the filtrate was measured using a spectrophotometer UV-Vis at a wavelength of 541 nm.
Procedure for determination the effect of Cr (VI) concentration on adsorption capacity at GASP
A 25 mL of K2CrO4 solution 25, 50, 75, 100 and 150 mg/L were added adsorbent 0.1 g
GASP in erlenmeyer flasks and shuffled by shaker at 100 rpm in optimum contact time. The filtrate was taken and the determination of Cr(VI) content and complex of 1.5-diphenylcarbazide in acidic condition (acetic acid). Then the filtrate was measured using a spectrophotometer UV-Vis at a wavelength of 541 nm. As a comparison, the adsorption capacity was also performed on the active zeolite, active zeolite granule and ASP powder.
RESULT AND DISCUSSION X-Ray Fluorescence (XRF)
The journal homepage www.jpacr.ub.ac.id 210
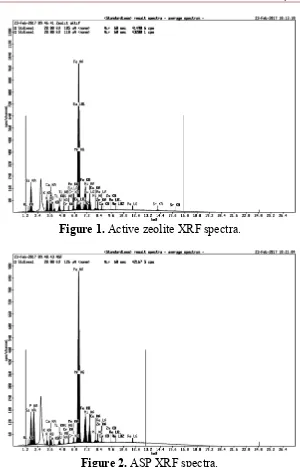
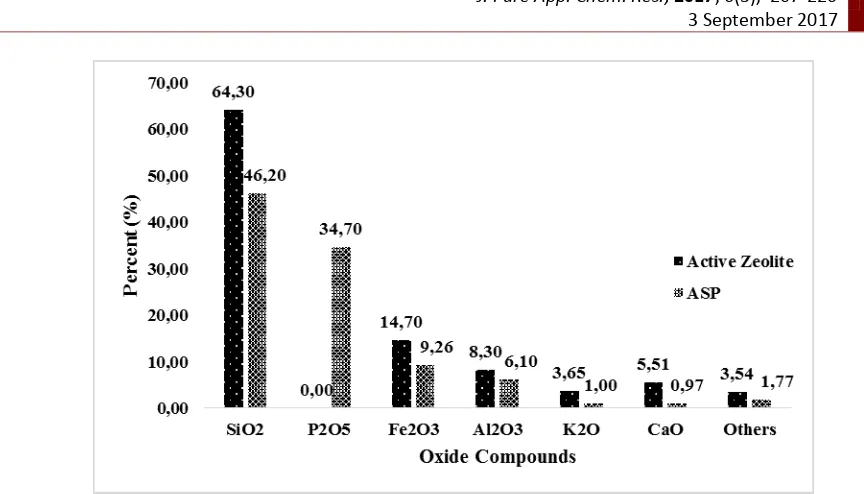
Figure 1. Active zeolite XRF spectra.
Figure 2. ASP XRF spectra.
In the XRF data of active zeolite Figure 1 and Figure 3 the content of silica (SiO2) and
alumina (Al2O3) based on the zeolite framework is 64.30 % (wt) and 8.30 % (wt). From the
silica content can be predicted the NH4H2PO4 mass required in the zeolite phosphate process
with the Si/P ratio: 1/6 (mol/mol). Although the zeolite has been activated, there are still high impurity compounds such as Fe2O3 14.70 % (wt), CaO 5.51 % (wt) and K2O 3.65 % (wt).
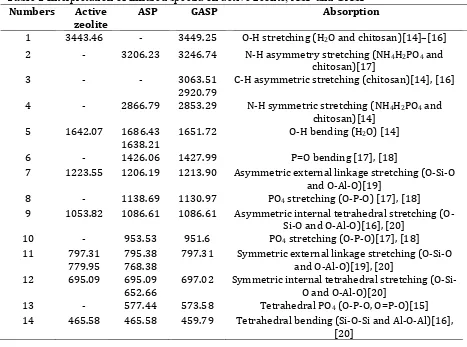
The content of silica (SiO2) and alumina (Al2O3) in Figure 3 decreased after
phosphatation process from 46.20 % (wt) and 6.10 % (wt) along with the emergence of P2O5
oxide from NH4H2PO4 addition of 34,70 % (wt). In addition, the impurities of Fe2O3, CaO
and K2O also decreased to 9.26 % (wt), 0.97 % (wt) and 1.00 % (wt). The emergence of the
P2O5 oxide compound may be connected to the isomorphic substitution of the zeolite
Figure 3. Relationship of percent (%) to the types of oxide compounds.
Compared to the alumina groups, silica groups tend to be easily replaced by phosphate groups because of some similarities in their properties. As the same length of Si-O bonds in silica is 1.63 Å and P-O in phosphate of 1.63 Å compared to Al-O in alumina of 1.75 Å. The amount of bond length on alumina causes stability also increases. In addition, the Al-O binding energy of alumina is 512 kJ/mol greater than the bonding force of Si-O in silica of 452 kJ/mol and P-O in phosphate of 335 kJ/mol [12,13]. Therefore, alumina is more difficult accomplished phosphatation than silica. The success of zeolite phosphatation in detail can be determined by characterization with FTIR and the adsorption results of phosphate adsorbent (ASP and GASP).
Fourier Transform Infrared Spectroscopy (FT-IR)
The analysis using FTIR aimed to determine the functional groups contained in active zeolites, ASP and GASP. The IR spectra pattern of active zeolite, Alumino Silico Phosphate (ASP) and Granules Alumino Silico Phosphate (GASP) are shown in Figure 4 and the interpretation of the IR spectra pattern represented in Table 1.
Based on Figure 4 and Table 1 of numbers 1, O-H stretching on active zeolite and GASP indicates the presence of H2O entering in the pores of the zeolite. The presence of
amplified H2O in numbers 5 appears to bend O-H from active zeolite, ASP and GASP. The
O-H group on ASP did not appear in numbers 1 due to a little content of H2O caused the
The journal homepage www.jpacr.ub.ac.id 212
Figure 4. Infra-red spectra of active zeolite, ASP and GASP.
Table 1 Interpretation of infrared spectra on active zeolite, ASP and GASP
Numbers Active
7 1223.55 1206.19 1213.90 Asymmetric external linkage stretching (O-Si-O and O-Al-O)[19]
8 - 1138.69 1130.97 PO4 stretching (O-P-O) [17], [18]
9 1053.82 1086.61 1086.61 Asymmetric internal tetrahedral stretching (O-Si-O and O-Al-O)[16], [20]
14 465.58 465.58 459.79 Tetrahedral bending (Si-O-Si and Al-O-Al)[16], [20]
Numbers 2 and 4 also showed the presence of an N-H group of NH4+ from NH4H2PO4
reactants attached to the zeolite framework. The results showed that not all NH4+ turns into
NH3 gas during phosphatation process. Numbers 6, 8, 10 and 13 respectively show P=O
on ASP and GASP adsorbents. This proves the occurrence of isomorphic substitution between alumina (AlO4-) and silica (SiO4) groups with phosphate (PO4+) during the
phosphatation process. In addition, the isomorphic substitution caused a shift toward the lower wavenumber. Number 7, 9 and 12 including the asymmetric external linkage stretching TO4 (O-Si-O and O-Al-O), asymmetric internal tetrahedral stretching (O-Si-O and O-Al-O)
and symmetric internal tetrahedral stretching (O-Si-O and O-Al-O) of the active zeolite which shifts into numbers 8, 10 and 13 of the ASP and GASP. Based on the Hooke’s law, increasing of atom mass from Si-O (Mr: 42.98 g/mol) and Al-O (Mr: 44.084 g / mol) to P-O (Mr: 46.972 g/mol) caused shifting of wavenumbers to a lower one[19]. Despite the shifts, on numbers 7, 9 and 12 of the ASP and GASP adsorbents still produce peaks indicating that was not all alumina (AlO4-) and silica (SiO4) groups are replaced by phosphate groups (PO4+).
Surface Area Analyzer (SAA)
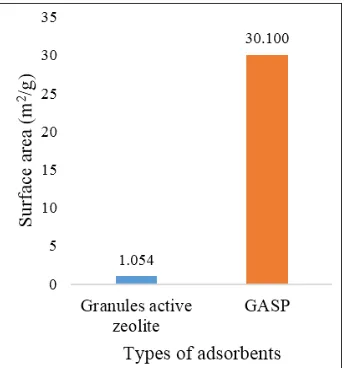
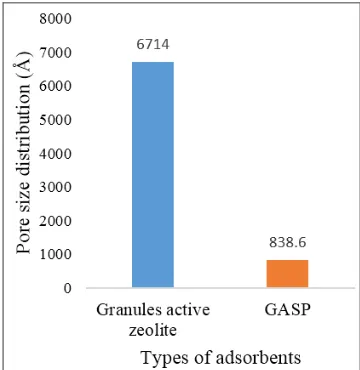
Analysis by using SAA to determine surface area, pore volume and average pore radius or pore distribution on granules active zeolite and GASP. The results of SAA characterization were presented in Figure 5, Figure 6 and Figure 7.
Figure 5. Surface area data (m2/g) on granules active zeolite and GASP
The journal homepage www.jpacr.ub.ac.id 214
Figure 6. Pore volume data (cm3/g) on granules active zeolite and GASP
Figure 7. Pore size distribution data (Å) on active zeolite granules and GASP
Effect of optimum contact time GASP on Cr(VI) adsorption
Figure 8 shows that the optimum time of the adsorption process occurs at 2 hours with Cr(VI) ion mass absorbed per gram of adsorbent (qe) of 5.24 ± 0.20 mg/g. Adsorption of Cr(VI) increased from 0.5 to 2 h probably due to active sites and surface area of GASP. While at contact time from 2 hours to 2.5 hours, qe the adsorption decreased from 5.24 ± 0.05 mg / g to 4.77 ± 0.10 mg/g. This occurs because positive sites/ active sides of the GASP adsorbent may be fully charged by Cr(VI) so that the adsorbent is saturated and causes desorption / release of Cr(VI) from the adsorbent back to the adsorbate. According to the result of research Mutngimaturrohmah and Khabibi [20] that at certain times the mass of Cr(VI) will increase and then decrease after the Cr(VI) concentration has equilibrium in the adsorbent and adsorbate.
Effect of Cr(VI) concentration on adsorption capacity in GASP
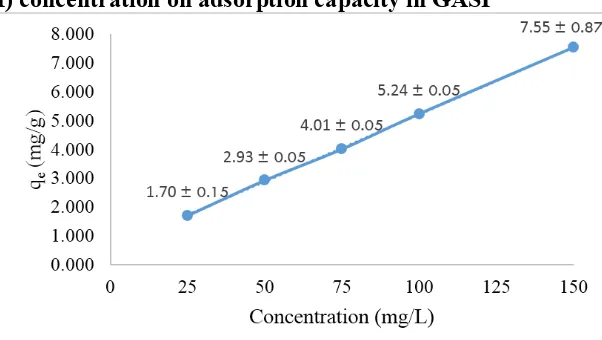
Figure 9. The relation of Cr(VI) concentration to Cr(VI) mass which absorbed per gram of GASP adsorbent (qe)
Figure 9 showed that the increased concentration of Cr(VI) results in the mass of Cr(VI) adsorbed by GASP also increases. Cr(VI) mass absorbed per gram of adsorbent (qe) continues to increase from concentrations of 25 mg/L to 150 mg/L respectively 1.70 ± 0.15; 2.93 ± 0.05; 4.01 ± 0.05; 5.24 ± 0.05 and 7.55 ± 0.87 mg/g. This occurred because the GASP adsorbent has large pores and positive sites / active sides. Therefore, the increase of Cr(VI) mass was required to fully occupy all of the active side until it becomes saturated. Based on the theory, the increased concentration of adsorbate, the amount of soluble that can be adsorbed until the equilibrium condition was also increases. The equilibrium condition occurred when the rate of the absorbed substance is equal to the rate of the substance released from the adsorbent at a certain temperature[21].
Based on the data as shown in Figure 9, the maximum adsorption capacity of the GASP adsorbent was determined by the Langmuir equation. The Langmuir equation (equation 1) assumed that the maximum adsorption capacity occurred in a single layer (monolayer) adsorbate on the surface of the adsorbent[21,22]. The graph was depicted in
The journal homepage www.jpacr.ub.ac.id 216
Figure 10. Langmuir equations on GASP from Cr(VI) concentration after adsorption process (Ce) to concentration per Cr(VI) mass which absorbed per gram of adsorbent (Ce/qe).
In Figure 10 the coefficient of determination R2 ≥ 0.9 (close to 1.0) showed that the equation y= 0.0208x +13.594 satisfies the Langmuir Equation with R2 = 0.937. Based on slope value (1/qm) = 0.0208, maximum adsorption capacity(qm) on GASP adsorbent can be
determined that is 48,077 mg/g. Maximum adsorption capacity is also determined for active zeolite, granules active zeolite and Alumino Silicone Phosphate (ASP), respectively Figure 11, Figure 12 and Figure 13.
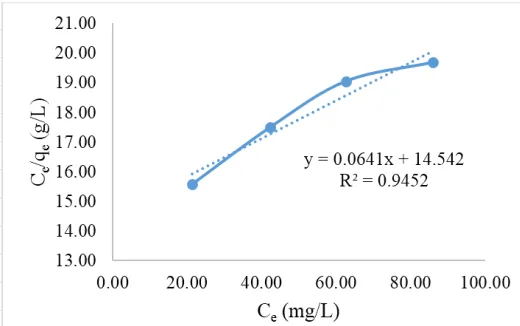
Figure 12. Langmuir equations on granules active zeolite from Cr(VI) concentration after adsorption process (Ce) to concentration per Cr(VI) mass which absorbed per gram of
adsorbent (Ce/qe).
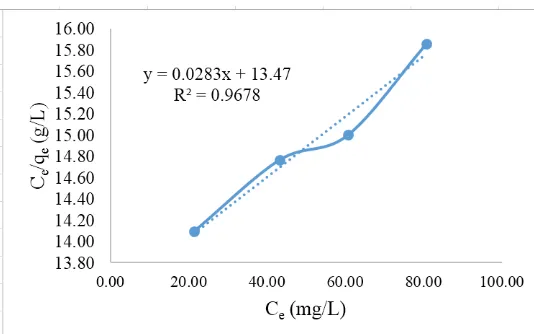
Figure 13. Langmuir equations on ASP from Cr(VI) concentration after adsorption process (Ce) to concentration per Cr(VI) mass were absorbed per gram of adsorbent (Ce/qe).
The coefficient of determination (R2) employed to investigate the effect of magnitude (x) on the dependent variable (y), if the value is close to 1.0 then the langmuir equation can be used. The coefficient of determination (R2) on the active zeolite, active zeolite granules and ASP has R2 ≥ 0.9 (close to 1.0) to satisfy the Langmuir equation with R2 value of 0.945; 0.939 and 0.968. The maximum adsorption capacity could be determined by using the slope value of each equation on the active zeolite, granules active zeolite and ASP [21], [22]. Then difference of adsorption ability based on maximum adsorption capacity value on each of the adsorbent as in Figure 14.
The journal homepage www.jpacr.ub.ac.id 218
Figure 14. Maximum adsorption capacity on different adsorbents.
Figure 15 Isomorphic substitution reactions[5]
Meanwhile, the effect of chitosan addition can be investigated by the value of maximum adsorption capacity between active zeolite and granules active zeolite and ASP with GASP. The presence of chitosan on the granules active zeolite causes the maximum adsorption capacity of granules active zeolite 16.287 mg/g greater than active zeolite that is 15.601 mg/g. Similarly, GASP has a maximum adsorption capacity of 48.077 mg/g greater than ASP of 35.336 mg/g. In addition, to functioning as an adhesive, the addition of chitosan into the zeolite can increase the adsorption capacity of Cr(VI) in pH adsorption 7.0 - 6.3 because chitosan is able to form crosslinks with zeolite and has an amine group (-NH3+)
capable of binding Cr(VI) in pH ≤ 6,5[23], [24].
(evidenced from the uptake of ammonium ions in IR spectra). When chitosan was added to ASP, the pH of the solution is about 6.5 at the time of adsorption which is the amine group (-NH2) in chitosan undergoes a protonation producing a positively charged amine group
(-NH3+). The increasing number of positively charged amine groups (-NH3+) in chitosan is
directly proportional to the increased adsorption capacity of Cr(VI) and can increase the distance of the adsorption capacity difference between ASP and GASP.
CONCLUSION
The result of XRF characterization results showed an emergence of P2O5 34.70 % and
decrease in SiO2 levels of 18.10% and Al2O3 by 2.2% after phosphatation process. The
phosphate process was successfully conducted which evidenced by the shift of wave numbers to the lower region at wave number of tetrahedral silica and alumina uptake shifted to wavenumber of tetrahedral phosphate uptake in accordance with Hooke's law. Characterization results with SAA showed increased surface area, pore volume and pore count after phosphatation process. The variation of contact time influences the increasing of Cr(VI) adsorption. The optimum contact time occurs in the adsorption process for 2 hours. The concentration variation is directly proportional to the increase of the adsorbed Cr(VI) mass. The presence of phosphatation and chitosan addition process can increase the value of adsorption capacity by 48.077 mg/g in GASP compared without phosphate process and chitosan addition of 15.01 mg/g in active zeolite.
REFERENCES
[1] Suwarno, H. and Tandjung, S. D., J. Teknosains, 2014, 3(2), 132–141.
[2] Bosnic, M., Buljan, J. and Daniels, R.P., Pollutants in Tannery Effluent: Limits for Discharge into Water Bodies and Sewers, United Nations Industrial Development Organization (UNIDO), 2000, US/RAS/92/120, pp. 1–26.
[3] Lemoine, G. Comparison of Different Types of Zeolites Used As Solid Acid Catalysis in The Transesterificatin Reaction of Jatropha-type Oil for Biodiesel Production, M.Sc. Thesis, Worcester Polytechnic Institute, 2013, pp. 75-80.
[4] Wirawan, S. K., Sudibyo, H. and Setiaji, M. F., JESTEC, 2015, 3, 87–95. [5] H Faghihian, MH Mohammadi, Iran J Chem Chem Eng, 2008, 27(4), 115–118. [6] Elok, K. H., Study of Effect of Phosphate Compound on Natural Zeolite Phosphate,
Faculty of Mathematics and Natural Sciences, Brawijaya University, Malang, 2002. [7] Agustina, E., Study of the Effect of Temperature of Phosphate on the Zeolite Turen
Anion Natural Exchange, Faculty of Mathematics and Natural Sciences, Brawijaya University, Malang, 2002.
[8] Praswanto, S. A., Study of the Effect of Mol Si / P Comparisons on Zeolite Nature Turen Phosphatation, Faculty of Mathematics and Natural Sciences, Brawijaya University, Malang, 2001.
[9] Suraya, Z., Variation of pH of Solution and Adsorbat Concentration on Anion Adsorption Formed Cr (VI) by Zeolite Result of Phosphate, Faculty of Mathematics and Natural Sciences, Brawijaya University, Malang, 2003.
[10] Xie, J., Li, C., Chi, L. and Wu, D., Fuel, 2013, 103, 480–485.
The journal homepage www.jpacr.ub.ac.id 220 International (P) Ltd., New Delhi.
[22] Emelda, L., Putri, S. M., and Ginting, S., J. Chemical And Environment Engineering,
2013, 9, 166–172.
[23] Handayani, M. and Sulistiyono, E., Langmuir and Freundlich Equation Test on Chrom Waste Absorption (VI) by Zeolite, Pros. Semin. Nas. Sains dan Teknol. Nukl. PTNBR Bandung, 2009, pp. 130–136.
[24] Liu, Y. and Chen, J., Ionic Liquids for Better Separation Processes, 2016, Springer, Berlin.
[25] De Alvarenga, E. S., Characterization and Properties of Chitosan, in Biotechnology of Biopolymers, 2011, vol. 5, pp. 91–109.