1
Ministry of Finance
Democratic Republic of Timor-Leste
Development Partners
Disbursement Report
-
Calendar Year 2009
2
Contents
Overview ... 3
Development Partners Spending in 2009 ... 4
Chart 1: Development Partners Spending by Ministries/SoS in 2009 ... 6
Chart 2: Development Partner Spending by Sectors in 2009 ... 7
Chart 3: Number of Development Partner projects by Districts and Sectors ... 8
Information Required ... 9
Table 1:Status of Update ... 13
Annex: ... 15
Table: Disbursement rate and break down of spending in 2009... 15
3 Overview
The Ministry of Finance is pleased to release the 2009 end of fiscal year report on
external assistance to Timor-Leste. The data contained in this report was compiled by
the National Directorate of Aid Effectiveness (NDAE) of the Ministry of Finance. The
information contained in this report consists of data provided by representatives from
Development Partners.
Only those projects that provide development, humanitarian and emergency assistance
are entered into the database. Thus, military and its security-related assistance provided
under the International Stability Force (ISF) to Timor-Leste is not included in this report.
Any other security related assistance as technical assistance is included.
The Government appreciates the efforts made by individual Development Partners who
have provided updated information in a timely manner.
The reliability of the data recorded is dependent on the cooperation of Development
Partners to provide the necessary and accurate information. The most recent update was
in February 2010, which is incorporated into the report. The Government and
Development Partners intend to update project information on a regular basis.
The purpose of this report is to help the Government of Timor-Leste and Development
Partners gain a comprehensive overview of development assistance as well as assist in
policy decision making.
The Government of Timor-Leste is grateful for the cooperation of Development
Partners. The production of the report would not have been possible without their
continued support.
4 Development Partners Spending in 2009
Development Partners committed a total of $309.5M for development assistance to
Timor-Leste; $287.4M was disbursed in 2009. The graph below shows the downward
trend in projected assistance from Development Partners in the next four years from
$275.5M in 2010, $144.0M in 2011, $62.5M in 2012 and $34.7M in 2013.
In the most recent update from February 2010, NDAE received updated project
information from 13 bilateral development partners, 4 multilateral agencies and 11 UN
agencies. Bilateral development partners contributed $253M. The top five bilateral
development partners in 2009 included Australia ($84.1M), the USA ($28.6M), Portugal
($21.4M), Japan ($16.7M) and Spain ($14.7M). Their spending represents 84% of the
total spending of all bilateral development partners.
0 100 200 300 400
2009 2010 2011 2012 2013
5 The disbursed $287.4M consists of:
$242.1M for support to the Government Office and its related sector by Ministry.
$45.3M for Non Government sectors whose activities cannot be categorized to a particular Government Ministry. (e.g. support to civil society)
Out of the $242.1M, $40.6M was spent for projects related to the Ministry of Infrastructure. It is followed by Ministry of Security and Defence’s $36.7M and
$27.1 M for the Ministry of Education (see Chart 1 below).
Development Partner spending by sector in 2009 can be seen in Chart 2. The majority of
Development Partner spending is attributed to 5 main sectors: Education (17%), Health
(14%), Agriculture (11%), Public Sector Management (11%) and Security (11%). Chart
3 shows that Development Partners are implementing 50 projects, with the largest
number focused in the capital Dili, followed by Oecusse with 37 projects and Baucau
with 36 projects. However, it should be noted that the existing data does not allow for a
breakdown of amounts within the 13 districts of Timor-Leste. NDAE intends to collect
more detailed information on spending from Development Partners in the future to
compile a more comprehensive data base.
Further information is contained in the circulated USB flash drive.
6 Chart 1: Development Partners Spending by Ministries/SoS in 2009
$, 000
Note: Only Ministries that will receive more than $1 million are listed.
7
Chart 2: Development Partner Spending by Sectors in 2009
Note:
1) Public Sector Management includes support to the Ministry of Finance and Ministry of State Administration and Territorial Management.
2) Pillars of State include support to Office of the President, National
Parliament, Office of the Prime Minister, Council of Ministers and National Committee for Elections.
3) Support to Secretary of State for Vocational Training and Employment is included in Education sector.
Pillars of State Youth, Sports &
Culture
Natural Resources & Environment
Water Supply & Sanitation
5%
Infrastrcuture
8
Chart 3: Number of Development Partner projects by Districts and Sectors (projects
whose impact is ‘national’ are not included.)
- 10 20 30 40 50 60 70
Vicuecue Oecusse Manifahi Manatuto Liquica Lautem Ermera Dili Covalima Bobonaro Baucau Ainaro Aileu
Youth & Sports
Vocational Training
Gender Equality
Justice
Health
Education
Economy & Dev.
State Admin.
Social Solidarity
Agriculture
Tourism
9 Information Required
In order to ensure accurate and timely reporting, the minimum data requirements for each project are listed below. All items are included in the template provided by the Ministry of Finance.
Development Partner:
The funding agency or country making a financial commitment to a project from its core funding.
Project Name:
Project may include technical cooperation (such as technical cooperation project, feasibility studies, supply of adviser, supply of teacher, provision of scholarship, training course, student, research and development-oriented social and cultural program), investment project, Development food aid and humanitarian aid.
Government Office receiving the assistance:
Refers to the Ministry, Secretary of State or other Government office (usually Government signatory of MOU with development partners)
Implementing Agency:
The name of organization actually conducting the work on behalf of the development partner. Implementing agency can be multilateral agency, bilateral agency, NGOs and other organizations.
Expected Outcomes:
Expected outcomes may be described in the project document agreed by the Government. If project outcomes are not available, project objectives are made available..
Areas benefited:
Areas benefited from project(s) are selected from below.
10
There are projects that do not have particular geographic areas, such as cases where there is a supply of a policy adviser and/or a project that supports a Ministry’s management capacity. These projects don not benefit one particular area but are devised to benefit state building on the national level. In such cases, ‘National’ is selected.
Project Status:
Project status can be divided into 3 categories; Ongoing, Under Preparation and Completed. Under Preparation means that an indicative budget and purpose of the project has been agreed and approved by the development partner and Government (e.g., MoU is signed), but has yet to be mobilized.
Project Start/ Project Complete:
The definition of ‘project start’ may vary across development partners. The Ministry of Finance is interested in the date the project agreement was signed by the Government.
Currency:
Ideally, development assistance amounts are in the currency of the donor country. These values are converted by the Ministry of Finance to US$ based on the standard exchange rates.
Exchange Rates Applied1:
Exchange rates applied for the first quarter disbursement for 2009 (January – March) are described below. (Average exchange rates during the period)
1 Source: IMF’s website, http://www.imf.org/external/np/fin/data/param_rms_mth.aspx
Currency Average Exchange Rate
(2009s average)
Australian dollar 0.792734
Canadian dollar 0.875682
Euro 1.39478241
Japanese yen 0.010682
NZ dollar 0.635871
11 Capital Development (%):
This is the percentage of the total amount that will be used for physical works.
Total Funding:
Total funding is the total amount which may be an agreed figure appearing in the agreement or MOU. The amount may be changed if additional funding is
committed.
Core Funding:
Core funding is the amount of funds being provided from the reporting development partner, excluding any amounts that are coming from other development partners and channelled through an organization.
Non-Core Funding:
Non-core funding is the amount of funds that an organization is managing on behalf of another development partner.
Source of Non–core Funding:
The name of a country or an organization that achieves its purpose through an implementing agency. In addition to the name of country or organization, it is expected that information regarding the amount of funds provided by the organization is to be provided.
Actual Disbursement:
In the Paris Declaration, Development Partners agreed to provide reliable indicative pledges of aid over a multi-year span and disburse aid in a timely and predictable fashion. Actual disbursement here is the amount disbursed from January to December 2008.
Breakdown of Actual Disbursement:
Development Partners are requested to provide the breakdown of disbursement. For reference, the following is the Government’s classification of expenditure.
1) Salaries/Wages
Salary
Overtime/Allowance
2) Goods & Services
Local Travel
Overseas Travel
Training and Workshop
Utilities
Rental of Property
12
Office Stationery and Supplies
Operational Material and Supplies
Fuel for Generators
Maintenance of Equipment and Buildings
Operational Expenses
Professional Services
Translation Services
Other Miscellaneous Services
Payment of Membership
Current Transfer
3) Minor Capital
Security Equipment
EDP Equipment
Communication Equipment
Generators
Water Equipment
Office Equipment
Other Miscellaneous Equipment
Furniture and Fitting
4) Capital and Development
Infrastructure Assets
Major Capital Equipment
All updates are preferably done electronically via email and in a standard Excel spreadsheet provided by the NDAE, Ministry of Finance. Due to insufficient information, the NDAE was unable to provide further analysis or conclusions.
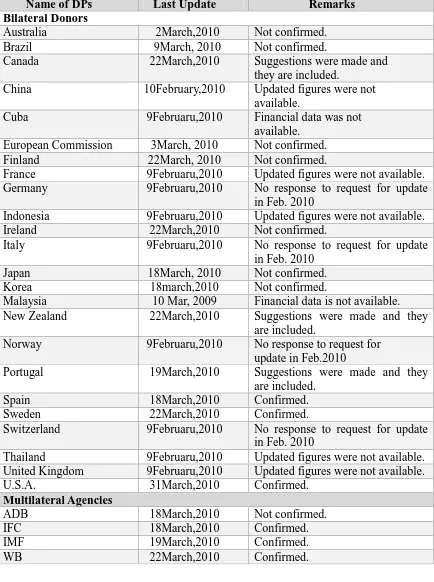
13 Table 1:Status of Update2
2 The e-mail was sent to Development partners on February 9, 2010.
Name of DPs Last Update Remarks
Bilateral Donors
Australia 2March,2010 Not confirmed.
Brazil 9March, 2010 Not confirmed.
Canada 22March,2010 Suggestions were made and
they are included.
China 10February,2010 Updated figures were not available.
Cuba 9Februaru,2010 Financial data was not available.
European Commission 3March, 2010 Not confirmed.
Finland 22March, 2010 Not confirmed.
France 9Februaru,2010 Updated figures were not available. Germany 9Februaru,2010 No response to request for update
in Feb. 2010
Indonesia 9Februaru,2010 Updated figures were not available.
Ireland 22March,2010 Not confirmed.
Italy 9Februaru,2010 No response to request for update in Feb. 2010
Japan 18March, 2010 Not confirmed.
Korea 18march,2010 Not confirmed.
Malaysia 10 Mar, 2009 Financial data is not available. New Zealand 22March,2010 Suggestions were made and they
are included.
Norway 9Februaru,2010 No response to request for update in Feb.2010
Portugal 19March,2010 Suggestions were made and they are included.
Spain 18March,2010 Confirmed.
Sweden 22March,2010 Confirmed.
Switzerland 9Februaru,2010 No response to request for update in Feb. 2010
Thailand 9Februaru,2010 Updated figures were not available. United Kingdom 9Februaru,2010 Updated figures were not available.
U.S.A. 31March,2010 Confirmed.
Multilateral Agencies
ADB 18March,2010 Not confirmed.
IFC 18March,2010 Confirmed.
IMF 19March,2010 Confirmed.
14
update in Feb.2010 UN Agencies
FAO 26February,2010 Not confirmed.
ILO 20March,2010 Suggestions were made and they are included.
IOM 19February,2010 Not confirmed.
UNCDF 18March,2010 Confirmed.
UNDP 21March,2010 Suggestions were made and they are included.
UNESCO 18March,2010 Confirmed.
UNFPA 9Februaru,2010 No response to request for update in Feb.2010
UNHCR 19February,2010 Not confirmed.
UNICEF 18March,2010 Confirmed.
UNIDO 18March,2010 Confirmed.
UNIFEM 18March,2010 Suggestions were made and they are included.
WFP 25March,2010 New update was made. They
are included.
15
Table: Disbursement rate and break down of spending in 2009
$, 000 21 Switzerland
16 Note:
1. The amount of disbursement by Multilateral and UN Agencies above includes funding reported by the bilateral development partner.
2. Ideally the total of breakdown items should equal the disbursement amount. However, some development partners have difficulty in disaggregating its spending. NDAE can only present information as given.
UN Agency
30 FAO 3,504 3,209 91.6% 664 1,463 709 373
31 ILO 7,051 5,574 79.0% 1,676 1,680 393 1,825
32 IOM 4,985 3,060 1,548 327 50
33 UNCDF 984 831 84.5% 705 127 0 0
34 UNDP 16,443 18,957 115.3% 6,434 11,503 654 0
35 UNHCR 67 62 92.5% 0 62 0 0
36 UNICEF 9,765 4,052 41.5% 0 4,052 0 0
37 UNFPA
38 UNIFEM 3,005 3,267 108.7% 2,181 1,056 30 0
39 UNIDO 152 34 94.3% 22 12 0 0
40 UNESCO 261 198 91.8% 0 168 25 0
41 WFP 22,890 9,817 42.9%
17
Table: Development Partner Spending by Ministry in 2009
18 Commission
Public Service Commission Banking Payment Authority
6,465 6,465 100% 0 140 0 0