Simulation and Experimental System Terner Aseton-Butanol-Ethanol with
Batch Distillation
Ni Ketut Sari
Departement of Chemical Engineering, Industrial Technologi Faculty UPN ”Veteran” East Java E-mail: [email protected]
ABSTRACT
Result of Aseton-Butanol-Ethanol (ABE) terner system simulation (ABE) in the form of temperature profile, liquida composition profile and vapour in bottom utilized as reference in ABE terner system experiment, with komparasi result of ABE terner system experiment and simulation will know how far deviation obtained.
For the dissociation of ABE terner system done by research simulationly before done by research experimentally, so that in determination of research variable can more directional and expense of cheaper research. Simulation of ABE terner system by batch distillation use rigorous method, model DAEs and Matlab Ianguage. Result of from ABE terner system simulation later then comparation use Metanol-Ethanol-Propanol (MEP ) terner system which forming homolog deret. Usage of MEP terner system in ABE terner system comparation, because MEP terner system mixture prediction form zeotropik mixture. Result of simulation in the form of temperature profile, liquida composition profile and vapor composition profile function of time dimensionless () either in bottom and also[in distilate. Is afterwards done by ABE terner system experiment with operating pressure 1 atmospher, ABE mixture volume 350 ml, ABE feed composition : 0.8, 0.1, 0.1 ( mole fraction) and : 0, 1, 2,3.
Result of ABE terner system simulation comparation with MEP terner system come near result which same and show zeotropik mixture. Result of experiment and simulation in the form of temperature profile, liquida composition profile and vapor composition profile time dimensionless function either in bottom and also in distilate show result come near is samely. So that ABE terner system simulation after comparation with MEP terner system can wear by reference in ABE terner system experiment
Keyword : time dimensionless,batch distillation, eksperiment, simulation, zeotropik
1. INTRODUCTION
In the chemical industry, the fermentation process is one way to get a chemical compound with the help of microorganisms, fermentation products enter the next stage of separation. At this stage it is very important to produce a product with a certain purity, one of the tools commonly used in the separation process is a batch distillation column. Separation process in the industry generally and the separation of multicomponent separation rarely binary, therefore it is important to review the multicomponent batch distillation. Design of multi-component batch distillation is generally obtained by performing simulations, in order to obtain simulation results are close to the actual state of the required thermodynamic data are accurate.
In the process of separation, thermodynamic data of the most dominant influence on the process performance is the equilibrium phase. One of the modern thermodynamic correlation in mempersentasikan behavior is not ideal mixture UNIQUAC equation, the approximate equilibrium ternary and quaternary systems can be done only based on experimental data of binary systems. Activity coefficient models with UNIQUAC equation was developed from a binary mixture, and has advantages
for applications in multi-component mixture system because it only requires a binary parameter (does not require additional parameters). But the loss model does not always succeed in predicting the equilibrium multi-component system that shows a mixture which is not ideal especially for mixtures that have a spouse with limited solubility such as butanol-water. To overcome these measurement data needed to accurately balance the binary system and model parameters estimation of activity coefficient models so that these parameters can be used to estimate the vapor-liquid equilibrium multi-component systems accurately.
azeotropnya point is at Mademoiselle. Then further developed for multi-component systems, namely in the form of residue curve maps of homogeneous and heterogeneous azeotropic mixture, the movement of the composition profile in the residue is formed liquida zeotropik or azeotropic mixtures. Ternary systems such as isopropanol-water-benzene to form a pseudo-homogeneous azeotropic mixtures have been studied by Pham and Doherty (1990). Ternary systems such as chloroform-benzene-acetone (Fidkowski et al. 1993), acetone-heptane-benzene (Henley and Seader, 1998), acetone-water-metyl ethyl ketone (Villiers et al. 2002) and isopropanol-methyl cyclohexane-toluene (Egbewatt and Fletcher 2003) to form a homogeneous azeotropic mixtures. Other ternary systems that form the heterogeneous azeotropic mixtures such as water-benzene (Henley and Seader, 1998), ethanol-water-toluene (Henley and Seader, 1998). Other ternary systems such as nitrogen-argon-oxygen mixture without forming azeotropic or zeotropik, octane-2-ethoxy ethanol to form ethyl benzene azeotropic binary system, acetone-chloroform-methanol to form binary and ternary azeotropic system (Widagdo and Seider 1996). From the results of previous research, no one has made a map of residue curves for ternary mixtures ABE.
From the residue curve maps obtained and validated, the validation of the topological relations. To validate the topological relations using the equation that already exist in the literature (Henley and Seader, 1998). To determine whether the program listing the ternary system simulation is generally applicable, then validated based on data from the literature. Many ternary systems that already exist in the literature or journals that can be used for validation ABE ternary system, one of the ternary system used is a mixture that forms the ternary system zeotropik the MEP.
2. STRUCTURE OF WRITING
At low pressure, the vapor phase so close to the ideal gas low pressure liquid vapor equilibrium becomes: sat i .P i x P . i y i
γ ... (1)
Equation (1) is also known as the modified Raoult's equation.
The constant of equilibrium between the vapor phase and liquid phase is defined as follows:
P sat i .P i γ i x i y i K
... (2)
Iteration procedure to find the temperature of which is to seek price bubble saturation temperature of pure component Tisat on P (Prausnitz et al., 2001).
i C P log -i A i B sat i
T ... (3)
where A, B, C are Antoine constants for species i, for all initial estimates.
i sat i T i x
T ... (4)
For i = 1, 2, 3.
Price T as the initial price will be used to determine the saturated vapor pressure of a substance to be estimated with the equation T Antoine.Sedangkan prices were sought by the equation:
j C sat 1 P log -j A j B
T ... (5)
Then look for the error between the new T with T the beginning with Equation (6)
e
T
)
T
(T
new beginning new
... (6)γi activity coefficients obtained from:
ln i = ln i C
+ ln i R
... (7)
ln iC =
m
1 j j j
x i x i φ i i φi θ ln i q 2 z i x i φ
ln ... (8)
ln i R =qi
m
1
j
m
1
k
θ
k
τ
kj
ij
τ
j
θ
m
1
j
θ
j
τ
ji
ln
1
... (9)1)
(r
)
q
(r
2
z
i i ii
... (10)where the coordination number z is set equal to 10.
m
j
r
j
x
i
r
i
x
i
φ
1 j... (11)
m 1 j j j i i ix
q
x
q
θ
... (12)mixtures, there are two parameters that can be adjusted r, q:
RT
u
u
exp
τ
ji iiji
... (13)jj = ii = 1
Model-Differential-Algebraic Equations (DAEs) for batch distillation of ternary system, assuming it does not form a two phase liquida by Doherty and Perkins (1978) as follows:
)
y
x
(
dx
d
ξ
i i
i
... (14)W
W
ln
ξ
o
... (15)With a forward-finite-difference, Equation (15) becomes:
xi,j+1 = xi,j + (yi,j– xi,j) ... (16)
Where the composition of the early liquida on the bottom (xi, j) and determined, while the composition of the vapor (yi, j) is calculated using Equation BUBL T (Prausnitz, 2001).
3. METHODOLOGY
To calculate the saturated vapor pressure Antoine equation is used, data Antoine parameters such as Table 3.2. (Prausnitz, 2001), where the temperature (T) in units of K and saturated vapor pressure (PSAT) in units of Bar. To calculate the activity coefficient (γ) using the UNIQUAC equation, where the price of UNIQUAC binary interaction parameters (uij), the volume of molecular data (r) and molecular surface area (q) Table 3.3, the assumption z = 10.
Table 3.1. ABE feed composition
Table 3.2. Antoine parameters ABE Parameter Antoine Komponen A B C Aseton 4.2184 4.6493 5.3365 Butanol 197.01 1395.14 1648.22 Ethanol 228.06 182.739 230.918 Source: Prausnitz, 2001
Tabel 3.3 Parameter UNIQUAC ABE system terner
Komponen r q
Aseton 2.5735 2.3359 Butanol 3.4542 3.0520 Ethanol 2.1054 1.9720 Source: Prausnitz, 2001
Dimana : Aseton (1), Butanol (2), Ethanol (3) u11 = 0 ; u12 = -198,659 ; u13 = 98,75291
u21 = 453,669 ; u22 = 0 ; u23 = -32,707
u31 = 94,242 ; u32 = 75,355 ; u33 = 0
Validation of simulation results with the ternary system MEP
Table 3.4. MEP feed composition
Sources: Henley and Seader, 1998 To calculate the saturated vapor pressure Antoine
equation used
Table 3.5. Antoine parameters MEP Parameter Antoine
Komponen A B C
Metanol 5.20277 1580.08 239.500 Ethanol 228.06 182.739 230.918 Propanol 4.99991 1512.94 205.807 Sources: Prausnitz, 2001
Figure 3.2. A set of batch distillation equipment
Caption:
1. Pot Still 8. Thermometer 2. Oil batch 9. glasses Measure 3. Heater 10. condenser
4. Thermocouple 11. thermocouple RTD 5. Controller 12. column separator 6. Contactor 13. packed column 7. regulators
7. Regulator
4. RESULTS AND DISCUSSIONS
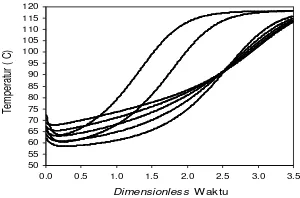
Temperature profile at the bottom shows the results of the approach with temperatures in the distillate, because the simple batch distillation processes operate in conditions of total reflux. Therefore the temperature profile as Figure 4.1 simulation results is the sum of the i-component temperature after normalization multiplied in the bottom component of the composition of liquida-i. From Figure 4.1 shows the temperature profile for Run ABE-1 to Run-6 as a whole rose against the dimensionless time. This is because the components are evaporated with a larger portion is a component of ethanol, so it takes a larger temperature to evaporate the water component that has not evaporated.
50 55 60 65 70 75 80 85 90 95 100 105 110 115 120
0.0 0.5 1.0 1.5 2.0 2.5 3.0 3.5
Dimensionless Waktu
T
em
pe
ra
tu
r
(
C
)
Figure 4.1 Profile of the temperature of the ternary system of ABE for Run-1 to Run-7
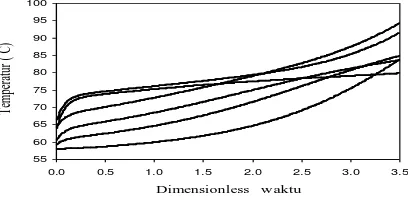
From Figure 4.2 is divided into 3 regions, for regions 1 shows the profile of water activity coefficient decreases and the activity coefficient of ethanol rises, so does not affect the temperature profile. Figure 4.2 shows that the larger the incoming feed water
composition on the influence of ethanol activity coefficient maximum at dimensionless time showed 1.75, after which profiles a constant decline in the end. The bigger the bait into the water composition showed a steeper slope of decline in temperature, because the composition of the bait into the water greatly affects the temperature of the mixture of ethanol-water-HCl, the greater the incoming feed water composition at the higher temperature of the mixture.
For region 2 the temperature profile rises for all the runs, the greater the ethanol composition in feed entry shows the temperature rise slope is more gentle. This is because the composition of the feed into ethanol greatly affects the temperature of the mixture of ethanol-water-HCl, the greater the ethanol composition in feed mixture into a temperature become smaller.
For region 3 the temperature profile rises and some constant, for the temperature profile rises mean the separation of a mixture of ethanol-water-HCl still exist that have not teruapkan ethanol, while for constant composition profile indicates that it is all teruapkan ethanol. The greater the composition of incoming feed water at the temperature of the mixture the greater and faster the temperature profile constant. For the dimensionless time of 3.5 the temperature profile has not been constant, so the dimensionless time required to obtain a larger constant temperature profile. If a simple batch distillation continued until the dimensionless time is very large, then the value will be the composition of each mixture is negative, this is not desired.
Figure 4.2 Profile of the activity coefficient of the ternary system of ABE
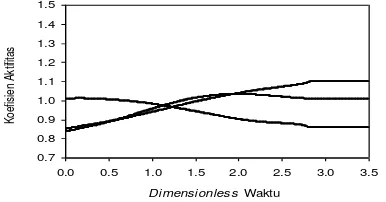
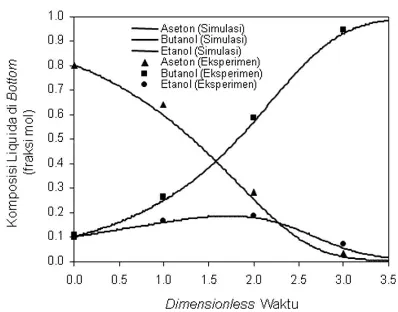
From Figure 4.3 shows the composition profile in the bottom liquida, the composition of ethanol shows the composition profile decreases from the initial composition and the composition of the water showed up from the initial composition profile.
0.9 1.0 1.1 1.2 1.3 1.4 1.5 1.6 1.7 1.8 1.9 2.0
0.0 0.5 1.0 1.5 2.0 2.5 3.0 3.5
Dimensionless Waktu
K
oe
fis
ie
n
A
kt
ifi
ta
0.0 0.1 0.2 0.3 0.4 0.5 0.6 0.7 0.8 0.9 1.0
0.0 0.5 1.0 1.5 2.0 2.5 3.0 3.5
Dim ensionless waktu
Ko
mp
osi
si
L
iq
ui
da
d
i
Bo
tt
o
m
(f
ra
ksi
mo
l)
Figure 4.3. Liquida composition profiles in ternary systems ABE Bottom Run-1
Because ethanol is a component of volatile components while the water component is non-volatile components, as a simple batch distillation process of ethanol component in a larger portion is evaporated and the remaining components of the water. Component of pure water has not been approached with a dimensionless time of 3.5; one way to get more pure water component of the initial composition is to enlarge the composition of the feed water to enter.
Figure 4.4. shows the vapor composition profiles at total reflux for a bottom after the composition of ethanol continues to decline, while the composition of the water continues to rise. This disebakan because volatile components were evaporated in a larger portion and the rest are non-volatile components, after a simple batch distillation process takes place then the non-volatile components are evaporated in a larger portion. Components of ethanol has not evaporate all at dimensionless time 3.5; one way to obtain the components of ethanol in the distillate with a smaller dimensionless time is to enlarge the composition of the feed water to enter. Vapor composition profiles at the bottom of small composition of ethanol on the feed entry, the greater the total composition of ethanol at reflux, this is due to a high temperature so that the mixture of non-volatile components evaporate more. Vapor composition profiles at total reflux for a bottom after the composition of ethanol continues to decline, while the composition of the water continues to rise. This disebakan because volatile components were evaporated in a larger portion and the rest are non-volatile components, after a batch distillation process takes place then the non-volatile components are evaporated in a larger portion. Components of ethanol all teruapkan at dimensionless time shows the value of 2.25; Run-7 requires a smaller dimensionless time to obtain a more pure ethanol component of ethanol component of the initial
0,0 0,1 0,2 0,3 0,4 0,5 0,6 0,7 0,8 0,9 1,0
0,0 0,5 1,0 1,5 2,0 2,5 3,0 3,5 Dim ensionless Waktu
K
om
po
si
si
U
ap
d
i
B
o
tt
o
m
(f
ra
ks
i m
ol
)
Figure 4.4. Vapor composition profiles in ternary systems ABE Bottom Run-1
Temperature profile at the bottom shows the results of the approach with temperatures in the distillate, because the simple batch distillation processes operate in conditions of total reflux. Therefore the temperature profile as Figure 4.5 simulation results is the sum of the i-component temperature after normalization multiplied in the bottom component of the composition of the liquida-i. From Figure 4.5 shows the temperature profile for Run MEP-1 to Run-6 as a whole rose against the dimensionless time. This is because the components
are evaporated with a larger portion is a component of ethanol, so it takes a larger temperature to evaporate the water component that has not evaporated.
Figure 4.5 Profile of the temperature of the ternary system of MEP for Run-1 to Run-6
From Figure 4.6 is divided into 3 regions, for regions 1 shows the profile of water activity coefficient decreases and the activity coefficient of ethanol rises, so does not affect the temperature profile. Figure 4.6 shows that the larger the incoming feed water composition on the influence of ethanol activity coefficient maximum at dimensionless time showed 1.75, after which profiles a constant decline in the end. The bigger the bait into the water composition showed a steeper slope of decline in temperature, because the composition of incoming feed water at the temperature of the mixture greatly affects the MEP, the greater the incoming feed water composition at the higher temperature of the mixture.
For region 2 the temperature profile rises for all the runs, the greater the ethanol composition in feed
55 60 65 70 75 80 85 90 95 100
0.0 0.5 1.0 1.5 2.0 2.5 3.0 3.5 Dimensionless w aktu
Te
m
pe
ra
tur
(
entry shows the temperature rise slope is more gentle. This is because the composition of the feed into ethanol greatly affects the temperature of the mixture of ethanol-water-HCl, the greater the ethanol composition in feed mixture into a temperature become smaller.
For region 3 the temperature profile rises and some constant, for the temperature profile rises mean the separation of a mixture of ethanol MEP still exist that have not teruapkan, while for constant composition profile indicates that it is all teruapkan ethanol. The greater the composition of incoming feed water at the temperature of the mixture the greater and faster the temperature profile constant. For the dimensionless time of 3.5 the temperature profile has not been constant, so the dimensionless time required to obtain a larger constant temperature profile. If a simple batch distillation continued until the dimensionless time is very large, then the value will be the composition of each mixture is negative, this is not desired.
Figure 4.6. Ternary system activity coefficient profile MEP
From Figure 4.7 shows the composition profile in the bottom liquida, the composition of ethanol shows the composition profile decreases from the initial composition and the composition of the water showed up from the initial composition profile. Because ethanol is a component of volatile components while the water component is non-volatile components, as a simple batch distillation process of ethanol component in a larger portion is evaporated and the remaining components of the water. Component of pure water has not been approached with a dimensionless time of 3.5; one way to get more pure water component of the initial composition is to enlarge the composition of the feed water to enter.
Figure 4.7. Composition profiles in the bottom liquida MEP ternary system Run-1
Figure 4.8. shows the vapor composition profiles at total reflux for a bottom after the composition of ethanol continues to decline, while the composition of the water continues to rise. This disebakan because volatile components were evaporated in a larger portion and the rest are non-volatile components, after a simple batch distillation process takes place then the non-volatile components are evaporated in a larger portion. Ethanol components have not evaporate all at dimensionless time 3.5; one way to obtain the components of ethanol in the distillate with a smaller dimensionless time is to enlarge the composition of the feed water to enter. Vapor composition profiles at the bottom of small composition of ethanol on the feed entry, the greater the total composition of ethanol at reflux, this is due to a high temperature so that the mixture of non-volatile components evaporate more. Vapor composition profiles at total reflux for a bottom after the composition of ethanol continues to decline, while the composition of the water continues to rise. This disebakan because volatile components were evaporated in a larger portion and the rest are non-volatile components, after a batch distillation process takes place then the non-volatile components are evaporated in a larger portion. Components of ethanol all teruapkan at dimensionless time shows the value of 2.25; Run-7 requires a smaller dimensionless time to obtain a more pure ethanol component of ethanol component of the initial
Figure 4.8. Vapor composition profiles in ternary systems bottom MEP Run-1
bl ...
0.7 0.8 0.9 1.0 1.1 1.2 1.3 1.4 1.5
0.0 0.5 1.0 1.5 2.0 2.5 3.0 3.5
Dimensionless Waktu
K
oe
fis
ie
n
A
kt
ifi
ta
s
0.0 0.1 0.2 0.3 0.4 0.5 0.6 0.7 0.8 0.9 1.0
0.0 0.5 1.0 1.5 2.0 2.5 3.0 3.5
K
o
m
p
o
s
is
i
liq
u
id
a
d
i
b
o
tt
o
m
(f
ra
k
s
i m
o
l)
0.0 0.1 0.2 0.3 0.4 0.5 0.6 0.7 0.8 0.9 1.0
0.0 0.5 1.0 1.5 2.0 2.5 3.0 3.5
Dimensionless Waktu
K
o
m
p
o
s
is
i
liq
u
id
a
d
i
b
o
tt
o
m
(f
ra
k
s
i m
o
Figure 4.9 Profile of the temperature of the ternary system of ABE for Run-1, Run-7 simulation results and experimental
Figure 4.10. Liquida composition profiles in ternary systems bottom ABE-1 Run the simulation and
experimental results
5. CONCLUSION
1. Ethanol-Water temperature profile-HCl as a whole rose against the dimensionless time, except at the beginning of the process shows the temperature profile decreases, due to the nature of the characteristics of the mixture. 2. Liquida composition profiles of ethanol in the
bottom seteleh process shows the composition of a minimum of ethanol, after the process is complete profile constant composition 3. Ethanol vapor composition profiles in the
bottom seteleh process showed a maximum ethanol composition, once the process is complete profile constant composition. 4. Residue curve map at bottom shows
azeotropic mixture, between the simulation and validation results showed that close to the same profile
Acknowledgments
To the Directorate General of Higher Pedidikan Ministry of National Education (Directorate General of Higher DP2M) Competitive Grant in 2009, which has funded this research.
6. REFERENCES
[1] Fiesser and Fisser, (1963), "Introduction to Chemistry Organic ", Dhiwantara, Bandung. [2] Judoamidjojo, Mulyono, (1992), "Fermentation
Technology", Rajawali Press Jakarta
[3] Kirk Othmer, "Encyclopedya of Chemical Technology", Vol. 8, John Wileys nd Sons. Inc. [4] Sardjoko, (1991), "Biotechnology", Gramedia,
Jakarta.
[5] N. Sari K., Kuswandi, Nonot S., Renanto Handogo, (2006), "Comparison of residue curve maps the ternary system ABE With Methanol-Ethanol-1-Propanol", Journal REACTORS, Department of Chemical Engineering Diponegoro Semarang, Vol. 13, No. 2.
[6] Sari N. K., Kuswandi, Nonot S., Renanto Handogo, (2007), "Separation of Ethanol-Water Binary Systems and ternary systems ABE With Simple Batch Distillation", Journal INDUSTRIAL Journal of Science and Technology, Faculty of Industrial Engineering ITS Surabaya, Vol. 6, 5.
[7] Handogo, R., and G. Authority, (1997), "Experiments and Correlations of Vapor-Liquid equilibria of Acetone-1-Butanol-Ethanol Ternary Mixture", International Conference on Fluid and Thermal Energy Conversion, Yogyakarta, Indonesia, p.. 587-592.
[8] Henley, E. J. and J. D. Seader (1998), "Separation Process Principles", p.. 586-712, John Wiley & Sons, Inc.., New York.
[9] Prausnitz, J. M., (2001), "The Properties of Gases and liquids", ed. 5, p.. A.50 - A. 51, Mc. Graw-Hill, New York.
[9] Rayleigh, L., (1902), Phil. Mag. [Vi.], No. 4 (23), p.. 521.
![PPB STUDI KASUS ANAK BAHAN AJAR Solehuddin [Compatibility Mode]](data:image/gif;base64,R0lGODlhAQABAIAAAP///wAAACH5BAEAAAAALAAAAAABAAEAAAICRAEAOw==)