a
I
SUSTAINABILITY
AS
A
STRATEGIC
BUSIN
ESS
ORIENTATION
IN
GLOBAL
ECONOMY
RECOVTRY
PHASE
Prcicunding 1 ?lir lnklnrniinnal Annual
$YnrPosium on [4anagcnttnt
Maka*sar' **"?*TllilfiI;lilil1l,1[
PROCEEDING
The 1Zth UBAYA International Annual Symposium on Management
SUSTAINABILITY
AS
A
STRATEGIC
BUSINESS
ORIENTATION IN
GLOBAL
ECONOMY RECOVERY PHASE
Makassar, South Sulawesi, Indonesia 13th_1sth March201,4
Proceeding
The 12s UBAYA lnternational Annual Symposium
on
Management
SUSTAINABILITY AS A STMTEGIC
BUSINESS
oNENTATION IN
Gl6;iffiiol.ii',*
RECOVERY PHASE
Editors:
Dudv Anandya' Dr'
gdiitria Aieng P' SE'
Reviewers:
Candra S' Chayadi' Ph'D ' [School of Business' Eastern
lllinois
universityJ
tiversitas Surabaya)',liliJillli;iifltrti,q*'ffi
i,i*u.i.,:--.rdBank
r.,r in g c ao,
tl,
*tY:;;:ii
i*.,.,..r-, A naryst, WahYu Soedarmono'
'fllilx'*ur,'di, Ph'D' [citv of Hongkong UniversitvJ Pu:ll]ii'i.,1'll;r
Management' racultv or Business & Economics
I lniversitas SurabaYa
Il' RaYa Kalirungkut
(,, rrilrrr, lndonesia 60293
il;;'
: +62-3r'2e?rt3e;;;
t+62'3r-2eBr23e1SBN: 978-97 9'99365-9'2
c o pvri ght @ 2'l:*::,'Jffi:x:iot:}1;;;1ffi
nt' F a curtv o f
lsE
FOREWORD
INSYMA has become a tradition of its
own fbr the Management Department of universitas Surabaya
F;;;"."
than a decade this event
has become
a
forumfo. u"ui._l*
-"rApractitioners
to
shareknowledge. au.o
I:i]
l.turug.,o.ri-o"iur,_"r, atways brings theIl::::1.,r.
thar becomes an rmporrant iiue ro. the devetopmint ofThis year, INSYMA raise the theme
SUSTAINABILITY AS A
STRATEGIC BUS-INESS
ORIEiiITION
IN
GLOBALECONOMY RECOVERV
pffeiE.
This themeinreresring,
considering recently, the compani.r-;;
adapting to volatile and uncertain conditions as a way of life to su.ive.
There are some
important business issues and .u.f-r ,.qri.",
a specific and appropriate
response. These issues are namely gor..nun.., lnrorurion,ii;;;i;;r, operations, regulations, risks, strate-g, A-g.o."tfr,
*rrrir"Uifitf
irf:
tand the economy issues rn.. .o_p-un;;;;r.", rrs own way to deal wirh each ol these issue so rtrrr rn.
.lrplr,",
.un achieve business growth and survival.Hundreds of scientific papers are sent
to a conference committee, and the results oFa rigorous selection of ror.,frr, ,O elected.
This paper is
derived from a.variety of authors, u"ir,
.'rffi
and outside the countrv
academics and practitioners. Ail the articres
a;;;il#;#I;',,1;
symposium and documented inthese p.o.".aingr.
I.^ -n:r" that these proceeclings can contribute to the development of scrence and business
,,*i;'
j*ffi
ff
h.i*jfir
:;,ff.Hr {;:,::?
;Jr?rJi:,nt
ML SYMPoSIUM oN MANAGEMENT
Makassar,.,South Suiawesi, Indonesia
13'h-15,h March 2015
lS BN: 978-9 7 g -99365-9 -2
12h UgAYA
JNTqRN*:IIONAL ANNUAL SYMPOSIUM ON MANAGEMENT
CONTENTS
FOREWORD
CONTENTS
H(IMAN RESOARCES
l1l
t
h"
|,
Itr
l.
h,,,
1.
DESIGN OF INDUSTRIAL RELATIONS ANDWAGE SYSTEMS BASED ONHLa4AN
RESOI,E.CE MANAGEMENT PERSPECTIVE
Agung Widhi Kurniawan, Zarah
puspitanirg,d-2.
ANALYSIS ON PERSONALITY AS MODERATING VARIABLE BETWEENINFLUENCE OF ORGANIZATIONAL
CITIZENSHIP BEHAVIOR AND PEMORMANCE;
AND MEDIATION BETWEEN WORK
ENVIRONMENT AND PERFORMANCE (STUDY
ON EMPLOYEES OF PI]BLIC SERVICE INSTITUTION)
Bambang Suko priyono, Euis Soliha, Noviana Dewi
3.
THE IMPROVEMENT OF LECTURERS'PERFORMANCE BASED ON SOCIAL CAPITAL
H.M. Fauzan
4.
ORGANIZATIONAL CITIZENSHIP BEHAVIOR(ocB) AS A STRATEGY TO WrN THE
COMPETITION
Hamsani
5.
PROFESSIONAL COMMITMENT OFACCOLINTANTSAND THE COMMITMENTOF
PUBLIC ACCOTINTING FIRMS ON AUDITOR'S JOB SATISFACTION
Mathius Tandiontong
1zth UBAYA INTERNATIONAL ANNUAL SYMPOSIUM ON Y
6. EFFECT OF BIOGRAPHICAL
E-rian,qcrERISTICS AND cULTURAL
OTVE,NSTTV ON PERFORMANCE
IioiisiurY:clVtL
sERvANrs lN rHEbovEnrurt,rrNT oF LUBUK Ll\GGAU)
Mauiana
A CLOSE,R LOOK ON THE
vrasiurnrrrY/FEMINTNITY DIMENSION
of-isi
i,qvANesE AND cHINE'sE' INDoNESIANFEMALE MANAGERS Mirwan SurYa Petdhana
8.
THE INFLUENCE OF LEADERSHIP STYLE ANDWONT SATISFACTION TOWARDS PERTORMANCE, OT EMPLOYEE \enah Sunarsih' Helmratrn
g.
SERVICE CAPABILITIES OF EMPLOYEE VTTT-ECE DISTRICTS TO PEOPLEiarrsracrroN IN sourH TANGERANG
SoekiYono
10. INTUITION
."
BASED ON RELIGIONT'N,qMBWORK AND IT'S ROLE IN
SMALL-MEDIUM ENTERPRISES (SMES) MANAGER]AL oBCTSTON MAKING: (A CASE STUDY-Oj
PEI'\LONGAN BATIK INDUSTRY-INDONESIA)
Susminingsih
i1.
..
THE DESIGN O!'DESiCION SIJPPORT SYSTEM TOT. TUE ASSESSMENT OF THEPENTONT'I,qNCE OF LECTURE'RS Titik Mildawati
12. THE, EFFECT OF TRANSI'ORMATIONAI I-EADERSHIP ON PERFORMANCE BY TJSING
MOTIVATION WTiTT IOE CHARACTERISTICSS AS MODERATION ROLE
it",i^"^ nil"*i' Kis Indriyaningrum' Anik l(flst1ana
i3
l5
GeN' sza-sz s'99365'9'2
12th UBAYA INTERNATIONAL ANNUAL SYMPOSIUM ON MANAGEMENT
13. POSITIVE EMPLOYER BRANDING A STUDY CASE AT NURUL HAYAT .
SURABAYA
H. Johny Rusdiyanto. Elsye Tandelilin
14. COLLABORATION ON SMEs rN AN INDUSTRY CLUSTER: APPLICATIONS OF COMPETITIVE STRATEGIES FOR INCREASING CAPACITY IN
THE GLOBAL ERA Nor iaty Kresna Darrnasetiauan
15. ON THE MODIFICATION OF LATFERTY'S 1973
..LIFE STYLE INVENTORY" THAT
APPLY TO SPECIFIC CONTEXT OF PUBLIC SERVICES IN
THE GOVERNMENT OFFICES OF EAST JAVA
PROVINCE, INDONESIA 20 14: ASSURING BUSINESS SUSTAINABILITY THROUGH
APPLICATION OF PSYCHOMETRIC MEASUREMENT FOR SELECTION OF EMPLOYEES WHO HAVE HIGH
PERTORMANCE AND SUPERIOR PROFII-E
T. Soemarman, J. L. Eko Nugroho
FINANCE & ACCOUNTIJ\IG
16. FINDING COMPANY W]TH DURABLE
COMPETITIVE ADVANTAGE
THROUGHINTERPRETINCOME STATEMENT (A
CASE STUDY OF GO PUBLIC POULTRY FEED'SCOMPANIES IN INDONESIA) Cliff Kohardinata
17. PLINDAMENTAL FACTORS OF BOND RATING
REGISTERED IN INDONESIA BOND MARKET
DIRECTORY 2OO8-2012 Felix. Agus Zainul Arifin
ISBN: 978-97 9 -99365-9 -z
23
21
Izth UBAYAINTTNry4lO
18. ANALYSIS
,"
oF CAPITAL ASSE',TPRlgryg--M;;;L
GAPM) AND SHARIACOMPLIANT ,ts-ser PiucING MoDE'L (scAPM)c'ise-srupv oN l'qKARi e ISLAMIC INDF'x
Kunto Ardianto, Sutdsno
19.
'-
THE INFLUENCE LEADERSHIP'eilvrnoNMENT '{ND LocATIoN
FoR---COMPENSATION AND JOB SATISFAC]IgN IN
pi-rtaaragam DE'PARTMENT sroRE' TBK' Lra Amatia, rtggY Bintang Nauli
20. OPAQUE FINANCIAL REPORTS AND STOCK
""
PNTCiCRASH RISKN INDONESIA i -,tu, prr.*oto, Eduardus Tandelilin
21. ANALYSIS OF FACTORS AFFECTING-_,
FINANCIAL PERFORMANCE IN MAINTAINING
LirsrsNcs oF sMALL AND MEDIUM
COMPANIES M.SienlY Veronica
22. THE,EFFECT OF RETURN ON INVESTME'NT (ROI) AND BARN-INCS PER SHARE (EPS) SHARE
i'mie PT ASURANSI DAYIN MITRA' TRK
-N1rlu
N,'hutu"uit, HM Hasbi Zaidi
23. VALUE VERSUS GLAMOUR N'{VESTING TN
-"
mioNsslA srocK EXcHANGE
Novan Reza Pahlevi
24. FACTORS THAT AFFECT PROFITABILITY IN TERMS OF COMPLIANCE
EMPIRICAL STUOGi IN BANKING^ COMPANY iHar usrBD IN IDx oN 2009-2013
Nur Aini, YeYe Susilowati
25. EFFORTS TO IMPROVE' COMPANY'S
PROFITABILITY
Rosemarie Sutjiati Njotoprajitno
25
26
28
33
12th UBAYA INTERNATIONAL ANNUAL SYMPOSIUM ON MANAGEMENT
,=,+,r,,il *ljj;;;:4ie& ,gq#:ii4@
26. PREDICTING THE FUTURE, STOCK RETURN
AND ITS PERSISTENCE USING E-INFORMATION IN INDONESIA STOCK EXCHANGE
Sawidji Widoatmodjo 35
27. EFFECT OF FUNDING AND RISK DECISION ON
FINANCING DECISION EMPIRICAL STUDY ON
ISLAMIC BANKING IN INDONESIA
Sutrisno
3628. THE IMPACTS OF TRUST, RISK AND
TECHNOLOGY ACCEPTANCE MODELS ON CONSUMERS' DECISION W]TH CONSUMERS' INTEREST AS INTERVENING VARIABLE
Sri Ismulyaty, Wiu,in Siswantini
29. THE EFFECT OF LOAN DEPOSIT, CAPITAL ADEQUACY, CREDIT RISKAND LIQUIDITY TO
BANKS PERFORMANCE
EMPIRICAI STUDIES IN BANKING COMPANY THAT LISTED IN IDX ON 201O-2012
Yeye Susilowatr, Nur Ainr, Ida Nurhayati, Lrstiyani
30. THE ROLE OF CULTURE DIMENSION IN
MANAGEMENT CONTROL SYSTEM TO
ENHANCE EMPLOYEE'S MOTIVATION
Alex Chandra" Liliana Inggrit Wrjaya, Imanuel Goestaman
31. STOCKMARKET INTEGRATION BETWEEN
MALAYSIA AND INDONESIA
Christopher Tongku, Putu Anom Mahadu,artha
32. EMPIRICAI EVIDENCE OF PzuVATE DEBTS IN INDONESIA
Erick Sugito Suharso, Deddy Marciano, EndangErnawati
33. WORKING CAPITAL MANAGEMENT AND PROFITABILITY: A STLIDY ON CONSUMER
37
39
40
42
1Zth UBAYA INTERNATIONAL ANNUAL SYMPOSIUM qJ]{gM
GOODS INDUSTRY
Dita Yohana Putri Abrianto, Werner Ria Murhadi' Arif Herlambang
34. DAY OF THE WEE,K EFFECT: THE CASE OF ME,XICO, INDONESIA AND TURKEY
Werner R. Murhadi
O P E RAT I O T,{ MANAGE M E NT
INNOVATIVENESS SURVE,Y ON
MANUFACTURING COMPANIE,S IN
TASIKMALAYACITY
Edy Suroso, Ina Primiana
DISCOVERING THE RELIGIOUS
CONTRIBUTION IN HOSPITALITY ORGANIZATION
(BUSINESS CULTURE EXPE,RIENCE FROM
pBraroNcaN BATIK VILLAGE-INDONESIA)
Imam Kanafi. Ade Dede Rohayana, Susminingsih
37. COMBINING ABC-I'UZZY CLASSIFICATION
MODEL FOR DRUGS INVENTORY PLANNING
IN A PHARMACIUTICAL TJNIT OF A PUBLIC
HEALTH CE,NTER (P U SKE S 1IL4 8 DJOMBANG
E,AST JAVA INDONESIA
Indrianawati Usman, MuiYani
38. ANALYSIS OF CI,E.RENT PERFORMANCE
MANAGEMENT PRACTICES OF STATE OWN ENERGY COMPANY IN INDONESIA
CASE STUDY PT XYZ
Muhammad Tresnadi Hikmat
39. MAPPING THE SUPPLY CHAIN OF SHEEP
MEAT DOMBAPADJADJARAN
Muhamad Dzikron, Ina Primiana
ISBN: 978-97 9-99365-9'2 35
36.
48
12th UBAYA INTERNATIONAL ANNUAL SYMPOSIUM ON MANAGEMENT
PERCEPTION OF FOREIGN TOURISTS TOWARDS ORGANIC FOODS IN TOURISM
REGION UBUD, GIANYAR - BALI, INDONESIA
Ni Luh Suastuti, Lidjah Magdalena Massenga
QUALITY SERVICES OF LNIVERSITY BASED ON STUDENT PERSPECTIVE
Ratna Widiastutr
THE EFFECT OF TECHNOLOGY READINESS ON TECHNOLOGY ACCEPTANCE IN USING
SERVICES DELIVERY OF ACADEMIC INFORMATION SYSTEM
Rorim Panday
IMPLEMENTATION OF QUALITY FTINCTION
DEPLOYMENT (QFD) ON LEARNING PROCESS
IN LINIVERSITY X, SURABAYA
Alvin Chrixander Fernaldy, Siti Rahalu, Juliani Dyah T.
THE IMPACT OF SERVICE QUALITY AND
FOOD QUALITY:THE MODERATING ROLE OF ATMO SPHERICS OF KOREAN RE STAT]RANT
.MYOUNG GA' IN SI-IRABAYA
Evina Kurniawan, Fitri Novika Widjaja, Andhy Setyawan
THE EFFECT OF KPOP PRODUCT ON IMAGE
CHANGE AND TRAVEL INTENTION OF
INDONESIA'S RESIDENTS ON SOUTH KOREA AS TOURISM DESTINATION
Happy Lia Sanjaya. Fitri Nor.ika Widjaja, Dudi Anandya
SUSTAINABILITY SUPPLY CHAIN
MANAGEMENT ON MOBILE PHONE FEATURES ACCORDING TO CONSUMER PREFERENCES IN SI]RABAYA
Janice Hendrianto, A. Budhiman Setyawan, Prita A1u
Kusumawardhany
61
ISBN: 978-979 -99365-9-2
40.
55
57
4t.
4t.
43.
44.
45.
46
58
59
1"2th UBAYA INTERNATIONAL ANNUAL SYMPOSIUM ON MANAGEMENT
THE MOTIVES TO JOIN THE SLIRABAYA COSPLAY COMMTINITY
Juliani DyahTrisnawatr
THE IMPACT OF WATCHING REALITY SHOW
MY TRIP MY ADVENTURE TO DESTINATION IMAGE, DESTINATION KNOWLEDGE,
PEOPLE'S ATTITUDE AND TRAVEL INTENTION TO MAKASAR
Regina Juwana, Fitri Novika Widjaja, Dudi Anandya
49. EFFECT OF MICE DESTINATION ATTRIBUTES ON FORMING BALI
TOUzuSTIC IMAGE
Threslia Regina Martha Leuw, Fitri Novika Widjaja, Erna
Andajani
50. EFFECT ANALYSIS OF SUPPLY CHAIN MANAGEMENT FOR COMPETITIVE
ADVANTAGE AND ORGANIZATIONAL PERIORMANCE IN EAST JAVA MANUFACTI]RING COMPANY
Yongky Kristianto Pramana, Stefanus Budy Widjaja, Prita
Ayr Kusumau'ardhany
MARKETING
51. AN INVESTIGATION CUSTOMER LOYALTY ON
INDONESI,{N AIRLINES COMPANY
Anas Hidayat, Wulan Yunita Istianila Dervi
52. THE iMPACT OF INSTITUTION IMAGE,
STUDENT SATISFACTION AND WORD OF
MOUTH
Andy Mulyana. Der i Ay'uni
53. INTEGRATED MARKETING MANAGEMENT
STRATEGY FOR PHARMACEUTICAL
ISBN: 978-979'99365-9'2
47.
48.
66
69
12th UBAYA INTERNATIONAL ANNUAL SYMPOSIUM ON MANAGEMENT
PRODUCTS AND REVIEW FROM BUSINESS ETHICS PERSPECTIVE
Anr-usa Vera Carolina Krlstanto
54. PRODUCT QUALTTY AND PRICE PERCEPTION
BUYING DECISION AGAINST SALONPAS PAIN
RELIEF PATCH IN HYPERMART DAAN MOGOT WEST JAKARTA
Ari Anggarani Winadi Prasetyoning T1,as^ Desy \Vulandari
55. THE INFLUENCE OF PEOPLE SATISFACTION ON SERVICES ORGANIZATION PUBLIC PERFORMANCE VILLAGE DISTRICTS SOUTH OF TANGERANG
Deni Surapto
56. DETERX4INANTS INTERRELATION OF CUSTOMER LOYALTY SIMPATI PREPAID CARDS USERS
Devi Ayuni. Andy Mulyana
57. THE EFFECT OF CONSUMER ATTRIBUTES.
BRAND AWARENESS ATTRIBUTES AND BRAND IMAGE ATTRIBUTES ON BRAND EQUITY AND DECISION TO CHOOSE
EDUCATIONAL SERVICES (CASE STUDY AT
I,T{IVERSITIES IN PEKANBARU CITY)
Gatot Wijayanto
58. THE START UP BUSINESS PROCESS WITH THE USE OF BIRD IN HAND AND AFFORDABLE
LOSS PRINCIPLE
Gek Sintha
59. PERCEPTIONS AND USAGE BEHAVIOR OF THE
NATION-MDE COMMUNICATION AND DATA
MANAGEMENT SYSTEM:A
PHENOMENOLOGICAL STUDY
Grace T. Pontoh, Darwis Said, M. Ishak Amsari, M. Achyar Ibrahim
72
73
12th UBAYA INTqTU$]qY!
60 CI]STOMERDECISION MAKTNG STYLE' BASED
""
ON LOCAI CULTURE
KasnaenY K
61. ROLE OF IN\lovATloN CAPABIL''IYJ
o'
^-a-ir-osn'rc snARTH.LDER vALyEiil;1
;nootH As NTER,ENINGVARIABLE)
Masmira Kurniawati
b2 sT RArt'L', "'
!.'Y,tolr);#t$:il;fflli:
TACASE STL,DY (Monica Francc>ca Liando' Cluistina Yanita Setlauatt
61 THE INFLUENCE OF PREACHERENDORSER
"
iliir'd;-Pu ncunsr NrENrroN 'ti'r'"t*"a *:'anhazmi'Muchsin Muthohar
64. THE TNFLUENCF oF STRATECIc
ADVERTISING
d;
iionr
IY9SPHEREoN
cusr OMER Bu Y"fiCNTEREST s !9
llP
sruDYrN GIANT SUpBffi an*rgi Lrmp sututoH
ARJ o
^s-insBr
YoGYAKARTA)
Munvanto Sigit
65. ANALYSIS OF EFFECT OF IMAGE AND
oIJALITY SERVICE ON CUSTOMER ^.
85il,'*ii*
t*r'i'[r
u rRu sr MEDI Ar roNtA STUDY O, Oi'PUSGiI' "S IN-PATIENTS'
loriiruoN' RIGENCY oF PIJ'I)
',,-,-*''iiutlit"'
Alimuddin R R' Ali Muslthtn66. SURABAYA'S UNIVERSITIES ^STUDJNTS'
SELF
DEVELoPMEol"i'nuiuii * orcHING KoRE
AN
DRAMA ^'i Narl'
Rizky Hanna Ekaputri' Tias A lndarwati' Nadta
Asandimitra
"li:;3$3'HihYi,.'T'"""?**'9t+tr'i'#*
INDONESIA
Selina Gunawan' Lina
80
81
82
83
84
85
86
87
ffiffie-szs-se365'e-2
1 2th U B AYA I NT ERN ATI O N g'_{SgA'"
JM
68. IDENTIFYING INTERESTING THEMES --
-'"
iTsCARoING couNTRY oF oRiGrN EFFECT:A PRELIMINARY STUDY
Sulhaini, Junaidi Sagir
69. HAS THE IMPLEMENTATION OF GREEN
-"'
i'IARGTING BEE'N EFFEcTIvELY woRKED IN INDONESIA?
Wendra Hartono
70. WoRKMOTIVATION
"
AND SERVICE QUALITYol
iiaiE
clvlt- APPARATUS ASINiscBPTNT oF coMMUNITY
SATISFACTION Af THE PUBLIC-SERYCES IN
THE SUB-DISTRICT OF SOUTH TANGE'RANG
CITY
WiwinSiswantini''iamjuddin'DeviA)'uni'AndyMulyana
71. EFFECT oF wEBslrE DESIGN
gyflTY
oN
"'
"o"r-uncH,^s' N,E'NTI.N oF.ILIYP-CUSTOMER, WITTi TT,M,OU'TOR VARIABLE, OF
i,nirsr,ncrroN AND rRusr
T.JuYtu Uu*u-i Putri" Albari
72. SE,RVICE QUALITY COMPANSON BE{WEEN BLuE BIRD ra-ii'q'NJ onBNZ TAxI'BASED oN
CONSUMER'S PT,NCEPTTON IN SUX'{B
AYA
Alan Darmasap**
;;; ;;"
;nandva' chris tin aRahardia
Honantha
73. INFLUENCES OF CONSUMER AITTY'E TOWARD ONT-Ni SRAND COMIVTIJNITY
ON
REVISIT TNTEN iiO\i "ND BRAND^ TRU ST
IN
MAN cHE srER
uxl;r,
oNLiIl
:.YMLINITY ON FACEBOOT"TUNOUCH MODERATION TYPES OF COMN'I[r-|]ITY: MO-C "''9O:Andrerv Sufu'-t' Cfl*ttlu Rahardja Honantha'
Andhy
SetYawan
74. UTILITARIAN AND HEDONIC-MOTIVATORS
EFFECT OF SHOPPERS'DECISION TO
88
B9
90
92
94
95
1 2 th U B AYA I N T E RN ALI g N{L-*UY3}J:Y:-O#J;}:*j)j;*}JM
CONSULTATION WITH HARTONO ^-
--ELEKTRONIKA SALESPERSON IN SURABAYA
Ehrluiun Budianto' Dudi Anandya' Indarini
STRATEGIC MANAGEMENT
75.
'"
SURVIVING CONFLICT: A CASE STUDY OF ior,nrsu INDUSTRY IN MALUKUCharlY HongdiYanto
76. A CONCEPTUAL MODEL OF INCORPORATING
SUSTAINABILITY
iifo
nrNovATIoN AND ITS EFFECT oN BUSINESS PERFORMANCEEsti Dwi RinawiYanti
77. CORPORATE SOCIAL RESPONSIBILIII-1ND
PUBLIC RELATION (A LITERATURE REVIEW)
Helmiatin
78. RETAIL STRATEGY FOR TRADITIONAL MARKE,T IN SURABAYA
Casr sruPv: PASARI(APAS KRAMPUNG iJri Hup,uti, Markus Hartono' Andrianto Gunarvan
79. ORGANIZATIONAL DEVELOPMENT;
'-
iupiertrENTATroN oF THE vAluE-s FoR ON-AANTZATIONAL SU STAIN A BILIT,Y
iWayan Edi Arsawan' Ni Putu Santi Suryanttnt
80. STRATEGIC INNOVATION THROUGJI -. TECHNOLOGV GAONqESS AND ACCEPTANCE
IN IMPLEMENTING ICT FOR CORPORATE SUSTAINABILITY
John TamPil Purba
81. FROM THE SYMBOLIC
"
ICON OF LOTUS IN THE VIETNAME,SE CULTURE''
9-IO
10:
10-:
10i
106,
12d,UBAYA INTERNATIONAL ANNUAL SYMPOSIUM ON MANAGEMENT
RECOMMENDING THE NEW IDEA OF
ORGANIZING THE LOTUS FESTIVAL IN DONG THAP PROV]NCE OF VIETNAM
(PERTOD OF 2015-2020)
Phan Thi Hong Xuan 108
82. BUSINESS CLIMATE FOR SMALL MEDIUM
ENTERPRISES AND E-GOVERNMENT
INITIATIVE
Rizal Hari Magnadi
APPLYING SUSTAINABILITY STR{TEGY FOR SOCIOPRENEUR
Sonata Christian
THE INFLUENCE OF COMPANIES'
CHARACTERISTICS AND ENVIRONMENTAL
CERTIFICATION TOWARDS THE DISCLOSURE OF CSR IN INDONESIA
Wiwiek Dianawati
THE SELECTION OF CLASSIFICATION METHODS IN KANO MODEL FOR SERVICE
INDUSTRY
Yenny Sari
FOR\,I LJI,A'IING }3USINESS STRATHGY FOIi. l'ASI{tflN RHT,qti- BUSTNESS: A CASB STUDY
Yuke Felicia. Liliani
109
111
84.
85.
115
Department of Management Faculty of Business and Economics Universitas $urabaya
EC Building lst Floor
Jl. Raya Kalirungkut, Surabaya, 60293 Ph: +62 31 2981139 Fax +62 31 298123'l ernail: [email protected]
rsBN 1?S-1?1-313t5-1-e
ilililililflilil]tiltililil
ANALYSIS OF FACTORS AFFECTING FINANCIAL PERFORMANCE IN MAINTAINING EXISTENCE OF SMALL AND MEDIUM COMPANIES
M.Sienly Veronica Universitas Kristen Maranatha Email: [email protected]
ABSTRACT
Small and medium companies are companies that can sustain the economy of Indonesia. It can be seen that when the monetary crisis, small and medium companies can survive and thrive, especially small and medium companies engaged in the field of trade, services and investment. In order for the existence of small and medium companies can be maintained and can be improved, the researchers wanted to find out and analyze the factors that affect the financial performance of small and medium companies because by knowing and analyzing these factors, it can be known what factors affect the financial performance of small and medium companies so that small and medium companies may pay attention to these factors in improving its financial performance. In this study, the sampling technique used is probabilistic sampling with simple random sampling method to obtain 54 companies listed with medium size on the Indonesia Stock Exchange on the sub-sectors of trade, services and investment with the observation period from 2009 to 2012. Research variables used in this study are the independent variables consisting of the current ratio (CR), inventory turnover ratio, total asset turnover (TATO), debt to equity ratio (DER), firm size and firm age and the dependent variable is the financial performance measured by return on assets ratio (ROA). The method used to perform hypothesis testing is multiple linear regression. The results of the hypothesis testing is current ratio (CR), inventory turnover, total asset turnover (TATO), debt to equity ratio (DER), firm size and firm age impact the financial performance of the company simultaneously, while partially only current ratio (CR), inventory turnover and the size of the companies that give effect to the company's financial performance. Based on the results of hypothesis testing in general small and medium companies need to consider all the factors that impact the company's financial performance as current ratio (CR), inventory turnover ratio, total asset turnover (TATO), debt to equity ratio (DER), the size of the firm and age of the firm, in particular small and medium companies should pay more attention to the current ratio (CR), inventory turnover and the size of the company in improving the company's financial performance and maintain the company's existence.
Keywords: small and medium companies, financial performance and the existence of the company.
INTRODUCTION
The role of small and medium company is seen from his position as a major player in the various sectors of economic activity, the largest provider of employment, an important player in the development of regional economic activity and community development, creators of new markets and innovation, for small and medium companies that have go international, the small medium companies contribute in maintaining the balance of payments through its contribution in generating export (Urata, 2000 in Harahap, 2014).
and accounts for 59.08% of the Gross Domestic Product (GDP) (Gomulia and Manurung, 2014) so that small and medium companies became the supporting of the Indonesian economy, especially small and medium companies engaged in trade, services and investment. By looking at the role and contributions made by small and medium companies, the small and medium companies need to improve its performance in order to maintain its existence.
One way to improve the performance of companies, especially financial performance of the company is to analyze financial performance through financial statements. The financial report is a tool that describes the condition of the business, decision-making tool that is accurate and timely, and accountability in the management (Harahap, 2014).
Financial performance analysis is used to determine the extent to which the effectiveness of the company's operations in achieving its objectives. To assess the financial performance of companies can use ratio analysis where the ratio analysis is a tool that can explain or give an idea of the good or bad financial condition of a company (Munawir, 2007).
There are various types of ratios that can be used in the analysis of ratios such as liquidity ratios, solvency ratios, activity ratios, profitability ratios and the ratio of the market, to measure the financial performance can use the ratio of profitability due to a consistent level of profitability will be a benchmark of how the company is able to survive in the business to obtain an adequate return compared to the risks (Prihadi, 2008). One of the profitability ratio that can be used to measure a company's financial performance is return on assets (ROA) where ROA is a measure of the rate of profit to assets used in generating profits (Prihadi, 2008).
Another factor that can influence in improving the performance of the company is the size of the company and the age of the company. The size of a company plays an important role indetermining the kind of relationship the company enjoys inside and outside its operating environment, and itaffects its financial performance in many ways. Company size has been considered as an important determinant of company profitability (Babalola, 2013). The age of the company also has an important role in measuring the financial performance of companies in which the older the company, the cost to produce goods and services become low so that it will affect the earnings and profits (Pathirawasam and Wickremasinghe, 2012). The age of the company can show that the company still exists and is able to compete. Thus, the age of the company can be attributed to the financial performance of a company. If a company has good financial performance, the company will be able to maintain business continuity (Sembiring, 2003).
Based on the description above, the author is interested to analyze the factors that impact the financial performance in maintaining the existence of small and medium companies.
LITERATURE REVIEW AND DEVELOPMENT OF HYPOTHESES
Small and Medium Business
In accordance with Act No. 20 of 2008, the definition of small and medium companies are: (depkop.go.id in Veronica, 2014)
a. Small businesses: productive economic activities that are carried out by the independent individual or business entity that is not a subsidiary or branch company not owned, controlled or become part either directly or indirectly, of a medium or large businesses that meet the criteria for small businesses as referred to in this law.
b. Medium-sized businesses: productive economic activities are independent, which is done by an individual or business entity that is not a subsidiary or branch company owned, controlled or become part either directly or indirectly with a small business or large businesses with total net assets or results annual sales as stipulated in this law.
Criteria for small businesses is to have a net worth of more than fifty million Rupiah up to at most five hundred million Rupiah, excluding land and buildings, and has annual sales of more than three hundred million to a maximum of two and a half billion Rupiah.
Criteria for medium-sized businesses is to have a net worth of more than five hundred million Rupiah up to at most ten billion rupiah excluding land and buildings, and has annual sales of more than two and a half billion to at most fifty billion Rupiah.
Factors Affecting Financial Performance
The financial performance of the company is a picture resulting from the financial analysis tool that shows the company's financial condition is good or bad. There are various factors that may affect financial performance, among others, the company's liquidity, the amount of the company debt, the use of company assets, firm size and firm age. The relationship between these factors with the company's financial performance will be explained as follows:
1. Liquidity Ratio and Financial Performance
Liquidity company shows the company's ability to fund its operations and repay its short-term liabilities. Liquidity of the company can be measured through financial ratios such as: current ratio, cash ratio and quick ratio. Liquidity of the company is able to be a predictive tool to measure the level of financial performance. Current ratio is often used as a measure of liquidity (Asiah, 2011). In this study using the current ratio to measure the liquidity of the company in which the current ratio is the abilitiy of the current assets to pay the short-term liabilities. Short-term liquidity is important because the problems in the short-term cash flow could make the company be bankrupt (Darsono and Ashari, 2005). Several studies like Asiah (2014), Khalifa and Shafii (2013), Carvalho et al (2013) and Shakoor et al (2012) stated that the current ratio influence on financial performance.
2. Leverage Ratio and Financial Performance
Leverage or solvency ratio is the ratio to determine the company's ability to pay its obligations if the company is liquidated and assess constraints in the company to borrow money (Darsono and Ashari, 2005). Any use of debt by the company will influence the risk and return. The debt ratio can be used to see how big the company's financial risk (Asiah, 2011). Solvency ratio used in this study is the debt to equity ratio. The results of the study of Asiah (2011), Noor (2011), Pathirawasam and Wickremasinghe (2012) and Shakoor et al (2012) concluded that the debt-to-equity ratio influence on financial performance in which a large amount of debt that will affect the profitability of companies due to the more large debts then there are large interest to be paid so that will reduce the profit, on the other hand if the company is unable to pay the debt shows the company's financial performance is not good.
3. Activity Ratio and Financial Performance
4. The Size of the Company and Financial Performance
According to Rajan and Zingales (1995) in Izati and Margaretha (2014) size is expected to be one factor in the performance of the company. Size can have a positive effect on firm performance. Margaretha (2011) in Izati and Margaretha (2014) explains that the amount of assets of the company will make the company more easier to raise capital compared with companies that have a lower asset, in addition to the existence of sufficient assets to be able to increase sales and could increase profits. Several studies like Khalifa and Shafii (2013), Mishra et al (2009) and Babalola (2013) states that there are significant between firm size and financial performance.
5. Age Company and Financial Performance
Age company can show that the company still exists and is able to compete.Thus, the age of the company can be attributed to the financial performance of a company. If a company has good financial performance, the company will be able to maintain business continuity (Sembiring, 2003). The age of the firm is an important variable in determining its financial performance. When the firm becomes older, it enjoys economies of scale. This means that the firm can produce products at lower costs and this will cause an increase in revenue and profits (Pathirawasam dan Wickremasinghe, 2012).
Based on the description above, the development of the hypothesis is:
H1: There is the influence of the current ratio, debt to equity ratio, total asset turnover, inventory turnover, firm size and age of the company to the company’s financial performance simultaneously.
H2: There is the influence of the current ratio, debt to equity ratio, total asset turnover, inventory turnover, firm size and age of the company to the company’s financial performance partially.
Research Model
H1
X1: Current Ratio
H2
X2: Debt To Equity Ratio
X3: Total Assets Turnover Y : Financial Performance
X4: Inventory Turnover
X5: Firm Size
X6: Age
RESEARCH METHODOLOGY
Types of Research
The purpose of this study was to determine what factors are to give effect to financial performance in maintaining the existence of small and medium companies. Based on the purpose of this study, the type of this research is the research hypothesis testing. Research hypothesis testing research is designed with the aim to test the hypothesis typically used to determine the relationship between the variables that are causal and correlation relationship (Suliyanto, 2009).
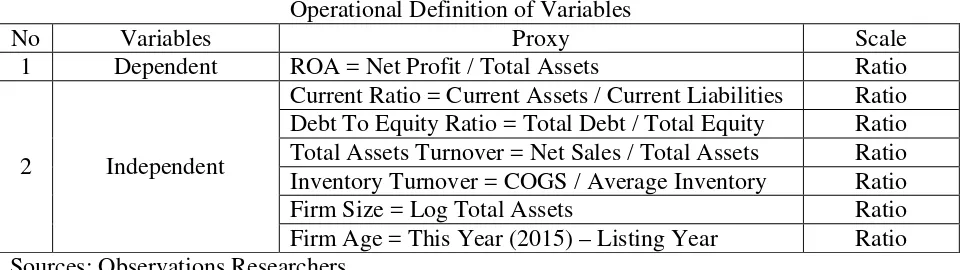
Operational Definition of Variables
In this study using two types of variables: the independent variables and the dependent variable. Defining variables used can be seen in the table below:
Table 1
Operational Definition of Variables
No Variables Proxy Scale 1 Dependent ROA = Net Profit / Total Assets Ratio
2 Independent
Current Ratio = Current Assets / Current Liabilities Ratio Debt To Equity Ratio = Total Debt / Total Equity Ratio Total Assets Turnover = Net Sales / Total Assets Ratio Inventory Turnover = COGS / Average Inventory Ratio Firm Size = Log Total Assets Ratio Firm Age = This Year (2015) – Listing Year Ratio Sources: Observations Researchers
Population, Sample and Sampling Techniques
The population used in this study are all companies listed in Indonesia Stock Exchange are included in the category second board. The samples are companies listed in Indonesia Stock Exchange in the category seconf board with sub-sector in trade, services and investment, the observation period 2009 - 2012 in which there are 54 companies were used as samples. Sample selection at the Indonesia Stock Exchange on second board because of the similarity criteria between small and medium companies and criteria listed company on second board that is on net worth where the small and medium companies have net assets is between five hundred million to at most ten billion Rupiah and listed companies on second board must have a net worth of at least five billion rupiah, beside that many small and medium companies engaged in the field of trade and services (Veronica, 2014).
The sampling technique used was simple random sampling in which every member of the population is given an equal opportunity to be sampled (Suliyanto, 2009).
Data Analysis Methods
The method used to perform data analysis is multiple linear regression. This method was chosen for this study aimed to investigate the influence of the independent variables and the dependent variable. Used multiple linear regression to see how the relationship between a dependent variable with more than one independent variable (Nazir, 2011). Multiple linear regression equation is:
Y = a + b1 X1 + b2 X2 + b3 X3 + b4 X4 + b5 X5 + b6 X6 + e ...(1)
in which:
b1,b2,b3,b4,b5 dan b6 is regression coefficient
X1 is Current Ratio (CR) X5 is Firm Size
X2 is Debt To Equity Ratio (DER) X6 is Firm Age
X3 is Total Asssets Turover (TATO)
X4 is Inventory Turnover
RESULTS AND DISCUSSION
Data
The data used in this study are the companies listed on the Indonesia Stock Exchange on second board with sub-sector trade, services and investment. The number of companies that are used by 54 companies which can be seen in appendix 1 and the observation period from 2009 - 2012. Data of financial ratios and other factors also can be found in appendix 1.
Classical Assumption Test
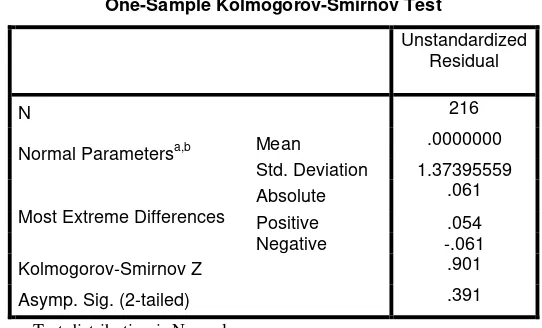
Normality test is to see whether the value of the residuals are normally distributed or not. Good regression model is to have a residual value that is normally distributed (Kurniawan, 2014). Results of tests of normality in this study are:
Table 2
Result For Normality Test
One-Sample Kolmogorov-Smirnov Test
Unstandardized Residual
N 216
Normal Parametersa,b Mean .0000000 Std. Deviation 1.37395559
Most Extreme Differences
Absolute .061 Positive .054 Negative -.061
Kolmogorov-Smirnov Z .901
Asymp. Sig. (2-tailed) .391
a. Test distribution is Normal. b. Calculated from data.
Sources: SPSS 20.00
Based on these results it can be concluded that the data used in this study were normally distributed because the value Asym.Sig (2-tailed) which is greater than the value of alpha (α) used in this study is equal to 0.01 or 1%.
Table 3
Result For Multicollinearity Test
Model Collinearity Statistics Tolerance VIF
1
(Constant)
CR .600 1.666 DER .473 2.115 TATO .508 1.967 InvTurnover .618 1.617 Size .806 1.240 Age .870 1.150
a. Dependent Variable: ROA
Sources: SPSS 20.00
Based on the results it can be concluded that multicollinearity test all the independent variables used free of multicollinearity because VIF produced no more than 10 and the value of Tolerance not less than 0.1
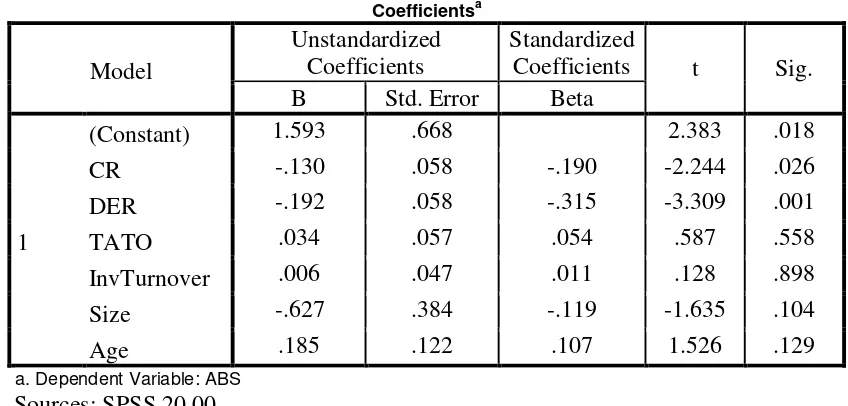
Heteroscedasticity test is to see whether there is inequality of variance of residuals one observation to another (Kurniawan, 2014). Heteroscedasticity test results in this study are:
Table 4
Result For Heteroscedasticity Test
Sources: SPSS 20.00
Based on the results it can be concluded that the heteroscedasticity test only variable debt to equity ratio (DER) that do not pass the test because of significant heteroscedasticity is smaller
than the value of alpha (α) used in this study is equal to 0.01 or 1%. Therefore variable debt
to equity ratio (DER) were excluded from the research.
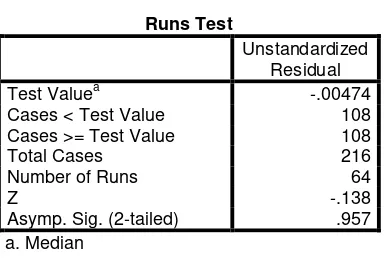
Autocorrelation test aims to determine whether there is a correlation between confounding variables at certain periods with variable disturbance previous period. Good regression model
Coefficientsa
Model
Unstandardized Coefficients
Standardized
Coefficients t Sig. B Std. Error Beta
1
(Constant) 1.593 .668 2.383 .018 CR -.130 .058 -.190 -2.244 .026 DER -.192 .058 -.315 -3.309 .001 TATO .034 .057 .054 .587 .558 InvTurnover .006 .047 .011 .128 .898 Size -.627 .384 -.119 -1.635 .104 Age .185 .122 .107 1.526 .129
requires no error autocorrelation (Kurniawan, 2014). Autocorrelation test results in this study are:
Table 5
Result For Autocorrelation Test
Sources: SPSS 20.00
Based on the results of autocorrelation test concluded that all the independent variables are free of autocorrelation because Asym.Sig (2-tailed) its value is greater than the value of alpha
(α) used in this study is equal to 0.01 or 1%.
Classic assumption test conducted showed that all the independent variables and the dependent variable was eligible classical assumptions except the variable debt to equity ratio (DER) so that all of variable can be used for hypothesis testing using multiple linear regression.
Hypothesis Testing
Simultaneously, the research hypothesis (H1) is "There is the influence of the current ratio,
total asset turnover, inventory turnover, firm size and age of the company's financial performance simultaneously."
Hypothesis statistics:
H0: There is no influence of the current ratio, total asset turnover, inventory turnover, firm
size and age of the company's financial performance simultaneously.
H1: There is the influence of the current ratio, total asset turnover, inventory turnover, firm
size and age of the company's financial performance simultaneously. The results of hypothesis testing can be seen in the table below:
Table 6
Hypothesis Testing Results Simultaneously
Sources: SPSS 20.00
Based on the results of simultaneous testing can be concluded that all the independent variables used in this study is the current ratio, total asset turnover, inventory turnover, firm size and age influence on the company's financial performance because the Sig value is 0,000
Runs Test
Unstandardized Residual
Test Valuea -.00474
Cases < Test Value 108 Cases >= Test Value 108
Total Cases 216
Number of Runs 64
Z -.138
Asymp. Sig. (2-tailed) .957 a. Median
ANOVAa
Model Sum of Squares df Mean Square F Sig.
1
Regression 56.487 6 9.415 6.095 .000b Residual 290.372 188 1.545
Total 346.859 194 a. Dependent Variable: ln_ROA
less than the value of alpha ( α) used in this study is equal to 0.01 or 1% so that the research
hypothesis (H1) is accepted.
These results are supported by research conducted by Noor (2011) and Asiah (2011) which concluded that the simultaneous current ratio, total asset turnover and inventory turnover give effect to the company's financial performance.
Partially research hypothesis (H2) is "There is the influence of the current ratio, total asset
turnover, inventory turnover, firm size and age of the company's financial performance partially."
Hypothesis statistics:
H0: There is no influence of the current ratio, total asset turnover, inventory turnover, firm
size and age of the company's financial performance partially.
H1: There is the influence of the current ratio, total asset turnover, inventory turnover, firm
size and age of the company's financial performance partially. The results of hypothesis testing can be seen in the table below:
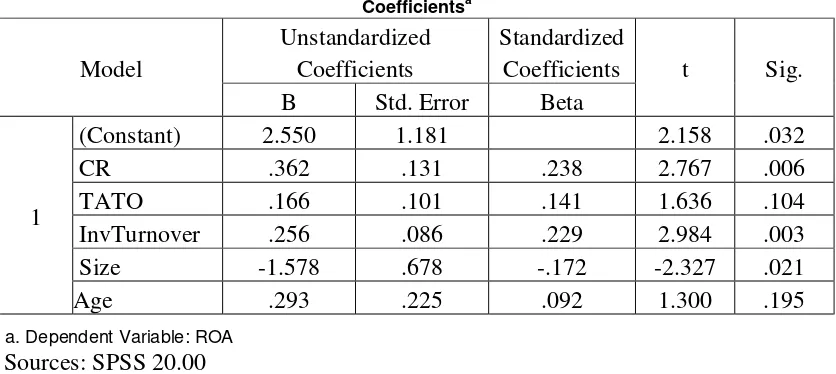
Table 7
Hypothesis Testing Results Partially
Sources: SPSS 20.00
Based on the partial test results concluded that the only variable current ratio, inventory turnover and size that gives effect to the company's financial performance, while total assets turnover and age did not affect the financial performance of the company. The results are consistent with several studies such as Asiah (2011) which states that the current ratio and inventory turnover affect the company's financial performance, Khalifa and Shafii (2013) stated that the current ratio, inventory turnover and size influence on the company's financial performance and Carvalho et al (2013) stated that the size and liquidity affect the company's financial performance.
Current ratio influence on the financial performance because the current ratio is used to measure the liquidity of the company, so that when the liquidity of the company was high, it shows that the company is able to pay all its short-term debt that the company reduced debt and financial performance measure from profitability will be good because the company liquid.
Inventory turnover impact the financial performance because inventory turnover indicates how quickly inventory is converted into products that will make money, the faster inventory turnover made the inventory not accumulate in warehouse and companies will quickly earn money and profit will increase, so will affect the company's financial performance.
Coefficientsa
Model
Unstandardized Coefficients
Standardized
Coefficients t Sig. B Std. Error Beta
1
(Constant) 2.550 1.181 2.158 .032 CR .362 .131 .238 2.767 .006 TATO .166 .101 .141 1.636 .104 InvTurnover .256 .086 .229 2.984 .003 Size -1.578 .678 -.172 -2.327 .021 Age .293 .225 .092 1.300 .195
Firm size indicates how many assets the company has, the more assets that the company has made the company has a large working capital. With a large working capital, the company can make an investment, the purchase of raw materials or the payment of debts of the company so that can enhance the company's revenue and financial performance will be good.
CONCLUSIONS AND SUGGESTIONS
Based on the research results it can be concluded:
1. Simultaneously with using α = 1% of all study variables except the debt to equity ratio (DER) impact on financial performance.
2 Partially by using α = 1% only variable current ratio, inventory turnover and size that gives
the effect on the financial performance.
Suggestions can be given to companies and research in the future are:
1. For small and medium companies need to consider all the factors that impact the financial performance such as current ratio, inventory turnover ratio and firm size in order to better financial performance so that the company can maintain the existence of the business.
2. For further research, researcher can add the factors that impact the financial performance as the net profit margin, receivable turnover, besides adding the time of observation and the sample used.
BIBLIOGRAPHY
Asiah, Antung Noor, 2011, Analisis Faktor-Faktor Yang Mempengaruhi Kinerja Keuangan Industri Tekstil Yang Terdaftar Pada Bursa Efek Indonesia, Socioscientia (Jurnal Ilmu-Ilmu Sosial), Volume 3, Nomor 2.
Babalola, Yisau Abiodun, 2013, The Effect of Firm Size on Firms Profitability in Nigeria,
Journal of Economics and Sustainable Development, Vol.4, No.5.
Carvalho, Pedro Guedes de; Serrasqueiro, Zélia; Nunes, Paulo Maçãs, Profitability Determinants of Fitness SMEs: Empirical Evidence from Portugal Using Panel Data,
Amfiteatru Economic, Vol. XV, No.34.
Darsono dan Ashari, 2005, Pedoman Praktis Memahami Laporan Keuangan, Penerbit ANDI, Yogyakarta.
Gomulia, Budiana dan Manurung, Elvy Maria, 2014, Identifikasi Modal Keluarga Pada 3 Ukm Di Bandung, Bina Ekonomi Majalah Ilmiah Fakultas Ekonomi Unpar, Vol. 18, No. 1.
Harahap, Yenni Ramadhani, 2014, Kemampuan Menyusun Laporan Keuangan Yang Dimiliki Pelaku UKM Dan Pengaruhnya Terhadap Kinerja UKM, Jurnal Riset Akuntansi Dan Bisnis, Vol 4, No.1.
Izati,Chaerunisa dan Margaretha, Farah, 2014, Faktor-Faktor Yang Mempengaruhi Kinerja Keuangan Pada Perusahaan Basic Industry And Chemicals Di Indonesia, e-Journal Manajemen Fakultas Ekonomi Universitas Trisakti, Volume. 1, Nomor.2, Hal. 21 -43. Kasmir, 2008, Analisis Laporan Keuangan, Edisi 1, Rajawali Pers, Jakarta.
Khalifa, Mohamed Khalifa dan Shafii, Zurina, 2013, Financial Performance and Identify Affecting Factors in this Performance of Non-oil Manufacturing Companies Listed on Libyan Stock Market (LSM), European Journal of Business and Management, Vol.5, No.12.
Kurniawan, Albert, 2014, Metode Riset Untuk Ekonomi & Bisnis, Cetakan Kesatu, Penerbit ALFABETA, Bandung.
Mishra, Ashok; Wilson, Christine; Williams, Robert, 2009, Factors Affecting Financial Performance Of New And Beginning Farmers, Agricultural Finance Review, Vol. 69 No. 2., pp. 160-179.
Munawir, S., 2007, Analisis Laporan Keuangan, Penerbit Liberty, Yogyakarta.
Noor, Akhmad Syafrudin, 2011, Analisis Faktor-Faktor Yang Mempengaruhi Kinerja Keuangan Perusahaan Telekomunikasi Yang Go Public Di Bursa Efek Indonesia,
Jurnal Manajemen dan Akuntansi, Volume 12, Nomor.1.
Pathirawasam,Chandrapala and Wickremasinghe, Guneratne, 2012, Ownership Concentration And Financial Performance: The Case Of Sri Lankan Listed Companies, Corporate Ownership & Control, Volume 9, Issue 4.
Prihadi, Toto, 2008, Deteksi Cepat Kondisi Keuangan: 7 Analisis Rasio Keuangan, Penerbit PPM, Jakarta.
Sembiring, Eddy Rismanda, 2003, Kinerja Keuangan, Political Visibility, Ketergantungan Pada Hutang, Dan Pengungkapan Tanggung Jawab Sosial Perusahaan, Simposium Nasional Akuntansi VI, Surabaya.
Shakoor, Faisal; Khan, Abdul Qayyum; Nawab, Samina, 2012, The Inter-Linkages Of Working Capital And Profitability In Pakistan (2001-2010), Academic Research International, Vol. 3, No.2.
Suliyanto, 2009, Metode Riset Bisnis, Edisi II, Penerbit ANDI, Yogyakarta.
APPENDIX I
DATA COMPANY, FINANCIAL RATO AND OTHER FACTORS
No Nama
Perusahaan Tahun
Rasio Keuangan
Total
Assets Size
Tahun
Berdiri Umur Rasio
Likuiditas
Rasio
Solvabilitas Rasio Aktivitas
Rasio Profitabilitas CR DER TATO Inv Turnover ROA
1 ABBA
2009 2.1611 0.44 0.6419 1.041 0.62 229,920 5.361577 1992 22 2010 0.8539 2.11 0.4445 1.2146 0.46 399,906 5.601958 1992 22 2011 0.8156 2.23 0.5827 1.3697 0.66 425,864 5.629271 1992 22 2012 0.8211 2.25 0.5991 1.0028 0.92 441,554 5.644984 1992 22
2 AIMS
2009 1.1303 7.78 1.2241 1.202 0.36 182,576 5.261444 1997 17 2010 1.1731 5.88 1.5818 1.5649 0.31 146,195 5.164933 1997 17 2011 1.1579 6.49 1.4379 1.4173 0.35 163,296 5.212976 1997 17 2012 1.9974 1.05 5.5355 5.4677 1.14 45,766 4.660543 1997 17
3 ASIA
2009 2.1932 0.56 2.037 6.3212 7.47 74,906 4.874517 1989 25 2010 8.2159 0.27 1.4579 5.1191 5.08 65,266 4.814687 1989 25 2011 9.3999 0.39 0.1262 1.3737 -15.09 58,681 4.768498 1989 25 2012 7.5494 0.44 0.0953 8.7559 -12.36 51,672 4.713255 1989 25
4 BAYU
2011 2.2377 0.54 0.409169368 1.083560453 5.19 18,857,504 7.275484 1989 25 2012 3.0181 0.42 0.359113067 0.875685896 7.25 27,253,915 7.435429 1989 25
6 BNBR
2009 0.6343 3.64 0.27871703 3.662266966 -5.03 27,381,757 7.437461 1951 63 2010 2.434 1.69 0.412657172 1.862805105 -22.03 31,768,029 7.50199 1951 63 2011 1.0072 1.07 0.383218647 1.19745293 0.34 25,212,651 7.401619 1951 63 2012 1.4976 1.87 0.988615615 4.293805917 2.27 15,657,587 7.194725 1951 63
7 CENT
2009 5.6313 0.17 0.645253766 3.143741033 10.49 102,555 5.010957 1987 27 2010 1.2359 2.76 0.882748199 1.509153643 1.11 327,560 5.515291 1987 27 2011 7.2143 0.17 0.577388632 2.199288551 -0.01 105,416 5.022907 1987 27 2012 3.4259 0.3 0.513432447 3.426049678 -6.81 107,352 5.03081 1987 27
8 CLPI
2009 1.9135 0.9 2.043604214 3.426526046 14.1 219,199 5.340839 1988 26 2010 1.8454 1.05 1.875812935 3.514768193 10.33 275,391 5.43995 1988 26 2011 1.5827 1.43 1.67046199 3.384395914 7.42 373,969 5.572836 1988 26 2012 1.6047 1.21 1.488446065 2.745592803 7.66 439,201 5.642663 1988 26
9 CNKO
2009 2.039 0.34 0.400142293 8.986171884 0.31 878,470 5.943727 1999 15 2010 1.46 0.67 0.628483952 2.721589719 5.83 1,212,739 6.083767 1999 15 2011 1.3249 1.04 0.605899728 1.884593559 5.35 1,710,689 6.233171 1999 15 2012 1.6302 0.64 1.007926837 6.102332086 5.43 1,503,500 6.177103 1999 15
10 DNET
2009 1.1898 0.16 0.926557263 23.40408163 1.09 17,306 4.238197 1995 19 2010 2.8722 0.15 0.987079327 17.5 2.64 16,640 4.221153 1995 19 2011 0.9959 0.33 1.073193528 11.65667808 4.05 17,119 4.233478 1995 19 2012 0.8627 0.32 0.828012603 4.903724928 1.31 16,821 4.225852 1995 19
11 EPMT
2009 1.9353 0.86 2.863230372 6.486775521 11.02 2,986,182 6.475116 1988 26 2010 1.9268 0.81 2.984506739 6.92461841 7.91 3,254,770 6.51252 1988 26 2011 1.98 0.79 2.427522115 6.309383729 8.03 4,370,747 6.640556 1988 26 2012 1.8137 0.92 2.700701862 6.909722664 8.13 4,951,688 6.694753 1988 26
12 FAST
2012 1.7679 0.8 1.997572263 32.84402037 11.56 1,781,906 6.250885 1978 36
13 FISH
2009 1.2217 2.7 3.734052764 27.50845791 5.85 557,385 5.746155 1992 22 2010 1.1623 4.42 3.786707563 18.89264095 5.05 1,101,333 6.041919 1992 22 2011 1.0984 7.64 3.776461672 32.97052695 1.76 2,020,101 6.305373 1992 22 2012 1.1289 6.45 5.103101333 37.0520633 4.29 2,481,578 6.394728 1992 22
14 FORU
2009 1.7186 1.37 1.772998489 2.995077564 2.86 230,276 5.362249 1970 44 2010 1.6255 1.63 1.772791664 2.596267441 3.49 276,011 5.440926 1970 44 2011 1.7412 1.29 1.900895888 2.731174616 4.87 265,993 5.42487 1970 44 2012 1.8509 1.05 1.866438875 2.888305353 4.92 257,253 5.41036 1970 44
15 GEMA
2009 1.129 4.29 1.193757859 6.279666412 1.82 319,698 5.50474 1984 30 2010 1.3855 3.02 1.289711776 4.046064069 7.52 347,611 5.541094 1984 30 2011 1.5595 2.31 1.383308064 9.03227829 7.38 374,636 5.57361 1984 30 2012 1.6126 2.02 1.394580315 7.082474884 6.7 428,881 5.632337 1984 30
16 GMCW
2009 0.6053 1.59 1.064916553 7.009508716 11.64 16,837 4.226265 1989 25 2010 0.6445 0.82 1.226078495 7.06851312 12.82 15,415 4.187944 1989 25 2011 1.316 0.8 1.070620605 2.678126557 17.87 19,626 4.292832 1989 25 2012 1.9552 0.52 1.03788563 5.060189166 13.95 21,037 4.322984 1989 25
17 HOME
2009 0.3256 0.67 0.147959656 5.301848642 0.73 183,523 5.26369 1986 28 2010 0.9767 0.66 0.179009177 5.564744944 1.43 186,996 5.271832 1986 28 2011 1.2204 0.55 0.235440682 2.915606336 0.46 176,193 5.245989 1986 28 2012 1.2212 0.32 0.143029625 3.154492646 -3.38 268,350 5.428702 1986 28
18 ICON
2009 0.7699 3.15 0.264577679 1.349775785 -7.72 12,159 4.084898 2001 13 2010 0.3497 9.04 0.346045694 2.697674419 -15.78 11,380 4.056142 2001 13 2011 1.071 4.5 1.194044188 3.01852146 0.68 91,608 4.961933 2001 13 2012 1.0231 3.15 1.490850875 3.136375095 1.44 82,139 4.914549 2001 13
19 INPP
20 INTA
2009 1.7461 1.91 1.07642151 3.088203359 3.6 1,039,511 6.016829 1975 39 2010 1.2255 2.91 1.121277457 6.869907724 5.17 1,634,904 6.213492 1975 39 2011 0.8397 5.96 0.802672236 4.427629038 3.22 3,737,918 6.57263 1975 39 2012 0.866 7.53 0.607364531 4.191472293 0.29 4,268,975 6.630324 1975 39
21 INTD
2009 0.488 -1.95 2.254241638 29.43109541 -2.11 35,069 4.544923 1976 38 2010 1.6075 3.67 1.91213281 13.51982741 4.69 42,587 4.629277 1976 38 2011 1.6845 2.72 1.919642078 5.047293381 10.95 57,331 4.75839 1976 38 2012 2.1646 1.79 1.906613845 7.12037286 7.23 53,766 4.730508 1976 38
22 ITMA
2009 0.2322 0.59 0.581122227 0 15.5 13,794 4.13969 1987 27 2010 0.1406 1.92 0 0 -28.89 12,414 4.093912 1987 27 2011 2.0499 2.44 0.016656526 0 -11.34 13,148 4.11886 1987 27 2012 5.3711 0.02 0.075783254 0 31.52 266,708 5.426036 1987 27
23 ITTG
2009 0.9163 -3.03 1.581249096 4.720016486 -44.72 27,668 4.441978 1999 15 2010 0.5817 -1.6 1.287128713 5.726027397 262.83 3,333 3.522835 1999 15 2011 4.0312 -2.08 4.653950954 515.953125 -16.53 7,340 3.865696 1999 15 2012 51.64 0.04 0 0 -3.97 93,979 4.973031 1999 15
24 JSPT
2009 0.8486 1.15 0.368753873 2.86742756 5.7 2,598,210 6.414674 1975 39 2010 0.9788 0.91 0.418215072 2.444219768 6.86 2,480,133 6.394475 1975 39 2011 1.5478 0.78 0.373483552 1.5963095 6.97 2,873,492 6.45841 1975 39 2012 1.6661 0.83 0.36466759 2.134691169 7.11 3,308,945 6.51969 1975 39
25 JTPE
2009 1.4174 0.82 1.69067675 6.486928211 15.83 160,266 5.204841 1990 24 2010 2.2945 0.54 1.886805065 18.57298283 31.97 236,371 5.373594 1990 24 2011 1.4904 0.68 1.627735096 21.1108589 25.57 311,735 5.493786 1990 24 2012 1.3712 1.16 0.93749986 3.664641053 9.5 446,703 5.650019 1990 24
26 KBLV
2010 1.1506 3.09 1.431873336 3.819757152 1.22 510,960 5.708387 2001 13 2011 0.9075 16.45 2.282219832 4.493966605 -35.1 307,753 5.488202 2001 13 2012 1.1516 5.58 2.611621984 3.625509056 9.95 336,896 5.527496 2001 13
28 KONI
2009 1.0588 3.22 0.557900276 4.163551402 5.89 93,117 4.969029 1987 27 2010 1.12 2.62 0.918058486 6.006717124 1.62 84,841 4.928606 1987 27 2011 1.3226 1.84 0.894217488 4.954915649 4.09 75,296 4.876772 1987 27 2012 1.3816 1.88 0.946060247 4.534442544 2.7 82,759 4.917815 1987 27
29 LMAS
2009 1.1679 4.59 0.916024455 3.705323004 -1.59 217,218 5.336896 1996 18 2010 0.9792 4.19 1.061851407 5.906307863 4.42 256,324 5.408789 1996 18 2011 1.1892 2.46 0.978470199 4.60730779 0.13 254,020 5.404868 1996 18 2012 1.1701 2.84 0.721568902 3.36628668 -1.29 271,859 5.434344 1996 18
30 LPLI
2009 10.23 0.1 0.084759078 3.025023941 -13.37 957,219 5.981011 1983 31 2010 15.95 0.07 0.053081852 0.619879858 23.92 1,363,969 6.134804 1983 31 2011 12.51 0.1 0.085132651 2.196900086 -17.4 1,177,715 6.07104 1983 31 2012 21.79 0.06 0.05843699 1.806926278 18.36 1,590,431 6.201515 1983 31
31 LPPF
2009 0.6917 5.38 0.405189301 56.25208284 -1.2 1,523,789 6.182925 1982 32 2010 1.0044 4.04 0.755818481 61.48939847 11.54 5,413,870 6.733508 1982 32 2011 0.9175 -1.9 1.940460819 24.07037557 19.22 2,422,472 6.384259 1982 32 2012 0.8037 -2.52 1.917203914 25.9709816 26.31 2,929,752 6.466831 1982 32
32 MAMI
2009 1.4676 0.06 0.092290092 3.619269502 0.49 617,997 5.790986 1970 44 2010 1.0277 0.12 0.090220958 3.513716753 0.17 653,019 5.814926 1970 44 2011 1.0373 0.14 0.108481958 3.644720636 0.23 669,079 5.825477 1970 44 2012 1.0119 0.2 0.104944608 3.147428146 0.33 705,334 5.848395 1970 44
33 MICE
2011 1.484 0.76 0.721833985 38.20395529 0.67 14,314,707 7.155782 1975 39 2012 1.4901 1 0.897402454 44.90687134 1.18 14,088,183 7.148855 1975 39
35 MYRX
2009 0.004 -1.01 0 0 1,547.77 901 2.954725 1971 43 2010 0.3167 -2.18 0.818565337 1.42273101 25.28 133,216 5.124556 1971 43 2011 0.2224 -27.05 0.21284028 2.13322549 11.82 861,975 5.935495 1971 43 2012 0.4549 3.41 0.105638364 0.588058405 2.52 1,116,299 6.047781 1971 43
36 OKAS
2009 1.797 4.25 1.318556709 3.689645965 6.96 1,005,868 6.002541 2003 11 2010 1.4103 5.28 1.086306772 3.675740694 4.62 1,287,118 6.109618 2003 11 2011 0.9155 2.63 0.7698051 3.855837847 -0.84 1,552,441 6.191015 2003 11 2012 0.7097 3.73 0.817782464 2.484489105 -2.25 2,138,455 6.3301 2003 11
37 PDES
2009 2.2125 0.57 1.351725185 15.71823689 1.76 171,199 5.233501 1999 15 2010 1.4942 0.79 1.269091711 6.920823657 1.72 208,546 5.319202 1999 15 2011 1.2942 0.92 1.033595608 5.410817472 3.23 245,925 5.390803 1999 15 2012 1.29 0.67 1.220791661 5.270297872 3.98 229,669 5.361102 1999 15
38 PGLI
2009 0.6481 0.17 0.349527824 3.91744066 0.75 42,463 4.628011 1999 15 2010 0.6913 0.14 0.354657285 3.386654479 0.33 41,784 4.62101 1999 15 2011 2.002 0.18 0.349339873 1.262504372 0.78 43,628 4.639765 1999 15 2012 2.3301 0.22 0.346563066 1.098471034 0.56 45,302 4.656117 1999 15
39 PLAS
2009 2.8686 0.3 0.123340323 0 3.74 225,571 5.353283 1992 22 2010 1.8391 0.66 0.41299947 1.157501893 9.85 335,906 5.526218 1992 22 2011 2.4419 0.36 0.25686792 1.203756824 1.13 292,119 5.46556 1992 22 2012 2.5996 0.44 0.150025863 0.209856948 2.74 320,918 5.506394 1992 22
40 PNSE
2009 1.4955 1.28 0.649338801 2.850071895 14.86 290,457 5.463082 1970 44 2010 1.6754 1.11 0.633100443 2.785142025 12.58 321,325 5.506945 1970 44 2011 1.9012 0.69 0.688353115 3.878081173 12.75 347,037 5.540376 1970 44 2012 1.9808 0.55 0.70771763 3.691501856 11.7 353,593 5.548504 1970 44
41 POOL
2012 4.933 0.18 0.095591832 1.812792512 8.93 143,098 5.155634 1958 56
42 PTSP
2009 1.1689 4.07 2.501351098 36.96483318 13.04 90,667 4.957449 1983 31 2010 1.2437 1.86 2.270482254 31.09240321 15.26 109,009 5.037462 1983 31 2011 1.4199 0.9 2.19194652 44.4215904 20.32 133,433 5.125263 1983 31 2012 1.4736 0.72 1.735261947 36.68665437 17.55 203,877 5.309368 1983 31
43 RIMO
2009 0.1659 -2.25 4.227795757 514.8522727 -172.83 16,686 4.222352 1987 27 2010 0.1349 -1.72 0.780302176 96.81318681 -63.07 17,738 4.248905 1987 27 2011 0.0736 -1.28 0.634360393 40.21186441 -121.68 10,483 4.020486 1987 27 2012 0.0218 -1.14 0.81428781 69.86486486 -172.9 6,817 3.833593 1987 27
44 SDPC
2009 1.4862 2 3.771958823 7.310510951 3.55 268,013 5.428156 1952 62 2010 1.4202 2.05 3.026819425 5.947124793 0.55 276,516 5.44172 1952 62 2011 1.3738 2.41 3.008668528 6.001957769 1.24 323,469 5.509833 1952 62 2012 1.3677 2.69 3.041868727 5.997535909 2.55 385,610 5.586148 1952 62
45 SHID
2009 0.1044 1.42 0.140766257 2.272860114 1.29 711,250 5.852022 1969 45 2010 0.9931 0.99 0.200271698 2.843786473 2.89 619,069 5.791739 1969 45 2011 1.0902 0.36 0.132244691 1.724262229 0.81 1,236,647 6.092246 1969 45 2012 1.6288 0.41 0.137834013 1.079642724 0.97 1,304,366 6.115399 1969 45
46 SONA
2009 0.731 1.69 1.040869658 41.70814772 5.3 503,968 5.702403 1978 36 2010 1.0096 1.47 0.925962496 3.67333017 10.36 623,873 5.795096 1978 36 2011 2.4998 0.56 1.143021179 23.11062358 10.72 677,550 5.830941 1978 36 2012 3.3193 0.76 0.922102607 42.68765303 9.79 929,094 5.96806 1978 36
47 SUGI
2009 69.43 0.01 0.48918196 11.44013158 -6.15 37,761 4.577043 1990 24 2010 90.08 0.03 0.01175923 0 5.55 40,819 4.610862 1990 24 2011 90.08 0.03 0.01175923 0 5.47 40,819 4.610862 1990 24 2012 1.442 0.41 0.019967979 0.088950893 0.76 3,659,459 6.563417 1990 24
48 TGKA
49 TIRA
2009 1.2494 1.51 1.179890876 2.815945559 1.43 201,789 5.304897 1974 40 2010 1.4367 1.35 1.23476728 3.329204756 2.33 217,837 5.338132 1974 40 2011 1.4627 1.18 1.326313015 3.704960438 3.33 223,874 5.350004 1974 40 2012 1.3776 1.23 1.159014497 3.010639706 2.97 240,324 5.380797 1974 40
50 TKGA
2009 0.9701 23.64 13.6544075 1318.608696 0.21 101,747 5.007522 1905 109 2010 0.7327 -40.16 15.10276899 1640.800218 -6.54 104,623 5.019627 1905 109 2011 0.7619 -14.2 16.33949527 1193.087491 -5.18 112,140 5.049761 1905 109 2012 0.9747 -7.92 0 0 0 103,096 5.013242 1905 109
51 TMPO
2009 1.6401 0.93 1.314286751 2.310167863 1.05 137,750 5.139092 1996 18 2010 1.7243 1.01 1.183811632 2.255180191 3.46 154,506 5.188945 1996 18 2011 2.0114 1.02 1.353978587 2.364885606 5.89 176,344 5.246361 1996 18 2012 2.6512 0.82 1.240583489 1.951848764 13.95 212,446 5.327249 1996 18
52 TRIL
2009 10.20 0.12 0.530750951 1.643898098 0.58 270,577 5.432291 1992 22 2010 3.4377 0.35 0.444637803 1.076738382 0.53 324,671 5.511443 1992 22 2011 48.05 0.06 0.415373077 1.946467662 -3 246,665 5.392108 1992 22 2012 68.11 0.05 0.142352426 1.067691591 -9.19 223,888 5.350031 1992 22
53 WAPO
2009 1.4096 1.52 0.573216997 1.807254672 0.05 207,445 5.316903 1993 21 2010 1.2435 2.01 0.200393522 0.604364588 -6.93 204,817 5.311366 1993 21 2011 0.4892 -51.33 0.259154155 10.87523719 -86.92 79,991 4.903041 1993 21 2012 1.0688 39.79 1.282461071 9.339189083 4.08 97,486 4.988942 1993 21
54 WICO