α
α
α
α
!
! "#
$
%
&
'
( ) * + ) , ) ) -. * . )
, / ) 01 2
Jurusan Kimia FMIPA, Universitas Lampung
Jl. Soemantri Brojonegoro No 1, Bandar Lampung 35145
! 2
Amylases are one of the main enzymes used in industry. Such enzymes hydrolyze the starch molecule into polymers composed of glucose units. Amylases have potential application in a wide number of industrial processes such as food, fermentation, and pharmaceutical industries. The aims of this research are to isolate and purify α,amylase from a local bacteria
ITBCCB148. The purification of enzyme was conducted by few steps such as fractionation with ammonium sulphate, dialysis and carboxymethyl cellulose (CMC) cation exchange column chromatography. α,amylase crude extract was produced by
ITBCCB148 at the fermentation temperature 32oC, the fermentation media at pH 6.0 and the duration time of fermentation was 72 hours with specific activity of 925.75 U/mg. The specific activity of purified enzyme by fractionation with ammonium sulphate was 4315.31 U/mg, increasing 4.67 times than the crude enzyme extract. The specific activity of purified enzyme by dialysis was 5586.77 U/mg, increasing 6.04 times than the crude enzyme extract. The specific activity of purified enzyme cation exchange column chromatography using carboxymethyl cellulose (CMC) was 10387.11 U/mg, increasing 11.22 times than the crude enzyme extract. The optimum pH of purified enzyme was 6.0 and the optimum temperature was 60oC, while the Km
and Vmax value approximately were 6.18 mg mL,1 substrate and 909.09 mol mL,1 min,1.
+
The hydrolysis of starch with low molecular weight, catalyzed by an α,amylase which is one of
the most important commercial enzyme processes. The hydrolyzed products are widely applied
in food, paper and textile industries. α,Amylases are endoamylases catalyzing the hydrolysis of
internal α,1,4,glycosidic linkages in starch in random manner. The microbial α,amylases for industrial purposes are derived mainly from ,
and . Interest in starch,degrading amylases has increased in recent years and a number of papers have appeared on the formation of amylases by microorganisms and the purification to homogeneity of the produced enzymes [1].
Ion,exchange chromatography separates biomolecules on the basis of charge characteristics.
Charged groups on the surface of a protein interact with oppositely charged group immobilized on the ion,exchange medium. As illustrated in figure 1, the charge of a protein depends on the pH of its environment (the operating pH). The pH at which the net charge of a protein is zero (i.e., where the number of positive charge equals the number of negative charges) is known as the isoelectric point (pI). When the operating pH is greater than the pI, the protein will have a net negative charge, and should bind to anion,exchange media, which are positively charged. When the operating pH is less than the pI, the protein will have a net positive charge, and should bind to cation,exchange media, which is negatively charged [2].
It is necessary to begin by selecting either anion or cation exchange. This requires knowledge of the pI and pH stability of the target protein. If the pI of the target protein is known, an anion, exchange medium with an operating pH above the pI of the target protein or cation,exchange medium with an operating pH below the pH of the target protein should be selected. If the pH of the target protein is unknown, it is desirable to determining it before beginning. The optimal operating pH can be determinated empirically [3].
Ion,exchange matrices are divided into two major types according to the charge on the ion, exchange ligands. Cation,exchange resins have negatively charged groups on the surface. These are used to bind protein that have an overall positive charge. These are divided into two groups, strong exchanger such as SP (sulfopropyl), S (Methyl sulfonate) and weak exchanger such as CM (carboxymethyl). Anion,exchange resins have positively charged groups on the surface. These are used to bind protein that have an overall negative charge. These are divided into two groups, strong exchanger such as Q (quaternary ammonium), QAE (quaternary aminoethyl) and
weak exchanger such as DEAE (diethylaminoethyl) [4].
Cellulose offered particular promise as a support for ionizing groups intended to bind protein
because of its hydrophilic nature and enormous surface. It was readily available at low cost, and simple modification of a reaction extensively used in the industrial manufacture of cellulose derivatives provided the means of attaching a variety of ionizable groups [5].
Based on these fact, in this research, the purification using carboxymethyl cellulose (CMC) cation exchange column chromatography was chosen in attempt to increase the purification of of
α,amylase which was produced, isolated, and purified from local bacteria isolate ITBCCB148.
!+
+ +
All chemicals used were of high grade (pro analysis) materials. Local bacteria isolate
ITBCCB148 was obtained from the Microbiology and Fermentation Technology
Laboratory, Chemical Engineering Department, Bandung Institute of Technology, Bandung,
+ + α
The strain was maintained on agar slopes at 4 oC. A standard inoculum medium containing (g/l): glucose 10, peptone 5.0, Yeast extract 2.0, NaCl 1.5, KH2PO4 0.5, MgSO4 0.5, CaCl 0.1 and 15% glycerol (v/v) was inoculated into 250 ml Erlenmeyer flask kept at 37 oC and 150 rpm for 18 h. The initial pH of the medium was adjusted to 7.0. Inoculum (1% (v/v)) was transferred into 250 ml Erlenmeyer flasks containing 50 ml production medium. The production medium was the same as inoculum medium with the exception of starch which was used as carbon source instead of glucose. The flasks were then placed in an orbital shaker at 37 oC and 150 rpm for 72 h [6]
+4+ 0% α
The fermented broth was taken after 72 h and centrifuged 7000 rpm for 15 min, and then substrate free supernatant was used for estimation of enzyme activity [6]
+"+ α
Purification of the enzyme is done gradually by enzyme crude extract fractionation with varying levels of ammonium sulfate, dialysis and ion,exchange chromatography column, to obtain purified enzyme [7]
+ 5 .
Crude extract enzyme then saturated from the solution using varying level of ammonium
sulfate (NH4)2SO4 : (0,20)%; (20,40)%; (40,60)%; (60,80)%; and (80,100)%. The protein
precipitate got from the level of ammonium sulfate then separated from the solution using centrifugation 5000 rpm for 20 min. After that, the protein precipitate dissolve into phosphate buffer 0.1 M pH 6.5 and enzyme activity analyzed using Fuwa method and Lowry method for protein content.
+
-The highest fractionation enzyme was then purified by dialysis on a semipermeable
membrane (cellophane bag). The precipitate was introduced into a cellophane bag and
dialysis, every 4,hours buffer is replaced for reduced the ion concentration in the dialysis
bag. Furthermore, the enzyme activity is analyzed using Fuwa method and measured protein
content with Lowry method.
+ % $ $
• Development and washing of CMC
CMC is immersed in aquades and allowed to expand at room temperature. The fine particles are separated by decantation. Thereafter, 0.5 M of NaOH solution was added twice the volume of the CMC slurry while occasionally stirring slowly, then precipitated for 30 minutes. The CMC slurry was further decanted and washed with distilled water until the washing water showed pH 8. Then, added HCl 0.5 M solution twice the volume of CMC slurry while occasionally stirring slowly, then precipitated for 30 minutes. The CMC slurry is subsequently decanted and washed with aquades until the wash water shows a neutral pH.
• Determination of pH buffer binding and release of enzyme,matrix
As much as 4 mL of expanding CMC slurry, put into a centrifuge tube in a less viscous state. The CMC slurry is separated from the solution by centrifugation for 10 minutes. Thereafter, CMC slurry was stabilized using a 0.05 M phosphate buffer with a pH variation of 5.0; 5.5; 6.0; 6.5; 7.0. Then, into the matrix was added 1 mL of dialysis enzyme and 1 mL of 0.05 M phosphate buffer according to variation of pH respectively. The mixture is stirred and allowed until CMC precipitates. The supernatant was separated by centrifugation 10 minutes ago and determined its activity by the Fuwa method.
• Preparation of gel columns
Column measuring 1.5 x 50 cm laced with cotton on the lower end. The column was installed perpendicularly. The expanding gel slurry was then inserted into the column.
• Gel stabilization
The gel in the column is stabilized by passing the pH,binding enzyme phosphate buffer until the pH binding conditions are reached. The regulator opens up to a speed of droplets of 1,2 mL / min.
• Placement of enzyme snippets into columns
The dialysis enzyme was inserted into the chromatographic column that already contains a stabilized CMC. The enzyme is bonded with an initial buffer and the eluate was collected as much as 20 mL each for a 1,25 fraction. Next, eluted by elution buffer. Eluat was collected as much as 20 mL each for fraction 26,50. The first fraction begins when the enzyme was inserted. All fractions determined the protein pattern at λ 280 nm and then tested its enzyme activity using Fuwa method and determined its protein level by Lowry method.
+6 αααα
+ 5 .
0.25 mL of enzyme was added by 0.25 mL of a 0.1 % starch solution, then incubated at 60 ° C for 10 min. For control, starch is added after the enzyme is inactivated with 1N HCl. After incubation, the enzyme reaction and starch substrate were discontinued by the addition of 0.25 mL of HCl 1 N, then 0.25 mL of the iodine reagent and 4 mL of distilled water were added. Then, the mixture was stirred evenly and measured uptake using a UV, Vis spectrophotometer at λ 600 nm [8]
+
that, the uptake was measured using a UV,Vis spectrophotometer at λ 510 nm. Glucose levels formed are determined by using a standard glucose curve [9].
+7 - 8 9
0.1 mL of the enzyme was dissolved in 0.9 mL of distilled water, then reacted with 5 mL reagent C. The mixture was stirred evenly, then left for 10 min at room temperature. Thereafter, it is added rapidly 0.5 mL of reagent D, then completely stirred. The solution is allowed to stand for 30 minutes at room temperature. For control, 0.1 mL of the enzyme was replaced by 0.1 mL of distilled water, then treated the same as the sample. Then the absorbance was measured using a UV,Vis spectrophotometer at λ 750 nm . The protein content was determined by the standard curve of the BSA solution measured at λ750 nm based on the linear regression equation [10].
+ - 0 1
+ - ,
To determinate the optimum pH of purified enzyme was done by varying incubation pH such as 5.5; 6.0; 6.5; 7.0; 7.5; 8.0; and 8.5 for 30 minutes. Furthermore, it was tested using the Mandels method.
+
-To determinate the optimum temperature of purified enzyme was done by varying incubation temperature such as 55; 60; 65; 70; 75; 80; and 85oC for 30 minutes. Furthermore, it was tested using the Mandels method.
+ - 3 :
The Michaelis,Menten Constanta (Km) and the maximum reaction rate (Vmax) of purified enzyme was determined by varying the substrate concentration of 0.1; 0.2; 0.4; 0.6; 0.8; and 1% at 60 ° C for 30 minutes. Next, measured residual activity (%) of the enzyme by the Mandels method. The data of the relationship between the rate of enzyme reaction to the substrate concentration is plotted into the Lineweaver,Burk curve.
-4+ + α
α,amylase crude extract was pro temperature 32oC, the fermentatio 72 hours with specific activity of 9
4+ + 5
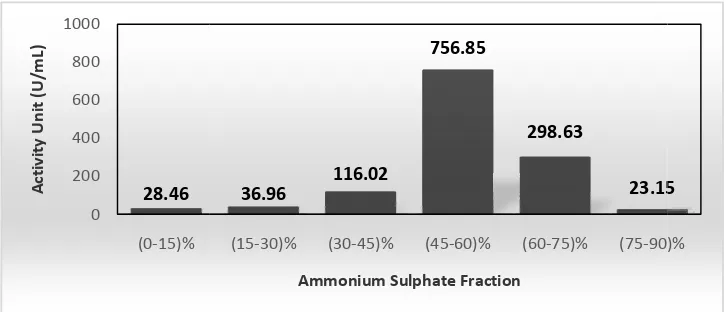
Fractionation of α,amylase enzym saturation levels, such as (0,15)%, 100 mL of crude extract of the en Then the enzyme sediment was d relationship between saturation of amylase enzyme from
Figure 2. The relationship between of the α,amylase enzyme
According to figure 2, the highest (45,60)% that is 1468,97 U. How
ntation media at pH 6.0 and the duration time of fer ty of 925.75 U/mg.
enzyme was done by adding ammonium sulfate salt 15)%, (15,30)%, (30,45)%, (45,60)%, (60,75)% and the enzyme for the determination of the first fractio was dissolved with 5 mL of 0.1 M phosphate buffe tion of ammonium sulfate (0,100) % and the activity
ITBCCB148 can be seen in Figure 2.
tween saturation of ammonium sulphate with the the zyme from B. subtilis ITBCCB148
Figure 3. The relationship between enzyme solution was introduced 0.01 M phosphate buffer pH 6.5. the buffer every 4 hours so that the
0
tween saturation of ammonium sulphate with the the zyme from B. subtilis ITBCCB148
,30)% has very low specific activity compared t ,40)% is not used in the subsequent purification p lase enzyme precipitate is produced very little so is used at the subsequent purification step. The activ
amylase at fraction (30,90)% are 753.10 U/mL and ctivity shows that the fractionated enzyme has a high e crude extract of the enzyme.
e fraction (30,90)% is further purified by 24 hour d to half volume of the cellophane pouch, then 6.5. This dialysis process aims to separate the enz s which can disrupt the stability of enzymes to obtain ialysis is based on the diffusion of particles inside a cellophane pouch) by the presence of osmotic pressu
larger membrane causes the release of small molecu salt ions. The exit of the molecule causes the distr anced membrane. To minimize this effect, low,concen
ane pouch. During the process of dialysis, it is neces hat the concentration of ions in the dialysis pouch can
that the osmotic equilibrium is reached [7]. The buffer is shaken using a magnetic stirrer to accelerate the osmotic equilibrium. Dialysis is carried out at cold temperatures to prevent enzyme denaturation. The specific activity of purified enzyme by dialysis was 5586.77 U/mg, increasing 6.04 times than the crude enzyme extract.
4+"+ % $ $
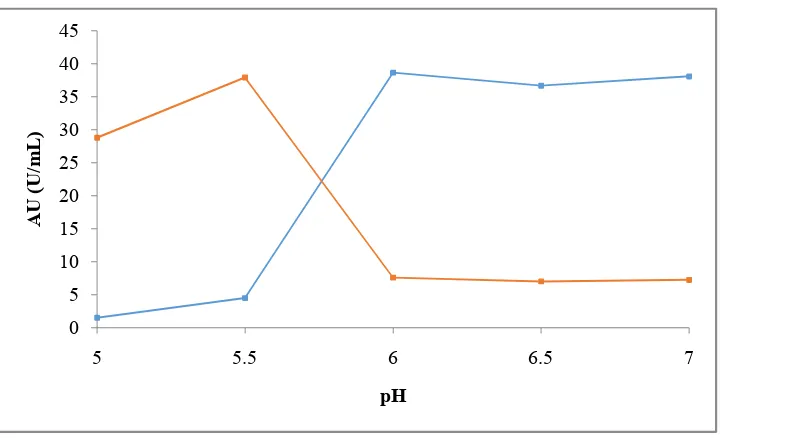
This stage is the final step of purifying α,amylase enzyme. Purification by cation exchange column chromatography using CMC (carboxyl methyl cellulose) begins with the initial pH buffer,elution determination of pH buffers suitable for binding and releasing enzymes with CMC matrix in the cation exchange column. The activity of the α,amylase enzyme unit on various pH binding in the CMC matrix can be seen in Figure 4.
Figure 4. Activity of the α,amylase enzyme unit at various pH binding with CMC matrix.
According to Fig. 4, enzymes can exchange ion counters and bind to CMC matrices well at pH 5.5. Therefore, a 0.05 M phosphate buffer was used at pH 5.5 as the initial buffer. As for the elution buffer, a mixture of 0.05 M phosphate buffer pH 7 and NaCl 1 M (1: 1) was used. The
protein pattern (A280nm) and unit activity (U / mL) of α,amylase enzyme from chromatography column of cation exchanger using CMC can be seen in Figure 5.
0 5 10 15 20 25 30 35 40 45
5 5.5 6 6.5 7
;
&;
<
8
'
,
pH
Figure 5. The α,amylase enzyme c column.
Figure 5 shows the presence of 3
amylase enzyme. This suggests se proteins (enzymes) are still strong enzyme lies in fraction number 3 number 36 at the peak of protein n 36 was 10387.11 U / mg. The puri extract of the enzyme.
+# - 0
+
-The optimum pH was determined various incubation pH of 5.5; 6.0; can be seen in Figure 6, that show stable between pH 5.5 and pH 8.0.
Fraction number
yme chromatogram of B. subtilis ITBCCB148 in the C
of 3 peak. Peak protein number 1 and 2 there is no
ests separate proteins other than the α,amylase enzy strongly bound to the CMC matrix. The activity of
ber 34 to fraction number 38 with the highest activ tein number 3. The specific activity of α,amylase in f
urity of the enzyme increased 11.22 times compar
0 1
,
mined based on the highest activity of purified enzym .0; 6.5; 7.0; 7.5; and 8.0. The optimum pH of pu t shows the purified enzyme having an optimum pH H 8.0.
in the CMC
e is no activity of α,
e enzyme, where the ity of the α,amylase st activity in fraction se in fraction number ompared to the crude
Figure 6. Optimum pH of purified enzyme
+
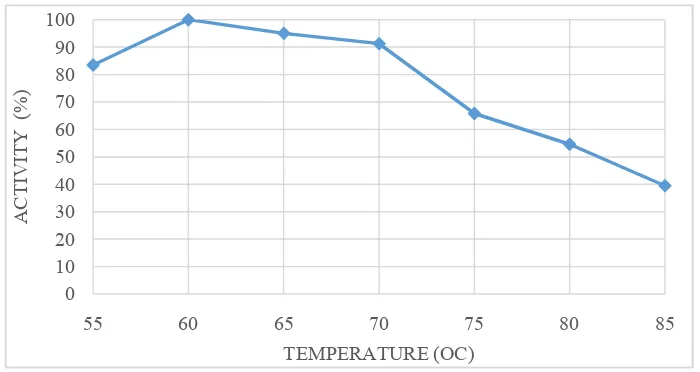
-The optimum temperature was determined based on the highest activity of pure enzymes and immobilized enzymes measured at various incubation temperatures of 55, 60, 65, 70, 75, 80, and 85oC. The optimum temperature of α,amylase enzymes purified and the result of immobilization can be seen in Figure 7, that shows the purified enzyme having an optimum temperature at 60 ° C and stable at 65 to 75 ° C
Figure 7. Optimum temperature of purified enzyme
+ - 3 :
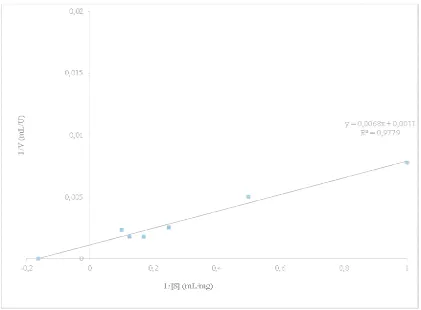
complex so the reaction rate is max substrate concentration to produce values was based on enzyme activ various substrate concentrations on 0.8; And 1%. The value of KM and and 909.09 mol mL,1 min,1 and th
Figure 8. Lin
-+
Based on the results obtained enhancement specific activity pH of purified enzyme was 6.
value approximately were 6.18
is maximum. Determination of KM and Vmax aims to roduce maximum reaction rate. The determination o
activity measured using the Mandels method at 60° C ions on the enzyme. Substrate concentration used is 0,
and Vmax purified α,amylase enzyme were 6.18 mg and the Lineweaver,Burk Curve can be seen in Figure
Lineweaver,Burk Curve of Purified Enzyme
tained and the discussion above, it can be concluded ctivity of purified enzymethan crude extract enzyme was 6.0, the optimum temperature was 60oC, while th
re 6.18 mg mL,1 substrate and 909.09 mol mL,1 min
ms to determinate the tion of KM and Vmax
° C for 30 min in d is 0,1; 0.2; 0.4; 0.6; 18 mg mL,1 substrate
Figure 8.
cluded that there are nzyme. The optimum hile the Km and Vmax
0+
.
$
The authors would like to thank to Rector of Lampung University, that provided funds for this project to be undertaken through the University of Lampung Professor's Research with contract number 806/UN26.21/PP/2017.
5+ 2
[1] Konsula Z, Liakopoulou,Kyriakides M. Hydrolysis of starches by the action of an α,amylase from . Process Biochemistry 2004; 39: 1745,1749
[2] Jungbauer A. and R. Hahn. Ion,Exchange Chromatography. Methods in Enzymology. Elseveir Inc. 2009, 463 : 349 , 370
[3] Williams A and V. Frasca. Ion,Exchange Chromatography. Current Protocols on Protein Science. John Wiley & Sons, Inc. 1999: 8.2.1 – 8.2.30.
[4] Selkirk C. Ion,Exchange Chromatography. Methods in Molecular Biology, vol 244 : Protein Purification Protocol : Second ed. Humana Press Inc, Totowa, NJ : 125 – 131.
[5] Peterson E.A and H.A. Sober. Chromatography of Proteins. I. Cellulose Ion,Exchange Adsorbents. Contribution from The Laboratory of Biochemistry, National Cancer Institute, National Institutes of Health. 1955; 78 : 751 – 755
[6] Tanyildizi MS, Ozer D, Elibol M. Optimization of of α,amylase production by sp. using response surface methodology. Process Biochemistry 2005; 40: 2291,2296.
[7] Feraliana. Amobilisasi Enzim α,amylase dari ITBCCB148 dengan menggunakan Karboksi Metil Sephadex C,50 (CM,Sephadex C,50). . Jurusan Kimia Fakultas MIPA Universitas Lampung. 2011. Bandar Lampung.
[8] Fuwa H. A New Method for Microdetermination of Amylase Activity By The Use Amylose As The Substrate. The Journal of Biochemistry. 1954; 42 : 5 : 583 – 602
[9] Mandels M., R. Andreotti, C. Roche. Measurement of saccharifying cellulose. Biotechnology Bioenginering Symposium. 1976; 6: 21 , 33
![Figure 1. Net charge of protein as a function of pH [3].](https://thumb-ap.123doks.com/thumbv2/123dok/3992222.1935642/3.612.144.470.474.676/figure-net-charge-protein-function-ph.webp)


