Copyright 2018 GMP Press and Printing (http://buscompress.com/journal-home.html) ISSN: 2304-1013 (Online); 2304-1269 (CDROM); 2414-6722 (Print)
Carbon Emission Issues in Indonesia
Nurdiawansyah*
Departement of Accounting, University of Bandar Lampung, Bandar Lampung, Indonesia
Lindrianasari
Department of Accounting, University of Lampung, Bandar Lampung, Indonesia
Agrianti Komalasari
Department of Accounting, University of Lampung, Bandar Lampung, Indonesia
ABSTRACT
This study aims to obtain evidence empirically about the effect of company size, profitability, leverage, and media exposure to disclosure of carbon emissions in companies in Indonesia. Measurement of the area of carbon emissions disclosure is to use a checklist developed on the basis of an information request sheet provided by the CDP (Carbon Disclosure Project). The sample in this study is a manufacturing company listed on the Indonesia Stock Exchange 2013-2015. Sample chosen by using purposive sampling to obtain the number of samples as many as 184 manufacturing companies that meet the criteria of research samples that have been determined. Company size measured by total assets, profitability as measured by Return on Assets (ROA), leverage is measured using Debt Equity Ratio (DER), and media exposure is measured using dummy variables. The type of data used is panel data, and use Ordinary Least Square (OLS) method. The results showed that firm size, profitability and media exposure have positive and significant influence to carbon emission disclosure at manufacturing company in Indonesia while leverage variable has no significant effect to carbon emission disclosure at manufacturing company in Indonesia.
Keywords: Company size, profitability, leverage, media exposure, carbon emissions disclosure.
1. INTRODUCTION
Global warming is a problem that arises mainly due to too much greenhouse gases in the atmosphere, so this gas envelopes the earth and reflects heat radiation back to the surface of the earth. The presence of greenhouse gases in the atmosphere becomes too excessive because of the burning of fossil fuels such as coal, gas and petroleum or land clearing and forest burning. There are plenty of other greenhouse gases such as methane (CH4), nitrous oxide (N2O), perfluorocarbons (PFCs) and hydrofluorocarbons (HFCs), but carbon dioxide (CO2) has the greatest risk in climate change because this gas continues Accumulate in the atmosphere in large numbers.
Copyright 2018 GMP Press and Printing (http://buscompress.com/journal-home.html) ISSN: 2304-1013 (Online); 2304-1269 (CDROM); 2414-6722 (Print)
Indonesia's total carbon emissions. Such as the recent case in Indonesiais the smoke haze that occurred in Riau in September 2015 which is reach Singapore caused by forest fires in Riau. Air pollution index (ISPU) in the capital of Riau, Pekanbaru, reach the number of 984. That number is even above the highest level of ISPU, which is dangerous, which is in the range of 300-500 (www.bbc.com/indonesia).
Due to the smoke haze caused by forest and land fires in hundreds of areas, Indonesia emits more carbon emissions than the United States. In fact, the US has been regarded as the second largest source of greenhouse gases in the world after China. In an environmental organizations study report, World Resources Institute, carbon emissions from land and forest fires in Indonesia have exceeded the average carbon emissions of the US daily for 26 days from 44 days since the beginning of September 2015. The record is practically demonstrated a significant spike. The reason is, so far the US is the second source of greenhouse gases after China. Indonesia is usually categorized by WRI in five ratings(www.nationalgeografic.co.id).
The very high increase of carbon dioxide emissions over the last few years adds to the worries for the world's climate. In some places like Los Angeles suffered prolonged drought due to increasingly severe global warming. The temperature of the earth is getting hotter, the sea water is increasing, and the prolonged drought is increasingly happening. But the need for energy from fossil fuels also continues to grow as the human population and technology grow. The amount of carbon dioxide in the atmosphere is too much, it is estimated that about 1035 Giga tons of carbon dioxide is released into the atmosphere from 1850 to 2000 and it is constantly increasing. With the speed of current emissions, carbon dioxide released into the atmosphere is two times faster than the decomposition (html.tl.itb.ac.id, 2015).
Climate change is now gaining significant attention as a global environmental issue (Haque and Islam, 2012). According to the IPCC (Intergovernmental Panel on Climate Change, 2007), the average global surface temperature increased at a rate of 0.740C ± 0.180C resultingclimate change in various places, including in Indonesia. Impacts of climate change occurring in Indonesia include surface temperatures rise, changes in rainfall, temperatures and sea levels rise, increasing climatic events and extreme weather (RAN-API Bappenas, 2013).
According to data released by the World Resources Institute (WRI), based in Washington DC, the carbon dioxide emissions generated by the countries in the world is as much as 47.59 billion tons of carbon emissions (MtCO2e) per year.Of these, the largest contributing countries in generating carbon emissions in the world are China with 10.68 billion tons of carbon dioxide emissions per year. Followed by the United States, which is rank second as the largest emitter of carbon dioxide in the world of 5.82 billion tons of carbon dioxide emissions per year. The third sequence is occupied by 28 countries that join the EU with the amount of carbon dioxide emissions generated by 4.12 billion tons of carbon dioxide emissions per year. Indonesia is also on the list, which is ranked sixth with carbon dioxide emissions generated at 1.98 billion tons of carbon dioxide emissions per year.
Copyright 2018 GMP Press and Printing (http://buscompress.com/journal-home.html) ISSN: 2304-1013 (Online); 2304-1269 (CDROM); 2414-6722 (Print)
consequence of the ratification. Although on one side, the benefits of the ratification will be obtained in Indonesia, one of them is obtaining supports from developed countries in reducing carbon emissions (Lindrianasari et al, 2017). There are six GHGs targeted for its decline in Kyoto Protocol, namely carbon dioxide (CO2), methane (CH4), nitrous oxide (N2O), sulfurheksafluorida (SF6), perfluorocarbons (PFCs), and hydrofluorocarbons (HFCs). This study focuses on one GHG that is CO2 (carbon emissions) companies that are major contributors to global climate change.
The Kyoto Protocol regulates three flexible emission reduction mechanisms for industrialized countries. The three mechanisms are: Clean Development Mechanism (CDM), Joint Implementation (JI), and emission trading. On emission trading, the principle is carbon trading with the cap-and-trade system under the Kyoto Protocol (Kardono, 2010). Indonesia has committed to reducing carbon emissions that are part of GHG emissions by 26 percent by 2020, which is approximately 0.67 Gt.
Indonesia's commitment to reduce carbon emissions can also be seen from the Presidential Regulation no. 61 Year 2011 on the National Action Plan for Greenhouse Gas Emission Reduction and Presidential Regulation No. 71 Year 2011 on the implementation of national greenhouse gas inventories. In Article 4 of Presidential Regulation No.61 Year 2011, it is mentioned that business actors also contribute in efforts to reduce GHG emissions. The effort to reduce GHG emissions (including carbon emissions) by the company as business actor can be known from Carbon Emissions Disclosure.
Disclosure of carbon emissions in Indonesia is still a voluntary disclosure and the practice is still rarely carried out by business entities. Companies that perform disclosure of carbon emissions have a number of considerations such as to gain legitimacy from stakeholders, avoiding the threats, especially for companies that produce greenhouse gases such as increased operating costs, reduced demand, reputational risk, legal proceedings, as well as fines and penalties (Berthelot and Robert, 2011).
The purpose of this study is to determine the effect of firm size, profitability, leverage, and media exposure on the carbon emissions disclosure. By using 184 companies listed on the Indonesian Stock Exchange, we found that company size, profitability and media exposure have positive effect on carbon emissions disclosure while leverage have no significant effect on the carbon emissions disclosure. These results conclude that the larger the company, and the more effective the company is in gaining profit from its business operations, as well as the role of media can encourage companies to make efforts to reduce carbon emissions. Our research contributes to the theory development in Indonesia, particularly on the carbon emissions disclosure, and as a consideration in making investment decisions, given the information disclosure relating to carbon emissions is one of the things that are important to stakeholders as well as a consideration or government policies relating to the reduction of carbon emissions and greenhouse gases.
2. PREVIOUS STUDY AND HYPOTHESIS DEVELOPMENT
2.1. Theory of Legitimacy
Copyright 2018 GMP Press and Printing (http://buscompress.com/journal-home.html) ISSN: 2304-1013 (Online); 2304-1269 (CDROM); 2414-6722 (Print)
environment. Organization seeks to create harmony between social values inherent in its activities with norms of behavior in social system of society where the organization is part of the system. As long as the two value systems are aligned, we can see them as corporate legitimacy. When actual or potential dissonance occurs between the two systems, there will be a threat to the legitimacy of the firm (Dowling and Pfeffer, 1975).
The rationale behind this theory is that the organization or company will continue its existence if the public realizes that the organization operates for a value system commensurate with the value system of society itself. Legitimacy theory encourages companies to ensure that their activities and performance are acceptable to society. Companies use their annual reports to illustrate the impression of environmental responsibility, so they are accepted by the community (Lindrianasari, 2013). Under the theory of legitimacy, organizations will continuously try to ensure that they are perceived to operate within the boundaries and norms of society. They seek to ensure that stakeholders regard their activities as legitimating (Deegan and Unerman, 2011). Environmental disclosure is one way for organizations to gain this legitimacy (Berthelot and Robert, 2011).
2.2. Stakeholder Theory
Stakeholder theory says that the company is not an entity that only operating for its own sake but must give benefit for its stakeholders (shareholders, creditors, customers, suppliers, government, society, analysts and other parties). Therefore, a company existence is strongly influenced by support given by stakeholders to the company (Ghozali and Chariri, 2007). Gray and Lavers (1994) says that the company's sustainability depends on the support of stakeholders and the support should be sought so the company’s activity is to seek such support. More powerful stakeholders, the company's efforts to adapt will be greater. Social disclosure is regarded as part of a dialogue between the companies with its stakeholders.
Based on stakeholder theory, different stakeholder groups have different views on how an organization should perform its operations, various social contracts would be "negotiated" with different groups of stakeholders, and it is not a contract with society in general as stated theory of legitimacy (Deegan and Unerman, 2011).
2.3. Company Size
Research indicates that company size has a positive relationship with carbon emissions disclosure (Choi et al., 2013), the disclosure of GHG (Lorenzo et al., 2009; Ghomi and Leung, 2013). Based on stakeholder and legitimacy theory, large companies have a greater pressure from the environmental problems so they are tend to increase response to the environment. Large companies are more encouraged to provide qualified voluntary disclosure to gain legitimacy.
Copyright 2018 GMP Press and Printing (http://buscompress.com/journal-home.html) ISSN: 2304-1013 (Online); 2304-1269 (CDROM); 2414-6722 (Print)
H1: Company Size positively affects Carbon Emissions Disclosure
2.4. Profitability
Based on the theory of legitimacy, the public always put pressure on the company to care about environmental problems. Companies with good financial conditions will be easier to answer these pressures because companies have more resources that can be used to conduct environmental disclosure than companies with low profitability (Zhang et al, 2012). It makes companies with higher profitability have greater disclosure compared to companies with low profitability. Financial performance capabilities include a variety of corporate initiatives to contribute in emission reduction efforts or in this case carbon emissions such as the replacement of the machines that more environmentally friendly, or other environmental actions such as tree planting to increase the absorption of CO2.
According to Choi et al. (2013), companies with good financial conditions can afford additional human or financial resources required for better voluntary reporting and carbon emissions disclosure to withstand external pressures. Companies with poor financial performance, the disclosure of new environmental obligationsregulations in the future means additional costs, leading to concerns from creditors, suppliers and customers about the company's performance. Conversely, companies with high profitability disclose information get a signal that they can act well on environmental pressure effectively and are willing to solve the problems quickly.
Luo et al. (2013) stated that companies with good financial performance have financial capability in making environmental decisions. Conversely, companies with poor financial performance focus more on achieving financial goals and improving their performance thereby limiting their ability to prevent and report carbon emissions.
H2: Profitability positively affects Carbon Emissions Disclosure
2.5. Leverage
Stakeholder theory states one of the stakeholders (creditors) will likely force companies to prioritize the repayment of any form of debt rather than make voluntary disclosures such as carbon emissions disclosure because it will only add to the financial burden of companies (Luo et al, 2013). The level of leverage negatively affects disclosure because large liabilities and interest payment will limit the company's ability to undertake carbon reduction and disclosure strategies. Companies with high leverage will be more cautious in reducing and disclosure it particularly concerned about the expenses related to carbon preventive actions (Luo et al, 2013). Leverage can have implications on a company's finances. This is in line with research by Clarkson et
al. (2008) which is companies with high leverage may not be able to absorb the adverse
financial impactfrom carbon information disclosure. The description above is supported by the results of research by Choiriyah Suhardjanto (2010), Ghomi and Leung (2013), and Jannah and Muid (2014) which stated that the leverage affects carbon emissions disclosure.
H3: Leverage negatively affects Carbon Emissions Disclosure.
2.6. Media Exposure
Copyright 2018 GMP Press and Printing (http://buscompress.com/journal-home.html) ISSN: 2304-1013 (Online); 2304-1269 (CDROM); 2414-6722 (Print)
important role in the movement of social mobilization, for example groups interested in the environment (Nur and Priantinah, 2012). Media also plays an important role in communicating information to the public. Information on company's activity is also included in information that can be communicated to the public. Companies need to be wary of media overseeing their activities as they relate to the value and reputation of the company.
The company in this case has a moral obligation to disclose its activities not only limited to financial aspects but also social and environmental aspects. The more the media is actively watching the environment of a country; the company will be increasingly encouraged to reveal its activities (Nur and Priantinah, 2012). This is in line with research (Dawkins and Fraas, 2011) that media visibility is directly associated with voluntary levels of climate change disclosure.
H4: Media Exposure positively affects Carbon Emissions Disclosure.
2.7. Framework
In this study we used several variables consisting of company size, profitability, leverage, and media exposure. Figure 1 below shows the conceptual framework of this study.
Figure 1.Conceptual Framework
Figure 1 illustrates the conceptual framework in this study. The dependent variable in this research is carbon emissions disclosure. The independent variables are company size, profitability, leverage, and media exposure. Based on the conceptual framework, we compiled the econometric model for this study as follows.
ECD =α+𝜷𝜷𝟏𝟏𝑳𝑳𝑳𝑳𝑳𝑳𝑳𝑳𝑳𝑳𝑳𝑳+𝜷𝜷𝟐𝟐𝑹𝑹𝑹𝑹𝑹𝑹 -𝜷𝜷𝟑𝟑𝑫𝑫𝑫𝑫𝑹𝑹+𝜷𝜷𝟒𝟒𝑴𝑴𝑫𝑫+𝜺𝜺𝑳𝑳
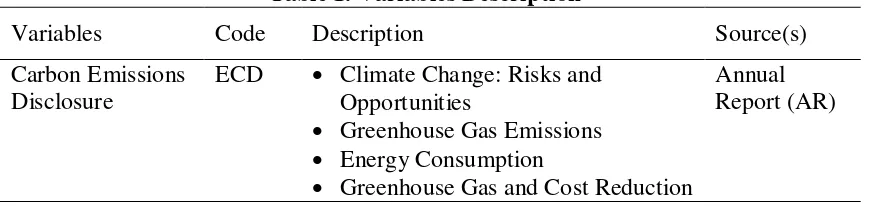
Table 1 below illustrates the operational variables in this study.
Table 1. Variables Description
Variables Code Description Source(s)
Carbon Emissions Disclosure
ECD • Climate Change: Risks and Opportunities
• Greenhouse Gas Emissions
• Energy Consumption
• Greenhouse Gas and Cost Reduction
Annual Report (AR) Company Size
Profitability
Leverage
Carbon Emissions Disclosure H1
H2
H3
(+)
(+)
(-)
Copyright 2018 GMP Press and Printing (http://buscompress.com/journal-home.html) ISSN: 2304-1013 (Online); 2304-1269 (CDROM); 2414-6722 (Print)
• Carbon Emissions Accountability
Company Size LNSize Natural Logarithm of Total Assets AR Profitability ROA Percentage of earnings before interest
and taxes divided by total assets
AR
Leverage LEV Ratio of total debt and total assets AR Media Exposure ME Dummy variables, the value of 1 for
companies that disclose information relating to carbon emissions, while a value of 0 otherwise.
Electronic media
3. RESEARCH METHOD
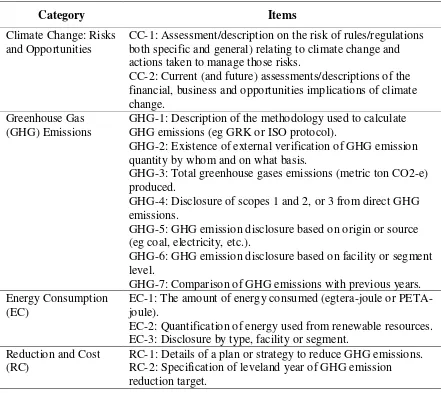
In this study, carbon emissions disclosure measured by using several items that were adopted from the research byChoi et al. (2013). To measure the extent of carbon disclosure, Choi et al. (2013) developed a checklist based on the information request form provided by the CDP (Carbon Disclosure Project). Choi et al. (2013) determine the five major categories relevant to climate change and carbon emissions. In the five categories, 18 items were identified. The following is carbon emissions disclosure checklist:
Table 2 Carbon Emissions Disclosure
Category Items
Climate Change: Risks and Opportunities
CC-1: Assessment/description on the risk of rules/regulations both specific and general) relating to climate change and actions taken to manage those risks.
CC-2: Current (and future) assessments/descriptions of the financial, business and opportunities implications of climate change.
Greenhouse Gas (GHG) Emissions
GHG-1: Description of the methodology used to calculate GHG emissions (eg GRK or ISO protocol).
GHG-2: Existence of external verification of GHG emission quantity by whom and on what basis.
GHG-3: Total greenhouse gases emissions (metric ton CO2-e) produced.
GHG-4: Disclosure of scopes 1 and 2, or 3 from direct GHG emissions.
GHG-5: GHG emission disclosure based on origin or source (eg coal, electricity, etc.).
GHG-6: GHG emission disclosure based on facility or segment level.
GHG-7: Comparison of GHG emissions with previous years. Energy Consumption
(EC)
EC-1: The amount of energy consumed (egtera-joule or PETA-joule).
EC-2: Quantification of energy used from renewable resources. EC-3: Disclosure by type, facility or segment.
Reduction and Cost (RC)
Copyright 2018 GMP Press and Printing (http://buscompress.com/journal-home.html) ISSN: 2304-1013 (Online); 2304-1269 (CDROM); 2414-6722 (Print)
RC-3: Reduction of emissions and costs or savings achieved today as a result of carbon emissions reduction plan.
RC-4: The costs of future emissions are taken into account in the capital expenditure planning.
Accountability of Emission Carbon (AEC)
AEC-1: An indication that the committee's board (or other executive council) has responsibility for actions related to climate change.
AEC-2: Description of the mechanism by which theboard (or other executive council) reviews the company's progress on climate change.
Source: Choi et al. (2013)
Calculation for carbon emission disclosure index is made with the following steps: giving a score on each item of disclosure with dichotomous scale. The maximum score is 18, while the minimum score is 0. Each item is worth 1 so if the company discloses all items on the information in its report then the company score is 18. Scores on each company then summed.
Company size is measured from the total assets of the company transformed into natural logarithms. Profitability is measured by using ROA (Return on Assets). Leverage is measured by the ratio of total debt divided by total equity. While the media exposure was measured by using dummy variable where a value of 1 for companies that disclose information relating to carbon emissions through the electronic media, while a value of 0 for companies that do not disclose information relating to carbon emissions.
The populations of this study are all manufacturing companies in Indonesia operating in the period 2013-2015. Sampling using purposive sampling method, that is a sampling techniques by specially selecting sample members based on specific criteria for research purposes. Based on this method, there are 184 companies included in the sample criteria. The next step is to analyze all data using data panel and Eviews 9.0 software. The table below is the sample obtained.
Table 3 Research Sample
Description 2013 2014 2015
Manufacturing companies listed on the Indonesia Stock Exchange
138 138 143
A manufacturing company that provides an annual report orsustainability report
131 131 131
Manufacturing companies that explicitly disclose carbon emissions (including at least one policy related to
carbon/greenhouse gas emissions or disclose at least one item of carbon emissions disclosure).
52 66 66
Number of observations 184
Source: Secondary Data processed, (2017)
4. ANALYSIS AND DISCUSSION
Copyright 2018 GMP Press and Printing (http://buscompress.com/journal-home.html) ISSN: 2304-1013 (Online); 2304-1269 (CDROM); 2414-6722 (Print)
Using data panel for observation years 2013, 2014, and 2015, we analyzed 184 manufacturing companies listed on the Indonesia Stock Exchange. We used Eviews version 9.0 to calculate multivariate regression using data panel method. First, we tested Chow, Hausman and Lagrange Multiplier tests to select the model to be used for analysis. We found the Chow test, Hausman, and Lagrange Multiplier indicates that our model advocate random effect model of the three models (random effect, fixed effect, and common effect) (Gujarati & Porter, 2015). The next table shows Chow test result, Hausman test result and Lagrange Multiplier test result.
Tabel 3 Output of Chow and Hausman tests Panel A
Redundant Fixed Effects Tests Equation: FIXED
Test cross-section fixed effects
Effects Test Statistic d.f. Prob.
Cross-section F 13.063174 (68,111) 0.0000
Cross-section Chi-square 404.343808 68 0.0000
Panel B
Correlated Random Effects - Hausman Test Equation: RANDOM
Test cross-section random effects
Test Summary Chi-Sq. Statistic Chi-Sq. d.f. Prob.
Cross-section random 1.388315 4 0.8462
Panel C
Lagrange Multiplier Test for Random Effects
Null hypotheses: No effects Alternative hypotheses: two-sides (breush-pagan) and one-sided (all others) alternatives
Cross-section
Test Hypothesis
time Both
Breush-Pagan 118,,0426 1,388220 119,4308
(0,0000) (0,2387) (0,0000)
Source: Statistical Analysis Results using Eviews version 9.0.
Copyright 2018 GMP Press and Printing (http://buscompress.com/journal-home.html) ISSN: 2304-1013 (Online); 2304-1269 (CDROM); 2414-6722 (Print)
model) also rejected (Gujarati and Porter, 2015). It's advised us to choose a random effect model. Since both Panel B and Panel C accept random effect model, thus the model used is the random effect model.
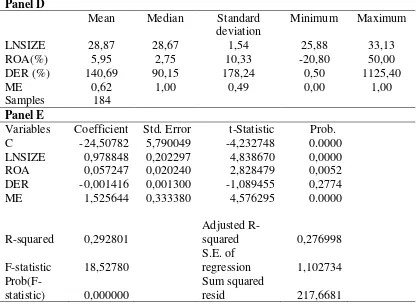
Table 4 Descriptive Statistics and Multivariate Regression using OLS Panel D
Mean Median Standard
deviation
Minimum Maximum
LNSIZE 28,87 28,67 1,54 25,88 33,13
ROA(%) 5,95 2,75 10,33 -20,80 50,00
DER (%) 140,69 90,15 178,24 0,50 1125,40
ME 0,62 1,00 0,49 0,00 1,00
Samples 184
Panel E
Variables Coefficient Std. Error t-Statistic Prob.
C -24,50782 5,790049 -4,232748 0.0000
LNSIZE 0,978848 0,202297 4,838670 0,0000
ROA 0,057247 0,020240 2,828479 0,0052
DER -0,001416 0,001300 -1,089455 0,2774
ME 1,525644 0,333380 4,576295 0.0000
R-squared 0,292801
Adjusted
R-squared 0,276998
F-statistic 18,52780
S.E. of
regression 1,102734
Prob(F-statistic) 0,000000
Sum squared
resid 217,6681
Source: The result of statistical analysis using Eviews version 9.0.
Table 4 shows descriptive statistics and multivariate regression using data panel methods. Panel D is a descriptive statistic. Based on the results of descriptive statistics can be seen that the company size variable has a minimum value of 25.88 namely PT. Beton Jaya Manunggal, Tbk in 2014 or if presented the initial data is Rp 174.089.000.000, -, the maximum value of 33.13 is PT. Astra International, Tbk in 2015 or Rp 245,435,000,000,000, -, mean 28,87 and standard deviation 1,54. Profitability variable has a minimum value of -20.80 namely PT. Bentoel International Investama, Tbk, in 2014, the maximum value of 50.00 is PT. Multi Bintang Indonesia, Tbk in 2013, mean 5.95, and standard deviation 10.33. This means that the highest value of profitability proxied by ROA is owned by PT. Multi Bintang Indonesia, Tbk in 2013 is quite efficient by utilizing its assets to gain profits for the company. While the lowest value is owned by PT. Bentoel International Investama, Tbk in 2014 is less efficient in utilizing its assets to gain profit for the company.
Copyright 2018 GMP Press and Printing (http://buscompress.com/journal-home.html) ISSN: 2304-1013 (Online); 2304-1269 (CDROM); 2414-6722 (Print)
create permanent bonds for the company in the form of obligation to pay interest and installment of its principal obligation periodically. While the highest value is owned by PT. Tirta Mahakam Resources, Tbk in 2013 which has a high level of financial risk. Media Exposure (ME) variable has a minimum value of 0.00, the maximum value of 1.00, the average value of 0.62, and a standard deviation of 0.49. This means that in average, manufacturing company that used as research sample revealed 62.00% of its carbon emissions through electronic media.
Carbon Emission disclosure (CED) variable has a minimum value of 1.000000, the maximum value of 17.00, mean of 4.96, and standard deviation of 3.47. In average, the disclosure of carbon emissions in manufacturing companies in the Indonesia Stock Exchange in the period 2013 to 2015 is still lacking, this is due to the lack of government regulations in Indonesia that require companies to disclose carbon emissions.
Panel D is a multivariate regression where we use the data panel method. We found that the adjusted R-square is 0.276998. It also shows that the model in this study can be trusted to have the ability to 27.70 percent of the dependent variable in explaining its independence. Based on the test results with the random effect model can be known that the independent variables namely company size, profitability, and ME have a positive relationship or same direction to the dependent variable. While the independent variable namely leverage has a negative relationship or the opposite direction to the dependent variable. The result of the influence between independent and dependent variables indicate that there are three independent variables that had a significant influence with probability level below (α) of 0.05 or with a confidence level of 95%. The three variables are company size with LNSIZE notation that has a probability value of 0.0000 (<0.05), profitability proxied by ROA has probability value of 0.0052 (<0.05); and media exposure with ME notation has probability value of 0.0000 (<0.05). Another variable is the leverage variable proxied by DER has no significant effect on the dependent variable due to have probability value of 0.2774 (> 0.05).
4.2. Discussion
The t-test results showed that company size which is proxied by total assets significantly affects on carbon emissions disclosure. This hypothesis test results supporting research carried out by Lorenzo et al. (2009), Choi et al. (2013) and Jannah and Muid (2014). The results of this study also support the theory of legitimacy that the large companies has greater pressure from environmental problems so they are tend to increase response to the environment. Large companies are more encouraged to provide qualified voluntary disclosure to gain legitimacy and disclose detailed information related to pollution.
Copyright 2018 GMP Press and Printing (http://buscompress.com/journal-home.html) ISSN: 2304-1013 (Online); 2304-1269 (CDROM); 2414-6722 (Print)
the ability to adopt an active strategic which seeking to influence its organization relations with stakeholders that considered important (Ghozali and Chariri, 2007). This can increase the tendency of social and environmental information disclosure. T test results on leverage variable which is proxied by debt to equity ratio have no significant effect on carbon emissions disclosure. These results do not support research conducted by Luo et al. (2013) who found that leverage has negative effect on carbon emissions disclosure. This study was supported by research conducted Lorenzo et al. (2009) which found that the leverage does not significantly affect carbon emissions disclosure.
T-test results showed for media exposure have significant effect carbon emissions disclosure. This hypothesis test results supporting research conducted by Dawkins and Fraas (2011). Dawkins and Fraas also found that the media exposure variable has a positive effect on carbon emissions disclosure. This shows that the role of the media can encourage companies to publicize their activities in the field of environment in order to get a positive response from its stakeholders. This is in line with the theory of legitimacy which social responsibility disclosure by the company in an attempt to gain legitimacy from the community in which they operate and to maximize its financial strength in the long term. Likewise, with the stakeholders theory that the company operates not only for its own sake but also must give benefits to its stakeholders.
5. CONCLUSION
We investigate the factors that affect carbon emissions disclosure at manufacturing companies in Indonesia. We found that company size has significant effect on carbon emissions disclosure. Large companies are encouraged to provide qualified voluntary disclosure to gain legitimacy and disclose detailed information related to pollution. Profitability has significant effect on carbon emissions disclosure at manufacturing companies in Indonesia. This means that the more effective company in gain profit from its business operations will contribute to the increase in carbon emissions disclosure. Media exposure significantly affects carbon emissions disclosure at manufacturing companies in Indonesia.This shows that the role of the media can encourage companies to publicize their activities in the field of environment in order to get a positive response from its stakeholders. We also find that the leverage does not significantly affect carbon emissions disclosure at manufacturing companies in Indonesia, making it large or small level of debt does not affect the level of carbon emission disclosure by the company.
This study have limitations in studying this field, where the measurements to the media exposure variable using dummy variable where a value of 1 for companies that disclose information relating to carbon emissions through electronic media, while a value of 0 for companies that do not disclose information relating to carbon emissions through electronic media, so this study can not detect exactly on how much disclosure about carbon emissions, as well as the sample used is only in manufacturing companies, so it is unknown how the effect of an independent variable on the dependent variable on other types of companies, such as mining, banking and others.
REFERENCES
Copyright 2018 GMP Press and Printing (http://buscompress.com/journal-home.html) ISSN: 2304-1013 (Online); 2304-1269 (CDROM); 2414-6722 (Print)
[2] Barthelot, Sylvie and Anne-Marie Robert. 2011. Climate Change Disclosure: An examination of Canadian Oil and Gas Firms. Issues in Social and Environmental Accounting 5: 106-123.
[3] Choi, Bo Bae, Doowon Lee, and Jim Psaros. 2013. An analysis of Australian Company Carbon Emission Disclosures. Pacific Accounting Review 25(1): 58-79. [4] Clarkson, Peter M, Yue Li, Gondon D. Richardson, and Florin P. Vasuari. 2008.
Revisiting The Relation Between Environmental Performance And Environmental Disclosure: An Empirical Analysis. Accounting, Organizations and Society 33(4-5): 303-327.
[5] Cotter, Julie, Norziana Lokman, and Muftah Mohamed Najah. 2011. Voluntary Disclosure Research: Which Theory is Relevant? The Journal of Theorical Accounting Research 6(2): 77-95.
[6] Dawkins, Cedric and John Fraas. 2011. The Impact of Environmental Performance and Visibility on Corporate Climate Change Disclosure.Journal of Business Ethics 100(2): 303 – 322.
[7] Deegan, C and Jeffrey Unerman. 2011. Financial Accounting Theory. Mc Graw-Hill Higher Education.
[8] Donovan, O’ Garry. 2002. Environmental Disclosure In The Annual Report: Extending The Applicability and Predictive Power of Legitimacy Theory.Accounting, Auditing, and Accountability Journal 15(3): 344-371.
[9] Dowling, J. and Pfeffer, J. 1975. Organizationa Legitimacy: Social Values and Organizational Behavior.ThePasific Sociological Review 18(1): 122-136.
[10] Freedman, Martin and Bikki Jaggi. 2005. Global warming, commitment to the Kyoto Protocol, and accounting disclosures by the largest global public firms from polluting industries. The International Journal of Accounting 40(3): 215-232.
[11] Galani, Despina, Anastasios Alexandridis, and Antonios Stavropoulus.The Association Between The Firm Characteristics and Corporate Mandatory Disclosure. International Journal of Social, Management, Economic and Business Engineering 5(5): 78-84.
[12] Ghomi, Zahra Borghei and Philomena Leung. 2013. An Empirical Analysis of the Determinants of Greenhouse Gas Voluntary Disclosure in Australia.Sciedu Press 2(1): 110-127.
[13] Ghozali, Imam and Anis Chariri. 2007. Teori Akuntansi. Badan Penerbit Universitas Diponegoro, Semarang.
[14] Gray, R. Kouhy and S. Lavers. 1994. Corporate Social and Environmental Reporting: A Review of The Literature and Longitudinal Study of UK Disclosure. Accounting, Auditing, and Accountability Journal 8: 47-77.
[15] Gujarati, D and Porter. (2015). Basic econometrics (4th ed.). Jakarta: Salemba Empat.
[16] Halim, Abdul dan Mamduh M. Hanafi. 2009. Analisis Laporan Keuangan. Edisi 4. UPP STIM YKPN. Yogyakarta.
[17] Haque, Shamima and Muhammad Azizul Islam. 2012. Stakeholder Pressures and Climate Change Disclosure: Australian Evidence. In AFAANZ 2012 Open Conference Proceedings, Accounting and Finance Association of Australia and New Zealand (AFAANZ), Melbourne, VIC, pp. 1-31.
Copyright 2018 GMP Press and Printing (http://buscompress.com/journal-home.html) ISSN: 2304-1013 (Online); 2304-1269 (CDROM); 2414-6722 (Print)
[19] http://www.ecolife.com/define/carbon-emission.html accessed on November 01, 2016, Time: 14.00, Lampung.
[20] http://www.idx.co.id/beranda/perusahaantercatat/laporankeuangandantahunan.asp x accessed on November 02, 2016, Time: 11.30, Lampung.
[21] http://www.nationalgeografic.co.id/berita/2015/10/emisi-karbon-indonesia-kalahkan-amerika. Accessed on November 01, 2016, Time: 10.30, Lampung. [22] html.tl.itb.ac.id, 2015 accessed on November 01, 2016, Time: 11.00, Lampung. [23] IPCC. 2007. Intergovernmental Panel on Climate Change. accessed on
http://www.ipcc.ch/.
[24] Jannah, Richatul and Dul Muid. 2014. Analisis Faktor-Faktor Yang Mempengaruhi Carbon Emission Disclosure Pada Perusahaan di Indonesia (Studi Empiris Pada Perusahaan Yang Terdaftar Di Bursa Efek Indonesia Periode 2010-2012). Diponegoro Journal of Accounting 3(2):1
[25] Kardono. 2010. Memahami Perdagangan Karbon. Pusat Standardisasi dan Lingkungan, Kementerian Kehutanan.
[26] Lindrianasari. 2013. Hubungan Antara Kinerja Lingkungan dan Kinerja Komite Audit Dengan Kualitas Pengungkapan Corporate Social Responsibility. Jurnal Akuntansi dan Keuangan 4(1): 63-81.
[27] Lindrianasari. Kufepaksi, Mahatma and Asmaranti, Yuztitya. 2017. Environmental Asset, Environmental Quality, and The Number of Exports. Review of Integrative Business & Economics Research 6(2): 205-216.
[28] Lorenzo, Jose Manuel Prado, Luis Rodriguez Domingues, Isabel Gallego Alvarez, and Isabel Maria Garcia Sanchez. 2009. Factors Influencing the Disclosure of Greenhouse Gas Emissions in Companies World-Wide. Journal of Management Decisions 47:1133-1157.
[29] Luo, Le, Qingliang Tang, and Yi-chenLan. 2013. Comparison of Propensity for Carbon Disclosure between Developing and Developed Countries. Accounting Research Journal 26(1): 6-34.
[30] Nur, Marzully and Denies Priantinah. 2012. Analisis Faktor-Faktor yang Mempengaruhi Pengungkapan Corporate Social Responsibility di Indonesia (Studi Empiris pada Perusahaan Berkategori High Profile yang Listing di Bursa Efek Indonesia). Jurnal Nominal 1(1).
[31] O’Donovan, G. 2002. Environmental Disclosures in the Annual Report: Extending the Applicability and Predictive Power of Legitimacy Theory. Accounting, Auditing and Accountability Journal 15(3): 344 – 371.
[32] Perpres No. 61 tahun 2011 mengenai Rencana Aksi Nasional Penurunan Emisi Gas Rumah Kaca.
[33] Perpres No. 71 tahun 2011 mengenai Penyelenggaraan Inventarisasi Gas Rumah Kaca Nasional.
[34] Wang, Jianling, Lin Song, and Shuijie Yao. 2013. The Determinants of Corporate Social Responsibility Disclosure: Evidence From China. The Journal of Applied Business Research 29(6).