Smart Grid Approach by Evaluating Power System Oscillation
Mode Using PMU Based Eigenvalues Estimatio
n
Takeshi Kudou *, Kenta Kushizaki , Yasunori Mitani , Masayuki Watanabe ,
Yaser Soliman Qudaih and Khairudin
Abstract
–One of the most important characteristics of the smart grid is the keen monitoring. At the same time, electrical energy has to cover the entire demand and electricity should be generated all the times. However, the electric power companies connected via transmission lines over wide area should consider the cost performance as well as the high reliability. In Japan, power system has a longitudinal structure which results in a wide-area oscillation with duration of 2 to 3 seconds and relatively weak damping characteristics. Phasor Measurement Units (PMUs) have been placed at different Japanese universities, to analyze the power system characteristic. These PMUs are employed to analyze variation of power system stability in Western Japan power system. This paper shows the dynamic characteristic of Japan power system using phasor difference data by PMU. In this research, a simplified oscillation model has been used to estimate eigenvalue of the wide-area oscillation mode. Moreover, the two-point differentiation which has been used during the differentiation process at a previous method has been modified by a three-point differentiation in an improved method. The relationship between stability and eigenvalue analysis are shown as low demand season and high demand season respectively.Keywords
:
, PMU; wide-area oscillation, FFT analysis, eigenvalue, three-point differentiation1. Introduction
Electrical energy should cover the entire demand and electricity should be generated all the times. The electric power companies are interconnected via transmission lines over wide area. In this case, emergency power should ensure that the whole power system is interconnected to improve the cost performance with high reliability. In Japan, power system has a longitudinal structure which results in a wide-area oscillation mode with duration of 2 to 3 seconds and relatively weak damping characteristics [1]. The wide-area oscillation mode is possible to cause power system instability depending on the trend of demand. However, centralized generation such as thermal power station is able to set up generating capacity in advance. Distributed generation such as renewable energy which is hard to estimate generating capacity is insecure. Thus, a method for observing stability of the power system in real time is much needed. Smart grid in transmission level is also preferred to insure a stable operation of the system in a smart way. In
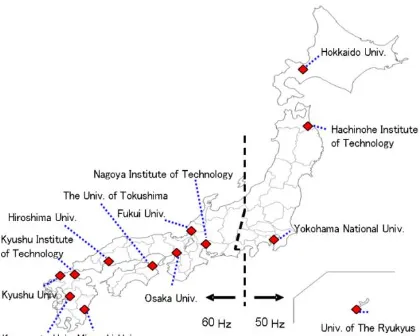
this research a smart grid approach for smart power system monitoring using a combination of PMU as an electrical interface and GPS as a time synchonizing interface is proposed. Phasor Measurement Units (PMUs) have been placed at different Japanese universities and synchronized based on the time stamp of the global positioning system (GPS). PMU in power system by the use of GPS, which increased rapidly in the middle of 1990, was introduced into Europe and America at the start [2]-[4]. A number of PMUs are located in different universities in Japan, as shown in Fig. 1. These units are employed for data collection. By installing PMUs at multiple locations in a power system, time synchronization measurements with accuracy of 1[s] can be achieved. [5]. Measured data clearly show the local frequency variations and phase difference between two areas. From these sets of information, wide-area oscillation and power system stability that are useful for analyzing power system dynamics can be investigated and examined [6][7]. This paper shows the dynamic characteristic of the power system using phasor difference data between Kyushu Institute of Technology (Kyutech) and Nagoya Institute of Technology (NIT) measured by PMUs. In this research, a simplified oscillation model has been used which includes phasor difference between Kyutech and NIT, differentiation of that phasor difference and second order differentiation. This * Dept. of Electrical Engineering, Kyushu Institute of Technology,
Japan ([email protected])
simplified oscillation model estimates eigenvalue of the wide-area oscillation mode. In addition, important processing methods of numerical differentiation have been utilized. Therefore, the two-point differentiation which has been used during the differentiation process at a previous method has been modified by a three-point differentiation in an improved method. In this way, the stability of the power system by finding the real part of eigenvalues could be observed. Moreover, when the real part of eigenvalues is estimated, several ranges of large amplitude and transient response are extracted from phasor difference. In this work the eigenvalues of phasor difference during low demand system and its hour by hour dynamic characteristic change. Approaching smart grid concept for a large scale system will be able to solve the problems of the two way communications in the large interconnected system.
Fig. 1. PMU locations in Japan power system
2. Extraction of Wide-Area Oscillation Mode
2.1 FFT Analysis – Observation of Wide-area
Oscillation
Fig.2 shows the waveform of phasor difference between Kyutech and NIT before FFT analysis. Apparently, Fig.3 shows that the wide-area oscillation mode can be observed around 0.4[Hz] from the result of the FFT analysis of phasor difference between power system in Western Japan. As shown in this figure, the wide-area oscillation mode is dominant.
Fig. 2. Phasor difference between Kyutech and NIT
Fig. 3. FFT analysis with PMU
2.2 Butterworth Filtering – Extraction of Wide-Area
Oscillation Mode
Butterworth filtering uses a band-pass filter of Butterworth characteristic. The band-pass filter of Butterworth characteristics is a filter that pass band is flat and attenuation band is a curve with a gentle slope. Frequency of the pass band edge is present in two places in that attenuation is -3[dB]. In this research, it is needed to extract oscillation data corresponding to particular frequency band by Butterworth filtering in order to focus attention to wide-area oscillation mode when estimating eigenvalue. After Butterworth filtering process, only components corresponding to the window frame of the filter are extracted. Then, the oscillation data only associated with the wide-area oscillation mode can be restructured from the extracted components. Fig.4 shows oscillation waveform of Fig.2 during 480~500s. Phasor
0 200 400 600 800 1000 1200
difference waveform after extracting with Butterworth filtering is shown in Fig.5, and damping characteristic of the oscillation can be observed.
Fig. 4. Phasor difference of original data during
480~500s
Fig. 5. Phasor difference after Butterworth filtering
3. Evaluation Method
To simplify the analysis, it is assumed that wide-area oscillation mode is equivalent to the analogy of single infinite bus system. Thus, following simplified oscillation model is obtained as shown in (1). using FFT filtering from PMU
: Differentiation of
: Second order differentiation of
By using these values in equation (1), coefficient matrix of that is estimated using least-squares method. Eigenvalues of the power system at steady state condition are estimated by a couple of complex conjugate eigenvalue of (1). Real part of eigenvalue indicates power system stability. Conditions for a stable system are that the real part of all eigenvalues is negative.
Numerical differentiation is becoming a problem in the differentiation process when eigenvalue is estimated using this method. In fact, we have found that a slight deviation occurs by using two-point differentiation in the differentiation process. Therefore, the accuracy of eigenvalue analysis method must be improved using three-point instead of two-three-point differentiation.
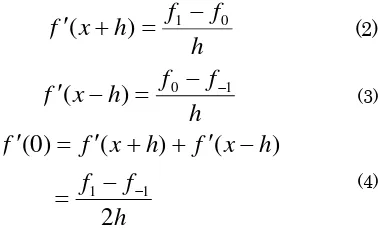
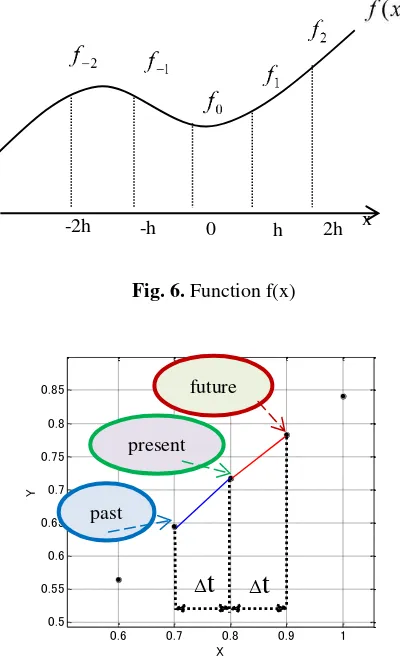
When the function f(x) is given as shown in Fig.6, we want to find the derivative f’(0) in x=0. Equation (4) is this derivative f’(0). Generally, accuracy increases to reduce the interval h. If function f(x) is given by second-order polynomial, three-point differentiation will be strict.
h
Fig. 7 shows three-point differentiation method. Three-point differentiation method takes the three Three-points of the "future", "present", "past". And, the slope of the "present" is determined by the average slope between "future" and "present", the slope between "present" and "past".
480 485 490 495 500
143
480 485 490 495 500
Fig. 6. Function f(x)
Fig. 7. Three-point differentiation method
4. Evaluation Results
By using the method as shown in preceding section, eigenvalue is estimated. Fig.8 shows the phasor difference of 1100 seconds in 13:50~14:10 on 29th August, 2010. This day is in a high demand season of summer of 2010. As can be seen from this figure, the phasor difference between 324~333s reveals large variation after a transient response. Therefore, this period of waveform is extracted to estimate the eigenvalue. Fig.9 is zoomed figure of Fig.8 during 324~333s.
Similarly, several periods are extracted and estimated from the phasor difference in 13:50~14:10 on 23th~28th August, 2010. By averaging the eigenvalues obtained value represents the eigenvalue of the day. Fig.10 shows the transition of the eigenvalue of one week.
Fig. 8. Phasor difference on 29th August, 2010
Fig. 9. Zoomed figure of Fig.8 during 324~333s
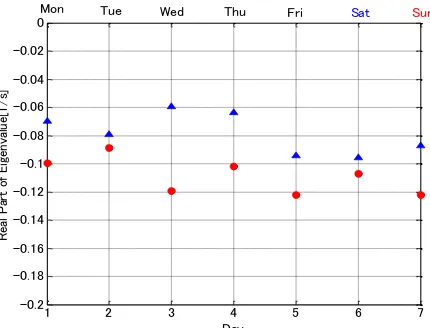
Also, real part of eigenvalues are estimated in one week during 25th~31th October, 2010 in Fig.11. This week is in a low demand season.
Mostly real part of eigenvalues during low demand season is lower than during high demand season. Accordingly, during low demand season, the stability level is higher than during high demand season.
0.6 0.7 0.8 0.9 1
200 400 600 800 1000
-1.5
Fig. 10. Real part of eigenvalues one week during high demand season
Fig. 11. Real part of eigenvalues one week during low
demand season
Fig. 12. Comparison of one week during high and low
demand season
5. Conclusion
In this paper, it is revealed that level of power system stability corresponding to the real part of eigenvalue are estimated by applying Butterworth filtering to wide-area phasor difference between Kyutech and NIT in one week by PMU. The eigenvalues estimated based on the simplified oscillation model are evaluated using three-point differentiation calculation for differentiation processing. Moreover, with comparing high demand season and low demand season results, it is shown that in low demand season the system is more stable than in high demand season.
It is concluded that the proposed method for estimating the eigenvalues are highly effective to monitor and control the system in real-time.
Approaching smart grid concept for a large scale system will be able to solve the problems of the intercommunications in the large interconnected system.
Acknowledgements
This work was supported by the Kyushu Institute of Technology.
References
[1] M. Watanabe, T. Hashiguchi, Y. Mitani, O. Saeki, M.Hojo, H. Ukai, ‘‘Improvement of the Evaluation of the Wide Area Power System Stability Based on Multiple Synchronized Phasor Measurements with Observation Sites Changed’’, IEEJ Tran. Power and Energy, Vol.128, No.1, 2008.
[2] R.O.Rurnett, Jr., M.M.Butts, et al, ‘‘Synchronized Phasor Measurements of a Power System Event,’’ IEEE Trans. On Power Systems, Vol.9, No.3, pp.1643-1650, 1994.
[3] Zhiqian Q. Bo, Geoff Weller, Tom Lomas, and Miles A. Redfern, ‘‘Positional Protection of Transmission Systems Using Global Positioning System,’’ IEEE Trans. On Power Delivery, Vol.15, No.4, pp.1163-1168, 2000.
[4] K.E.Martin (Chariman), ‘‘IEEE Standard for Synchrophasors for Power Systems,’’ IEEE Trans. On Power Delivery, Vol.13, No.1, pp.73-77, 1998.
[5] A. G. Phadke, “Synchronized phasor measurement in power system”, IEEE computer Application in power system, Vol.125, No.4, pp.10-15, 1993
[6] T. Hashiguchi, M. Yoshimoto, Y. Mitani, O. Saeki, K. Tsuji, M. Hojo and H. Ukai, “Observation of Power System Oscillation Characteristics by Using
1 2 3 4 5 6 7
Wed Thu Fri Sat
Tue
Mon Wed Thu Fri Sat Sun
1 2 3 4 5 6 7
Measurement Data Obtained from Demand Side Outlet”, Proc. Of IEEE conf. on PowerTech, BPT03 -289, Bologna, Italy, Jne 2003
[7] T.Hashiguchi, M. Yoshimoto, Y. Mitani, O. Saeki, K. Tsuji, M. Hojo and H. Ukai, “Analysis of Power System Dynamics Based on Multiple Synchronized Phasor Measurements”, Proc. Of IEEE conf. on Power Engineering Society General Meeting, No. 644, Toronto, Canada, July 2003.
.
Takeshi Kudou
He received B.S degree in electrical and electronic engineering from Kyushu Institute of Technology. His research interests are stability of the power system.