www.elsevier.com/locate/jml
0749-596X/$ - see front matter 2005 Elsevier Inc. All rights reserved. doi:10.1016/j.jml.2005.02.003
Audiovisual prosody and feeling of knowing
Marc Swerts, Emiel Krahmer
¤Communication and Cognition, Faculty of Arts, Tilburg University, P.O. Box 90153, NL-5000 LE Tilburg, The Netherlands
Received 9 July 2004; revision received 2 February 2005 Available online 16 March 2005
Abstract
This paper describes two experiments on the role of audiovisual prosody for signalling and detecting meta-cognitive information in question answering. The Wrst study consists of an experiment, in which participants are asked factual questions in a conversational setting, while they are being Wlmed. Statistical analyses bring to light that the speakers’ Feeling of Knowing (FOK) is cued by a number of visual and verbal properties. It appears that answers tend to have a higher number of marked auditory and visual cues, including divergences from the neutral facial expression, when the FOK score is low, while the reverse is true for non-answers. The second study is a perception experiment, in which a selection of the utterances from the Wrst study is presented to participants in one of three conditions: vision only, sound only, or vision + sound. Results reveal that human observers can reliably distinguish high FOK responses from low FOK responses in all three conditions, but that answers are easier than non-answers, and that a bimodal presentation of the stimuli is easier than the unimodal counterparts.
2005 Elsevier Inc. All rights reserved.
Keywords: Question answering; Feeling of knowing; Feeling of another’s knowing; Tip of the tongue; Audiovisual prosody; Facial expressions; Speech production; Speech perception
Speakers are not always equally conWdent about or committed to what they are saying. When asked a ques-tion, for instance, they can be certain or rather doubtful about the correctness of their answer, and they may be unable to respond at all, even though in some cases it might feel as if the answer lies on the tip of the tongue. It has been shown that such meta-cognitive aspects of question answering are reXected in the way speakers ‘package’ their utterances prosodically (Brennan & Wil-liams, 1995; Smith & Clark, 1993), where prosody can broadly be deWned as the whole gamut of features that
do not determine what speakers say, but rather how they say it (Bolinger, 1985; Cruttenden, 1986; Ladd, 1996). The prosodic cues may be helpful to addressees, because they can use them to determine whether or not they should interpret incoming sentences with a grain of salt (cf. Sabbagh & Baldwin, 2001). Sofar, research has focussed primarily on analyses of verbal features, such as particular intonation patterns, that are encoded in the speech signal itself. Visual cues, such as a wide range of gaze patterns, gestures, and facial expressions, are a nat-ural and important ingredient of communication as well. It seems a reasonable hypothesis that these might be informative just as verbal features are, though this issue is largely unexplored. The current paper tries to Wll this gap by looking at possible signals of meta-cognitive speaker states on the basis of combinations of verbal
* Corresponding author. Fax: +31 13 4663110.
E-mail addresses: [email protected] (M. Swerts),
and visual features, for which we will use the term audio-visual prosody (following, e.g., Barkhuysen, Krahmer, & Swerts, 2005; Krahmer & Swerts, 2004; Munhall, Jones, Callan, Kuratate, & Vatikiotis-Bateson, 2004; Srinivasan & Massaro, 2003). Since our work builds on insights of past studies of memory processes in question answering situations (e.g., Brennan & Williams, 1995; Smith & Clark, 1993), we Wrst discuss such prior work in more detail.
In traditional models of memory, answering factual questions (e.g., “Who wrote Hamlet?”) proceeds as fol-lows: when asked a question, a person searches for the answer in memory. If the answer is found, it will be pro-duced, else the person signals search failure by providing a non-answer such as “I don’t know.” A major deWcit of such simple models is that they leave unspeciWed for how long a person should search for an answer and what trig-gers the decision to produce a non-answer. For these rea-sons current models of memory often supplement the searching component with a meta-cognitive monitoring component, which continuously assesses a person’s knowledge. For each potential answer that the searching component retrieves, the monitoring component esti-mates the conWdence in the answer’s correctness. If the conWdence is high enough, the answer can be produced. If not, the search component can look for more conW -dent answers, provided the meta-memory assessment indicates that a proper answer may still be found (see, e.g., Andersen, 1999; Koriat, 1993; Nelson, 1996).
Smith and Clark (1993) emphasize that in a conversa-tional, every day setting, question answering is a social process, which involves information exchange as well as self-presentation. To account for this, Smith and Clark point out that a further component should be added to a model for question answering, namely a responding com-ponent, which uses the output of both search and moni-toring to provide feedback to the questioner. For instance, when a person responds to a question with an answer that has a relatively low conWdence score, the person can signal this uncertainty in his or her response; if the answer would turn out to be incorrect later on, the speaker might save face and look less foolish since it was suggested that there was little conWdence in the response (GoVman, 1967). Smith and Clark (1993) note that sig-nalling uncertainty of an answer can be done, for instance, via explicit commentary, using linguistic hedges such as “I guess” or “perhaps,” or, more implicitly, by using a rising, question-like intonation (e.g., Bolinger, 1985; Morgan, 1953). Similarly, speakers may want to account for delays using Wllers such as “uh” or “uhm” (e.g., Clark & Fox Tree, 2002), when the search has not resulted in an answer yet, even though the meta-memory assessment indicates that an acceptable answer may still be found after a prolonged search.
The resulting 3-fold model of question answering (searching, monitoring, and responding) yields a number
of testable predictions: if a speaker Wnds a question diY -cult, this will result in a longer delay and correspond-ingly more Wllers; and this will also result in more ‘marked’ answer behavior (hedges, and paralinguistic cues such as rising intonation and Wllers). To test these predictions, Smith and Clark (1993) use Hart’s (1965)
experimental method, a common technique to elicit meta-memory judgements. In this method participants are Wrst asked a series of factual questions in a conversa-tional setting. Then they are asked to rate for each ques-tion their feeling that they would recognize the correct answer [i.e., their Feeling of Knowing (FOK)]. Finally participants take the actual recognition test, i.e., a multi-ple-choice test in which all the original questions are pre-sented once more. The interesting thing is that this method provides a handle on the Tip of the Tongue (TOT) phenomenon where a speaker is unable to pro-duce an answer, but has the “feeling of knowing” it, per-haps because there was partial access to related information or because the question (cue) seemed famil-iar (e.g., Koriat, 1993; Reder & Ritter, 1992). Using this paradigm, Smith and Clark (1993) found that there was a signiWcant diVerence between two types of responses, answers and non-answers: the lower a speaker’s FOK, the slower the answers, but the faster the non-answers. In addition, the lower the FOK, the more often people answered with rising intonation, and added Wllers, explicit linguistic hedges and other face-saving com-ments. It is worth noting that high FOK answers and low FOK non-answers are similar in that both express some form of speaker certainty: in the case of a high FOK answer the speaker is relatively certain of the answer, while a low FOK non-answer indicates that the speaker is relatively certain that he or she does not know the answer. In both cases, the speaker will not embark on a longer memory search, and the reply will tend to con-tain few paralinguistic cues.
The question naturally arises whether other people can reliably determine the FOK of a speaker. To test this, Brennan and Williams (1995) Wrst performed an experiment which replicated Smith and Clark’s earlier Wndings, and subsequently made a selection of the speak-ers’ responses which were presented to listeners. These were tested on their Feeling of Another’s Knowing (FOAK) to see if meta-cognitive information was reli-ably conveyed by the surface form of responses. The results for answers showed that rising intonation and longer latencies led to lower FOAK scores, whereas for non-answers longer latencies led to higher FOAK scores.
Brennan and Williams (1995) conclude that listeners can indeed interpret the meta-cognitive information that speakers display about their states of knowledge in ques-tion answering.
concerned with linguistic and prosodic cues to meta-cog-nition. Arguably, the speaker cues for meta-cognition that they consider in their respective studies are obvious ones, but they are not fully representative of the richness of face-to-face communication, in which gestures and facial expressions play important roles as well. The only study we are aware of in which FOAK judgements were made by people that could actually see respondents answering questions is Jameson, Nelson, Leonesio, and Narens (1993), but in that study the respondents had to type their answers and were not allowed to speak.
There is ample evidence that visual information is a crucial element at various levels of face-to-face conversa-tion. A number of studies have shown that visual cues are beneWcial for the understandability of speech (e.g.,
Jordan & Sergeant, 2000; Sumby & Pollack, 1954). Dur-ing face-to-face communication, people pay a lot of attention to gestures (e.g., Kendon, 1994; Krauss, Chen, & Chawla, 1996; McNeill, 1992) and facial expressions such as nodding, smiling, and gazing (e.g., Clark & Krych, 2004): such visual cues help to structure the inter-action, for instance, by facilitating turn taking, or they support/supplement the information a speaker wants to convey. A number of recent studies also link gestures and other non-verbal behaviors to meta-cognitive pro-cesses (e.g., Frick-Horbury, 2002; Lawrence, Myerson, Ooknk, & Abrams, 2001; Morsella & Krauss, 2004).
Morsella and Krauss (2004), for instance, explicitly relate the use of gestures to the TOT phenomenon. They point out that mental representations are transient and that retrieving them is eVortful (Farah, 2000; cf. also
Kikyo, Ohki, & Miyashita, 2002). As a result, holding them in mind for lengthy intervals (as can occur during question answering) may be diYcult; gestures, they argue, facilitate speech production more directly, since they continuously activate the prelinguistic sensorimotor features that are part of semantic representations of tar-get words (Morsella & Krauss, 2004 refer to this as the Gestural Feedback Model). Besides gestures, facial cues can be indicative of meta-cognitive processes as well.
Goodwin and Goodwin (1986) (see also Clark, 1996) already discussed the communicative relevance of the so-called “thinking face”: it often happens that, during search, a respondent turns away from the questioner with a distant look in the eyes in a stereotypical facial gesture of someone thinking hard. In a similar vein, it has been argued that gaze may be indicative of memory processes (e.g., Glenberg, Schroeder, & Robertson, 1998). Given such earlier work which suggests that visual information may be a cue for meta-cognition, it is inter-esting to see whether speakers produce visual cues corre-lating with their feeling of knowing and whether such cues can be perceived by others and used to estimate the feeling of another’s knowing. Additionally, an audiovi-sual study of meta-cognitive information is relevant from the view point of multisensory perception. In this Weld of
research, one open question is what the relative contribu-tions are of visual and auditory cues in audiovisual per-ception and how the two groups of cues interact. On the basis of earlier studies, it can be conjectured that the rela-tive importance of auditory and visual cues diVers for diVerent aspects of communication. Information presenta-tion, for instance, is traditionally studied from an audi-tory perspective. At the basic level of understandability the acoustic signal usually provides suYcient information (see, e.g., Kohlrausch & van de Par, 2005). Visual cues tend to inXuence understandability in, for instance, adverse acoustical conditions (e.g., Benoît, Guiard-Mari-gny, Le GoV, & Adjoudani, 1996; Jordan & Sergeant, 2000; Sumby & Pollack, 1954) or in the case of incongru-encies (as in the well-known McGurk eVect, where an auditory /ba/ combined with a visual /ga/ is perceived as /da/ by most subjects, McGurk & MacDonald, 1976). At the level of prosody a similar dominance of auditory cues can be observed. For instance, a number of prosodic studies that focussed on audiovisual signalling of promi-nence (indicating which words in an utterance are impor-tant) found that, even though facial cues such as head nods and eyebrow movements contribute to perceived prominence, the auditory cues (i.e., pitch accents) domi-nate (e.g, Keating et al., 2003; Krahmer & Swerts, 2004; Swerts & Krahmer, 2004). In general, the vast majority of studies have concentrated on verbal prosody, while only recently an interest in audiovisual prosody seems to emerge. When looking at emotion, on the other hand, it appears that visual cues (in particular facial expressions) are judged to be more important than auditory cues such as voice information (e.g., Bugenthal, Kaswan, Love, & Fox, 1970; Hess, Kappas, & Scherer, 1988; Mehrabian & Ferris, 1967; Walker & Grolnick, 1983), and it may be noted that emotion research initially focussed on facial perception (see, for instance, the work of Paul Ekman and colleagues, e.g., Ekman, 1999). Interestingly, various more recent studies have shown that both modalities inXuence emotion perception of incongruent stimuli, where the visual channel may oVer one emotion (‘happy’) and the auditory channel another (‘sad’) (e.g., de Gelder & Vroomen, 2000; Massaro & Egan, 1996). Meta-cogni-tive information during question answering is an interest-ing candidate to investigate from this audiovisual perspective, since it shares some characteristics with both emotion (in that it reXects a speakers’ internal state) and with information presentation (in the meta-cognitive sig-nalling in the actual response).
In this paper, we describe two experiments which study the role of audiovisual prosody for the production and perception of meta-cognitive information in ques-tion answering. We will be particularly interested in com-binations of auditory cues (rising intonation, Wllers, and unWlled pauses) with visual cues (such as gaze, eyebrow movements, and smiles). For Experiment 1, we use
non-answers with diVerent FOK scores, which we then ana-lyze in terms of a number of audiovisual prosodic fea-tures. The study by Brennan and Williams (1995) focused on auditory cues alone, while the goal of Experiment 2 is to explore whether observers of speakers’ responses (col-lected in Experiment 1) are able to guess these speakers’ FOK scores on the basis of visual cues as well. In partic-ular, we are interested in whether a bimodal presentation of stimuli leads to better FOK predictions than the uni-modal components in isolation. While we expect that we get the best performance for bimodal stimuli, it is an interesting empirical question whether the auditory or the visual features from the unimodal stimuli are more informative for FOK predictions.
Experiment 1
Method
Participants
Twenty participants (11 male, 9 female), colleagues and students from Tilburg University, between 20 and 50 years old, participated as speakers in the experiment on a voluntary basis. None of the participants objected to being recorded, and all granted usage of their data for research and educational purposes.
Materials
The materials consisted of a series of factual ques-tions, taken in part from a Dutch version of the “Wechs-ler Adult Intelligence Scale” (WAIS), an intelligence test for adults. We selected only those questions which would trigger a one-word response (e.g., Who wrote Hamlet? What is the capital of Switzerland?), and added a supple-mentary list of questions from the game Trivial Pursuit. The 40 questions in total covered a wide range of topics, like literature, sports, history, etc. The list of questions was presented to participants in one of two random orders (see Appendix A).
Procedure
Following Hart (1965) and Smith and Clark (1993), the experimental procedure consisted of three stages. In the Wrst stage, the 40 questions were posed by the experi-menter, and the responses by the participant were Wlmed (front view of head). As in Smith and Clark (1993), partic-ipants could not see the experimenter and they were told that this was to avoid the participants from picking up any potential cues the experimenter might give about the correctness of their answers. Participants were told that the experimenter could see them via the digital camera, which was connected to a monitor behind a screen. The experimenter asked the series of 40 questions one by one, and the pace of the experiment was determined by the par-ticipant. As an example, here are Wve responses (translated
from Dutch) to the question about the name of the person who drew the pictures in “Jip en Janneke,” a famous Dutch book for children written by Annie M.G. Schmidt:
(a) Fiep Westendorp
(b) uh Fiep Westen-(short pause)-dorp
(c) (short pause) Isn’t that Annie M.G. Schmidt? (d) no idea
(e) uh the writer is Fiep Westendorp, but the draw-ings? No, I don’t know
The example shows cases of correct answers, which could be Xuent (a) or hesitant (b), an incorrect answer (c), and a simple (d) and complex (e) case of a non-answer.
In the second stage, the same sequence of questions was again presented to the same participants, but now they had to express on a 7-point scale how sure they were that they would recognize the correct answer if they would have to Wnd it in a multiple-choice test, with 7 meaning “deWnitely yes” and 1 “absolutely not.” The third stage was a paper-and-pencil test in which the same sequence of questions was now presented in a multiple-choice in which the correct answer was mixed with three plausible alternatives. For instance, the question “What is the capital of Switzerland?” listed Bern (correct) with three other large Swiss cities: Zürich, Genève, and Basel. Participants were unaware of the real purpose of the study, but were told that its goal was to learn more about the average complexity of a series of questions which could be used in future psycholinguistic research. They were warned beforehand that questions were expected to vary in degree of diYculty. To encourage them to do their best and guess the correct answer in case of uncertainty, the experiment incorporated an ele-ment of competition, where the ‘winner’ (i.e., the person with the highest number of correct answers in the Wrst test) got a small reward (a book token).
Labelling, annotation
All utterances from the Wrst test (800 in total) were transcribed orthographically and manually labelled regarding a number of auditory and visual features by four independent transcribers. The labelling was based on perceptual judgements and features were only marked when clearly present.
Regarding verbal cues, we labelled the presence or absence of the following features:
Delay:Whether a speaker responded immediately, or took some time to respond.
High intonation:Whether a speaker’s utterance ended in a high or a low boundary tone.
For simplicity’s sake, all three verbal features were treated in a binary way. A clearly perceivable pause before speaking was labelled as a delay while an immedi-ate response was not. We did not measure precise delay durations as Smith and Clark (1993) and Brennan and Williams (1995) did. Concerning high intonation, note that we did not attempt to isolate question intonation, as it turned out to be diYcult to consistently diVerentiate ‘real’ question intonation from list intonation. Finally, for the labelling of Wllers we did not diVerentiate between ‘uh,’ ‘uhm’ or ‘mm,’ since the results of the perception study of Brennan and Williams (1995) only revealed minor diVerences between them.
In addition to these categorical variables, we counted the number of words spoken in the utterance, where family names, like Elvis Presley, were considered to be one word. This count provides a rough measure for the amount and length of linguistic hedges (such as “I guess”) used by speakers, where we did not diVerentiate between the kind of explicit commentary used.
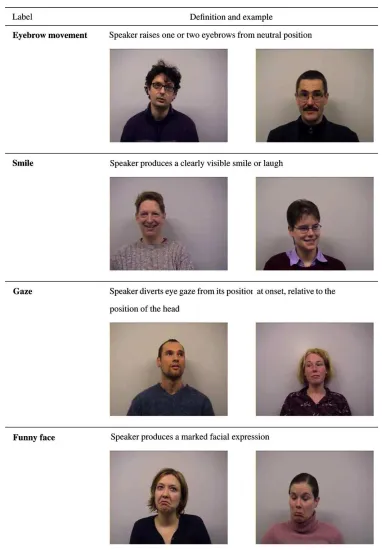
As to the visual cues, we labelled the presence or absence of the following features:
Eyebrow movement:If one or more eyebrows departed from neutral position during the utterance.
Smile:If the speaker smiled (even silently) during the response.
Low Gaze:Whether a speaker looked downward dur-ing the response.
High Gaze:Whether a speaker looked upward during the response.
Diverted Gaze:Whether a speaker looked away from the camera (to the left or the right) during the response.
Funny face:Whether the speaker produced a marked facial expression, which diverted from a neutral expression, during the response.
Note that an utterance may contain multiple marked features. In addition to the isolated features mentioned above, we also counted the number of diVerent gaze acts, i.e., combinations of high, low or diverted gaze. In the literature on facial expressions, the features gaze (Argyle & Cook, 1976; Gale & Monk, 2000; GriYn, 2001; Glenberg et al., 1998), smiling (Kraut & Johnson, 1979), and brow movements (Ekman et al., 1979; Krahmer & Swerts, 2004) are men-tioned as informative cues in spoken interaction, and a Wrst inspection of the recordings revealed that they occur relatively frequently in the current data set. The expression we, for want of a better term, called “funny face” can be seen as speciWc instance of Goodwin and Goodwin’s (1986) thinking face, explicitly suggesting uncertainty. Fig. 1 contains some representative stills for each of the visual features. The visual features are roughly comparable with Action Units (AUs)
described by Ekman and Friesen (1978), though there is not necessarily a one-to-one mapping to these Action Units. The action units form the building blocks of Ekman and Friesen’s Facial Action Coding System which builds on the assumption that facial actions can be described in terms of muscular action. The basic action units correspond with single muscle activities and more complex facial expressions can be described using these atomic building blocks. Fig. 1, in particular, displays examples of marked settings of smile (AU 12, AU 13), gaze (AU 61–AU 64), and eye-brow raising (AU 1, AU 2). Funny faces typically con-sist of a combination of AUs such as lip corner depression (AU 15), lip stretching (AU 20) or lip press-ing (AU 24), possibly combined with eye widenpress-ing (AU 5), and eyebrow movement as well.
The labelling procedure was as follows. On the basis of a preliminary labelling protocol, utterances from two speakers were labelled collectively. For most cues the labelling was unproblematic, and for the few more diYcult cases, mostly involving gaze, a consensus label-ling was reached after discussion. This Wrst phase resulted in an explicit labelling protocol, after which the labellers proceeded individually by labelling a selection of the cues in the recordings from the remain-ing 18 speakers. Only the feature gaze was annotated by two persons who labelled the diVerent gaze acts in an utterance (low, high, and diverted) in isolation and resolved mismatches via discussion. All features were annotated independently from the FOK score to avoid circularity. Similarly, annotators only looked at answers without taking the question context into account, so that the answer’s (in)correctness could not bias the annotator.
Statistical analyses
Our statistical procedure closely follows the ones proposed by Smith and Clark (1993) and Brennan and Williams (1995). We obtained 800 responses, 40 from each of the 20 participants. These responses are not independent so that analyses across the entire data set are inappropriate. Therefore, the following tests are always based on individual analyses per speaker. We computed correlation coeYcients for each subject indi-vidually, transformed the correlations into Fischer’s zr scores, and tested the average zr score against zero. The average zr scores were then transformed back into cor-relations for reporting in this article. Similarly, when comparing means, we computed a mean for each speaker, and used these composite scores in our analy-ses. In any individual analysis, we did not include any participant for whom we could not compute an individ-ual correlation or mean, so some of our statistics, as in
Results
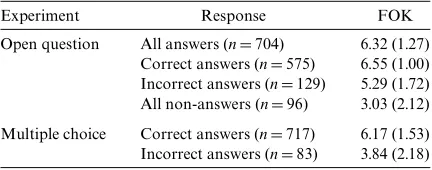
It appeared that the participants found a majority of the questions very easy, as they gave a maximum FOK score of 7–61.1% of the questions, a score of 6–13.4% of the questions, and lower scores to the remaining 25.5%. In addition, 71.9% of the questions of the Wrst task were indeed answered correctly and 89.6% of the same list of questions in the multiple-choice test. Table 1 lists the aver-age FOK scores as a function of Question Type (open question versus multiple choice), and the response catego-ries (correct answers, incorrect answers, and non-answers). Speakers’ mean FOK ratings were higher when they were able to produce an answer than when they were not (with subjects as random factor, F1(1,17)D71.821, p< .001; with items as random factor, F2(1,23)D59.028, p< .001). The mean FOK ratings were higher for correctly recalled answers than for the incorrect ones (F1(1,19)D149.233, p< .001; F2(1,35)D38.086, p< .001). Speakers also gave higher FOK ratings on average for responses that they later recognized in the multiple choice test (F1(1,18)D55.018, p< .001; F2(1,27)D19.714, p< .001). These data thus show that there is a close correspondence between the FOK scores and the correctness or incorrect-ness of a response in both the open test and the multiple-choice. The results are similar to those of Smith and Clark (1993) and Brennan and Williams (1995).
In general, it can be observed that participants diVer in the extent to which they use diVerent audiovisual features, but these diVerences do not appear to relate to age or sex of the participants. Table 2 lists the correlation coeYcients between the FOK scores and number of words, gaze acts (deWned as the sum of low, high, and diverted gaze) and marked features (deWned as the sum of all features minus words and gaze). It can be seen that there are negative cor-relations between the FOK scores and these variables for answers, and positive correlations for non-answers. In other words, for answers, higher FOK scores correspond with a lower number of words, gaze acts and marked fea-tures, and the opposite relation holds for non-answers, where higher FOK scores correspond with more words, more gaze acts, and more marked features.
An analogous picture emerges from Tables 3 and 4, which give the average FOK scores for presence versus
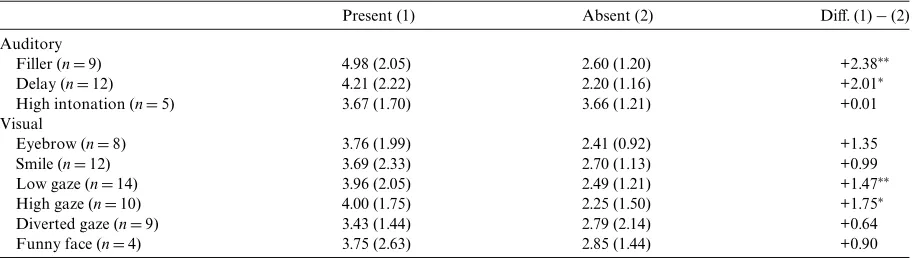
absence of audiovisual features for answers and non-answers, respectively. Table 3 shows that the presence of a verbal feature (Wller, delay or high intonation) coin-cides with a signiWcantly lower FOK score. And simi-larly for the visual features, where the presence of an eyebrow movement, a smile, a gaze act (high, low, and diverted) or a funny face generally is associated with a lower FOK score, which is signiWcant in all cases except for the smile. As expected, the results in Table 4 display the opposite pattern. When a verbal feature is present in a non-answer this corresponds to a signiWcantly higher FOK score for Wller and delay. Looking at the visual cues, it can be seen that the presence of a marked feature setting is associated with a higher FOK score as well, albeit that the diVerences are only signiWcant for low and high gaze, partly because of the limited number of data points here (reXected by the lower n Wgures for non-answers). Moreover, non-answers are perhaps inherently less likely to be associated with a high intonation, pre-sumably because speakers do not need to question their own internal state (see, e.g., Geluykens, 1987), which is reXected in a diVerence score of only 0.01.
To learn more about the cue value of combinations of features, we also calculated, for answers and non-answers separately, the average FOK scores for responses that diVer regarding the number of marked feature settings (minimum: 0, maximum: 7). Note that the theoretical possibility of an utterance containing 8 or 9 marked fea-ture settings did not occur in our data set. The results of this are visualized in Fig. 2, which again illustrates oppo-site trends for the two response categories: for answers, the average FOK score decreases with an increasing number of marked features, while the opposite is true for non-answers (cf. also the last row of Table 2).
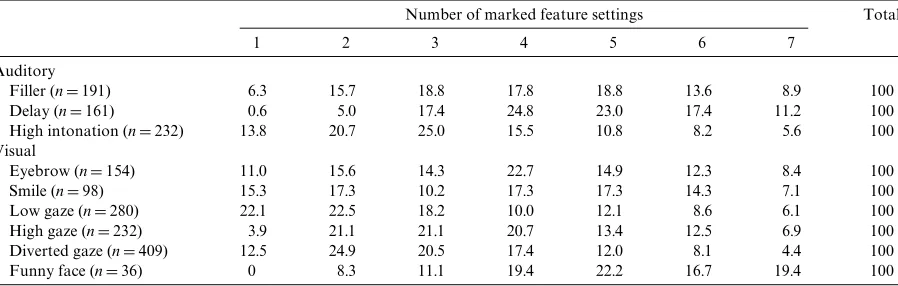
Table 5 lists the distribution (in percentages) of cases with a marked setting for our diVerent auditory and visual features as a function of the relative number of marked features present (1–7). First, looking at the n val-ues in the left column, this table reveals that there are considerable diVerences in relative frequency between the diVerent features: the diVerent gaze acts (low, high, and Table 1
Average FOK scores (and standard deviations) for diVerent response categories
Experiment Response FOK
Open question All answers (nD704) 6.32 (1.27) Correct answers (nD575) 6.55 (1.00) Incorrect answers (nD129) 5.29 (1.72) All non-answers (nD96) 3.03 (2.12) Multiple choice Correct answers (nD717) 6.17 (1.53) Incorrect answers (nD83) 3.84 (2.18)
Table 2
Pearson correlation coeYcients of FOK scores with words (number of words), gaze acts (sum of low, high, and diverted gaze), and marked features (sum of Wller, delay, high intonation, eyebrow, smile, and funny face)
The n indicates for how many participants an individual corre-lation could be computed.
¤¤¤ p< .001. Correlations of FOK scores with
Response
Answers (nD20) Non-answers (nD13)
Words ¡.265¤¤¤ .695¤¤¤
Gaze acts ¡.325¤¤¤ .630¤¤¤
especially diverted) and high intonation occur very often, as opposed to the features smile and funny face which are more rarely used. But, in addition, the table also makes it clear that some features can relatively more often be used in isolation or with only one more other feature present (like, low gaze, smile, and high intonation), whereas fea-tures like funny face and especially delay tend to co-occur with a high number of marked settings for other features.
Discussion
This Wrst study has replicated some of the Wndings of the research by Smith and Clark (1993), and extended them into the visual domain. It was found that our partic-ipants’ FOK scores correspond with their performance in the open question and multiple-choice test, and, in addition, particular audiovisual surface forms of the
utterances produced by our speakers are indicative of the amount of conWdence speakers have about the correct-ness of their response. For answers, lower scores correlate with occurrences of long delay, Wllers and high intonation, as well as a number of gaze features, eyebrow movements, funny faces, and smile. In addition, speakers tend to use more words and more gaze acts, when they have a lower FOK. For non-answers, the relationship between FOK scores and the diVerent audiovisual features is the mirror image of the outcome with answers, which is as expected given that both high FOK answers and low FOK non-answers correspond to speaker certainty. If we compare the average FOK scores with the frequency of occurrence for the various marked settings of audiovisual features, it can be seen that the presence or absence of some highly frequent features such as diverted gaze and high intona-tion has a relatively small impact on the average FOK Table 3
Average FOK scores (and standard deviations) for answers as a function of presence or absence of audiovisual features
Statistics are based on paired t test analyses. The n indicates the number of participants for which individual means could be computed. The DiV. score is obtained by subtracting the average Absent FOK score from the average Present FOK score.
¤ p< .05. ¤¤p< .01. ¤¤¤ p< .001.
Present (1) Absent (2) DiV. (1)¡(2)
Auditory
Filler (nD19) 5.70 (1.00) 6.53 (0.32) ¡0.83¤¤¤
Delay (nD20) 5.23 (0.80) 6.53 (0.27) ¡1.30¤¤¤
High intonation (nD19) 5.91 (0.80) 6.40 (0.27) ¡0.49¤
Visual
Eyebrow (nD19) 5.78 (0.87) 6.46 (0.26) ¡0.69¤¤¤
Smile (nD17) 5.69 (1.36) 6.36 (0.35) ¡0.67
Low gaze (nD20) 6.05 (0.61) 6.47 (0.33) ¡0.42¤¤
High gaze (nD19) 5.72 (0.98) 6.52 (0.34) ¡0.80¤¤¤
Diverted gaze (nD20) 5.96 (0.57) 6.64 (0.38) ¡0.68¤¤¤
Funny face (nD10) 4.78 (1.19) 6.38 (0.43) ¡1.60¤¤
Table 4
Average FOK scores (and standard deviations) for non-answers as a function of presence or absence of a audiovisual features
Statistics are based on paired t test analyses. The n indicates the number of participants for which individual means could be computed. The DiV. score is obtained by subtracting the average Absent FOK score from the average Present FOK score.
¤ p< .05. ¤¤p< .01.
Present (1) Absent (2) DiV. (1)¡(2)
Auditory
Filler (nD9) 4.98 (2.05) 2.60 (1.20) +2.38¤¤
Delay (nD12) 4.21 (2.22) 2.20 (1.16) +2.01¤
High intonation (nD5) 3.67 (1.70) 3.66 (1.21) +0.01
Visual
Eyebrow (nD8) 3.76 (1.99) 2.41 (0.92) +1.35
Smile (nD12) 3.69 (2.33) 2.70 (1.13) +0.99
Low gaze (nD14) 3.96 (2.05) 2.49 (1.21) +1.47¤¤
High gaze (nD10) 4.00 (1.75) 2.25 (1.50) +1.75¤
Diverted gaze (nD9) 3.43 (1.44) 2.79 (2.14) +0.64
score, while this eVect is substantial for an infrequent fea-ture such as funny face (especially for answers).
The Wrst study was a speaker-oriented approach to gain insight into audiovisual correlates of FOK. While our analyses revealed that there was a statistical relation-ship between the two, this in itself does not prove that the audiovisual properties also have communicative rele-vance. To prove this, we performed a perception study, for which we used earlier work by Brennan and Williams (1995) as our main source of inspiration.
Experiment 2
Method
Participants
Participants were 120 native speakers of Dutch, stu-dents from the University of Tilburg, none of whom had participated as speaker in the Wrst experiment.
Materials
From the original 800 responses, we selected 60 utter-ances, of which 30 were answers and 30 non-answers. Of both the answers and the non-answers, 15 had high FOK and 15 low FOK scores. Following Brennan and Wil-liams (1995), only the answer of a question–answer pair was presented to participants, to avoid that participants would unconsciously use their own estimation of the question’s diYculty in their perception of the answer. The selection was based on written transcriptions of the responses by someone who had not heard or seen the original responses. Given the individual diVerences in the use of the FOK scale, we chose to use—per speaker—the two highest scores as instantiations of high FOK scores and the two lowest as low FOK scores. The (in)correctness of the answer was not taken into account when selecting the stimuli, hence both high FOK and low FOK answers could be incorrect. We initially made a random selection of stimuli meeting these restrictions, but utterances were iteratively replaced until the follow-ing criteria were met:
1. The original question posed by the experimenter should not appear again in the participants’ response. 2. All the answers should be lexically distinct, and should thus not occur twice. This criterion was not applied to the non-answers as they were very similar. 3. The responses should be maximally distributed
across speakers. There should be maximally two answers and two non-answers per speaker.
Having applied this procedure on the basis of written transcriptions of the data, we Wnally replaced a couple of stimuli by others, if the signal-to-noise ratio made them unsuitable for the perception experiment.
Procedure
The selected stimuli were presented to participants in three diVerent conditions as a group experiment: one Fig. 2. Average FOK scores for answers and non-answers as a
function of the relative number of marked prosodic features (minimumD0, maximumD7; combinations of 8 or more fea-tures do not occur).
Table 5
Percentage of marked settings for diVerent audiovisual features as a function of the relative number of marked prosodic features
MinimumD1, maximumD7; combinations of 8 or more features do not occur.
Number of marked feature settings Total
1 2 3 4 5 6 7
Auditory
Filler (nD191) 6.3 15.7 18.8 17.8 18.8 13.6 8.9 100
Delay (nD161) 0.6 5.0 17.4 24.8 23.0 17.4 11.2 100
High intonation (nD232) 13.8 20.7 25.0 15.5 10.8 8.2 5.6 100
Visual
Eyebrow (nD154) 11.0 15.6 14.3 22.7 14.9 12.3 8.4 100
Smile (nD98) 15.3 17.3 10.2 17.3 17.3 14.3 7.1 100
Low gaze (nD280) 22.1 22.5 18.2 10.0 12.1 8.6 6.1 100
High gaze (nD232) 3.9 21.1 21.1 20.7 13.4 12.5 6.9 100
Diverted gaze (nD409) 12.5 24.9 20.5 17.4 12.0 8.1 4.4 100
third of the participants saw the original clips as they were recorded (Vision + Sound), another third saw the same clips but then without the sound (Vision), whereas the last third could only hear the utterances without see-ing the image (Sound). In all three conditions, stimuli were presented on a large cinema-like screen with loud-speakers to the right and left over which the sound was played in the Vision + Sound and Sound condition. Both the visual and the auditory information were clearly perceptible for participants. Participants in each condition were Wrst presented with the stimulus ID (1– 30) followed by the actual stimulus. In case of the sound only stimuli, participants saw a black screen instead of the original video recording. The motivation to present sound only stimuli also visually was to make sure that participants were aware of the start of the utterance, in case there was a silent pause in the beginning of the utterance. The interstimulus interval was 3 s. Within a condition, participants had to judge recordings in two separate sessions, one with answers as stimuli and one with non-answers. The question to the participants about the answers was whether a person appeared “very uncertain” (1) or “very certain” (7) in his/her response. The question for the non-answer stimuli was whether participants thought the person would recognize the correct answer in a multiple-choice test, with 1 meaning “deWnitely not” and 7 “deWnitely yes.” Below, the scores are referred to as the Feeling of Another’s Knowing (FOAK) scores. Each part of the experiment was pre-ceded by a short exercise session with two answers and two non-answers, respectively, to make participants acquainted with the kinds of stimulus materials and the procedure.
Statistical analyses
The participants’ responses were statistically tested with a repeated measures ANOVA with the FOAK scores as dependent variable, with original FOK scores and response type as within-subjects factors, and cue modality (Vision, Sound, and Vision + Sound) as between-subjects factor. Pairwise comparisons were made with the Tukey HSD method.
Results
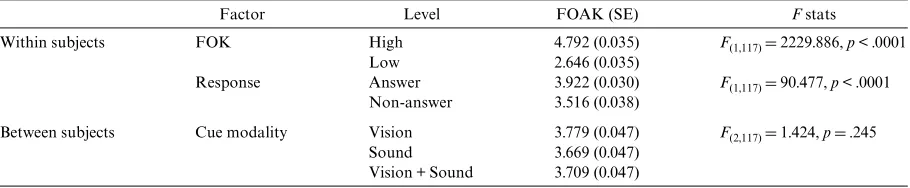
Table 6 shows that there were signiWcant eVects on the participants’ FOAK scores of original FOK status of the utterance (high FOK utterances receive higher FOAK scores than low FOK utterances) and of response cate-gory (answers receive higher FOAK scores than non-answers), while there was no main eVect of the cue modality (Vision, Sound, and Vision + Sound). However, there were signiWcant 2-way interactions between FOK and cue modality (F(2,117)D54.451, p< .001) and between response and cue modality (F(1,117)D241.597, p< .001), and a signiWcant 3-way interaction between FOK, cue modality and response (F(2,117)D3.291, p< .05). Split analyses showed that these main eVects and interactions also hold when looking at the three cue modalities sepa-rately. For all cue modalities the diVerence in FOAK score between high FOK and low FOK utterances was signiWcant (Vision: F(1,39)D270.070, p< .001; Sound: F(1,39)D957.515, p< .001; Vision + Sound: F(1,39)D 1516.617, p< .001), and similarly for response category (Vision: F(1,39)D16.629, p< .001; Sound: F(1,39)D29.090, p< .001; Vision + Sound: F(1,39)D54.977, p< .001). There was always a signiWcant interaction between FOK status and response category (Vision: F(1,39)D79.179, p< .001; Sound: F(1,39)D41.307, p< .001; and Vision + Sound: F(1,39)D161.703, p< .001).
The 2-way interactions can easily be understood when we look at the average scores for combinations of FOK and cue modality, and response and cue modality (see Tables 7 and 8, respectively). The Wrst table shows that the diVerence in scores for low and high FOK scores
Table 6
ANOVA results (main eVects) for perception experiment: average FOAK scores as a function of FOK, response category, and experi-mental condition
Factor Level FOAK (SE) F stats
Within subjects FOK High 4.792 (0.035) F(1,117)D2229.886, p< .0001
Low 2.646 (0.035)
Response Answer 3.922 (0.030) F(1,117)D90.477, p< .0001 Non-answer 3.516 (0.038)
Between subjects Cue modality Vision 3.779 (0.047) F(2,117)D1.424, pD.245
Sound 3.669 (0.047)
Vision + Sound 3.709 (0.047) Table 7
FOAK scores (and SE) for high FOK and low FOK stimuli in diVerent experimental conditions
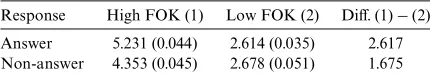
is more extreme in the Vision + Sound condition, than in the unimodal conditions, meaning that the participants’ ratings were more accurate when participants had access to both sound and vision. Notice that this explains why no main eVect of experimental condition was found: the diVerences in FOAK scores between high FOK and low FOK stimuli change, while the overall FOAK averages stay the same (see Table 6). The second table shows that the diVerence between high and low FOK scores is—as expected—easier to perceive in answers than in non-answers. A separate analysis of variance revealed that the diVerences between FOAK scores for high FOK and low FOK stimuli were signiWcantly diVerent for the diVerent cue modalities (F(2,237)D46.248, p< .001). Post hoc pairwise comparisons using Tukey HSD tests showed that the diVerences in FOAK ratings between high FOK and low FOK stimuli for a given cue modality was signiWcantly diVerent from the diVerences in ratings for any of the other two cue modalities.
Discussion
The results of the second perception test are consistent with the Wndings of the Wrst analysis of speaker’s expres-sion of uncertainty. It appears that participants are able to diVerentiate low FOK responses from high FOK responses in the unimodal experimental conditions, but they clearly performed most accurately in a bimodal con-dition. This suggests that the addition of visual informa-tion, which was not present in the aforementioned FOK and FOAK studies, is beneWcial for detecting uncertainty. While we had seen that answers and non-answers exhibit opposite audiovisual features, human participants are able to adapt their judgments: they are able to tell the diV er-ence between low and high FOK for both response cate-gories, be it that the performance for non-answers drops compared to answers, in line with previous observations of Brennan and Williams (1995). In conclusion, this study brought to light that the audiovisual features of our origi-nal utterances have communicative relevance as they can be interpreted by listeners as cues of a speakers’ level of conWdence.
Since only high and low FOK stimuli were used in Experiment 2, it would be interesting to see whether the FOAK eVect persists for middle range FOK stimuli. We hypothesize that participants would indeed note that speakers are relatively uncertain when uttering a medium FOK answer, since, generally, a lower FOK
answer corresponds to more audiovisual marked cues (cf. Fig. 2), but how uncertain speakers are judged remains an open question. Additionally, the current experiment is a judgement study in which participants are speciWcally asked to rate the perceived FOK of a speaker’s utterance. It would be interesting to see if and how people actually use audiovisual prosody as a cue for FOK during natural conversations. We conjecture that such cues will also be picked up and interpreted correctly during ‘on line’ communication, and hope to address this in future research.
General discussion
In response to a question, speakers are not always equally conWdent about the correctness of their answer. It has been shown that speakers may signal this using verbal prosody (Brennan & Williams, 1995; Smith & Clark, 1993). For instance, a response to the question “Who wrote Hamlet?” might be “[pause] uh Shake-speare?” where the delay signals a prolonged memory search, and the Wller and the high (question-like) intona-tion both signal relatively low conWdence from the meta-cognitive monitoring component.
In this paper, we have described two experiments which extend these observations into the visual domain, showing that there are clear visual cues for a speaker’s feeling of knowing and that listeners are better capable to estimate their feeling of another’s knowing on the basis of combined auditory and visual information than on the basis of auditory information alone. In the Wrst experiment we used Hart’s (1965) paradigm to elicit speaker utterances plus their accompanying FOK scores. The data collected in this way were analyzed in terms of a number of audiovisual cues. This analysis conWrmed earlier work by Smith and Clark (1993) and
Brennan and Williams (1995) in that low FOK answers are typically longer than high FOK answers, and tend to contain more marked auditory cues (Wllers, longer delay, and high intonation). Interestingly, we found that the visual features show a comparable pattern. Focus-sing Wrst on answers, we found that marked facial expressions (diverging from the ‘neutral’ face) such as smiles, gaze acts, eyebrow movements, and ‘funny faces’ are more likely to occur in low than in high FOK answers. In general, when a speaker gives a high FOK answer to a question, this response is produced in a straightforward way, and marked audiovisual cues are not produced. When a speaker is uncertain of the answer or has diYculty retrieving it, however, various things may happen in parallel; low FOK answers tend to require a longer search, which may trigger a Wller, but may also be accompanied by various gaze acts. Both W ll-ers and gaze acts tend to occur during memory search, before the actual answer is uttered. The gazing might Table 8
FOAK scores (and SE) for high FOK and low FOK stimuli for answers and non-answers
partly be explainable from the common observation that it is easier to ‘think’ when not looking at a commu-nication partner. We found that gazing typically occurred in various directions both along the left-right and up-down axis; in these data no single gaze act appeared to fulWl a designated function. That a speaker is uncertain about the correctness of a retrieved answer can be indicated auditorily, via a rising, question-like intonation, but also visually, for instance, by raising the eyebrows (which has been interpreted as the visual counterpart to a rising intonation, see, e.g., Bolinger, 1985). Similarly, the presence of a ‘funny face’ (often, but not always, timed immediately after the answer has been uttered) was also typically associated with a lower FOK score, clearly functioning as a cue for speaker uncertainty. Smiles, however, appeared to be more ambiguous in this respect as some of our speakers smiled when they were asked an ‘easy’ question for which they had no diYculty retrieving the answer, while others smiled in response to questions they considered ‘extremely’ diYcult or for which they felt they should know the answer.
The earlier studies by Smith and Clark (1993) and
Brennan and Williams (1995) revealed an asymmetry between answers and non-answers in that low FOK answers look similar to high FOK non-answers (in both cases the speaker is uncertain on a meta-cognitive level) and that high FOK answers look similar to low FOK non-answers, both in prosodic terms (in both cases the speaker is certain). The current experiment conWrmed this asymmetry, and extended it into the visual realm. Thus, the presence of smiles, brow movements, gaze acts, and a funny face is less likely for high FOK answers and for low FOK non-answers. Data sparseness presumably resulted in less signiWcant eVects for the non-answers than for the answers (in addition, non-answers are lexi-cally more similar than answers and are perhaps inher-ently less likely to end on a high boundary tone).
In the second experiment, participants watched speaker utterances in one of three conditions (Sound only, Vision only, and Vision + Sound) and had to judge the speaker’s FOK. It turned out that overall partici-pants are good at estimating the FOK of other speakers, where the resulting FOAK scores are somewhat more accurate for answers (high FOK answers receive high FOAK scores and low FOK answers receive low FOAK scores) than for non-answers. Interestingly, FOAK judg-ments are signiWcantly more accurate in the bimodal (Vision + Sound) condition than in the respective unimo-dal ones. This indicates that the presence of visual infor-mation is actually beneWcial for FOAK judges. If we compare the results for the Sound only and the Vision only experiment, it appears that overall subjects made better use of auditory than of visual cues for the percep-tion of uncertainty. In terms of multisensory perceppercep-tion, the relative dominance of auditory cues for FOK
percep-tion appears to be similar to the role of auditory cues for information presentation.
However, it should be noted that visual expressions such as funny faces and eyebrow movements occurred relatively infrequently in the second experiment, but when they did occur they seem to oVer a very strong cue for FOAK estimations. Based on this observation we recently performed an additional perception experi-ment, consisting only of incongruent stimuli combining low FOK facial expressions (funny faces) with high FOK speech prosody and vice versa. Participants were asked how certain the speaker appeared in his or her response. The results indicate that for these incongru-ent stimuli the facial expression in most cases has the largest impact on the FOAK score, which is compara-ble to the aforementioned multisensory perception results for emotion.
Acknowledgments
This research was conducted as part of the VIDI-project “Functions of Audiovisual Prosody (FOAP),” sponsored by the Netherlands Organisation for Scien-tiWc Research (NWO), see foap.uvt.nl. Swerts is also aYliated with the Flemish Fund for ScientiWc Research (FWO-Flanders) and Antwerp University. Krahmer’s work was carried out within the IMIX project “Interac-tive Multimodal Output Generation” (IMOGEN), sponsored by the Netherlands Organisation for Scien-tiWc Research (NWO). Many thanks to Judith Schrier (Antwerp) and Jorien Scholze (Tilburg) for their help in carrying out the experiments. Many thanks also to Pashiera Barkhuysen and Lennard van de Laar for help with the annotation and for technical assistance, to Annemarie Krahmer-Borduin, Per van der Wijst, and Carel van Wijk for help with the statistics and the test questions, and to the three anonymous reviewers for their useful comments on a previous version of the manuscript.
Appendix A
English translations of the Dutch questions used in the Wrst experiment, as they were presented to participants in one of the two random orders.
1. What do we call the sticks used in golf? 2. Who made the drawings for “Jip and Janneke”? 3. The sahara lies in which continent?
4. Which novel about a knight is the most reprinted book after the Bible?
5. How many months does it take the moon to circle the earth?
7. What is the largest mammal?
8. What is the name of the gang of robbers that terrorized Limburg in the 18th century?
9. Who, according to legend, was the bishop of Myra? 10. In which Dutch quiz show are the contestants awarded
with a toy monkey for each good answer? 11. What is the highest mountain of the Alps? 12. Who wrote Faust?
13. What is the chemical symbol of water? 14. What does the word ‘Jihad’ mean?
15. What color of light is used on the starboard side of a boat?
16. What is Rembrandt’s last name?
17. Which television series is about the Forrester and Spec-tra families?
18. Guide Gezelle was a famous man. What was his occupa-tion?
19. What is the boiling temperature for water?
20. In which wind-direction does one travel from Amster-dam to Brussel?
21. What is the name of the cartoon character who owns the dog Pluto?
22. Egypt lies in which continent?
23. Who is the head of state of the Vatican? 24. Who wrote “The discovery of heaven”? 25. What is a “Friese doorloper”? 26. Brazil lies in which continent?
27. What is the pseudonym of the Mexican Don Diego de la Vega?
28. Who wrote Hamlet?
29. Which rocker is also known as “The King”?
30. How many darts is a player allowed to throw in one turn? 31. In which wind-direction does one travel from London to
Berlin?
32. Which disease was known during the Middle Ages as “The Black Death”?
33. What is the capital of Switzerland?
34. Supporters of which football club sing “Geen woorden maar daden”?
35. How many degrees are in a circle?
36. Approximately, how many people live in the Nether-lands and Belgium?
37. In which country did the Incas live?
38. Which person from the Bible went to look for mustard? 39. Which Dutch soap series has been running on television
for the longest period? 40. Who wrote the Iliad?
References
Andersen, J. (1999). Cognitive psychology and its implications (5th ed). London: Worth Publishing.
Argyle, M., & Cook, M. (1976). Gaze and mutual gaze. Cam-bridge: Cambridge University Press.
Barkhuysen, P., Krahmer, E., & Swerts, M. (2005). Problem detection in human-machine interactions based on facial expressions of users. Speech Communication, 45, 343–359. Benoît, C., Guiard-Marigny, T., Le GoV, B., & Adjoudani, A.
(1996). Which components of the face do humans and machines best speechread?. In D. Stork & M. Hennecke (Eds.),
Speechreading by humans and machines: Models, systems, and applications (pp. 315–328). New York: Springer-Verlag. Bolinger, D. (1985). Intonation and its parts. London: Edward
Arnold.
Brennan, S. E., & Williams, M. (1995). The feeling of another’s knowing: prosody and Wlled pauses as cues to listeners about the metacognitive states of speakers. Journal of Mem-ory and Language, 34, 383–398.
Bugenthal, D., Kaswan, J., Love, L., & Fox, M. (1970). Child versus adult perception of evaluative messages in verbal, vocal, and visual channels. Developmental Psychology, 2, 367–375.
Clark, H. (1996). Using language. Cambridge: Cambridge Uni-versity Press.
Clark, H., & Fox Tree, J. (2002). Using uh and um in spontane-ous speech. Cognition, 84, 73–111.
Clark, H., & Krych, M. (2004). Speaking while monitoring addressees for understanding. Journal of Memory and Lan-guage, 50, 62–81.
Cruttenden, A. (1986). Intonation. Cambridge: Cambridge Uni-versity Press.
de Gelder, B., & Vroomen, J. (2000). The perception of emo-tions by ear and by eye. Cognition and Emotion, 14(3), 289– 311.
Ekman, P. (1979). About brows: Emotional and conversational signals. In M. von Cranach, K. Foppa, W. Lepenies, & D. Plog (Eds.), Human ethology (pp. 169–202). Cambridge: Cambridge University Press.
Ekman, P. (1999). Facial expressions. In T. Dalgleish & T. Power (Eds.), The handbook of cognition and emotion (pp. 301–320). Sussex, UK: John Wiley & Sons Ltd.
Ekman, P., & Friesen, W. V. (1978). The facial acting coding sys-tem. Palo Alto: Consulting Psychologists’ Press.
Farah, M.J. (2000). The neural bases of mental imagery. In M. Gazzaniga (Ed.), The cognitive neurosciences (2nd ed.). (pp. 965–974). Cambridge: MIT Press.
Frick-Horbury, D. (2002). The use of hand gestures as self-gen-erated cues for recall of verbally associated targets. Ameri-can Journal of Psychology, 115, 1–20.
Gale, C., & Monk, A. (2000). Where am I looking? The accuracy of video-mediated gaze awareness. Perception & Psycho-physics, 62, 586–595.
Geluykens, R. (1987). Intonation and speech act type. An exper-imental approach to rising intonation in declaratives. Jour-nal of Pragmatics, 11, 483–494.
Glenberg, A., Schroeder, J., & Robertson, D. (1998). Averting gaze disengages the environment and facilitates remember-ing. Memory & Cognition, 26, 651–658.
GoVman, E. (1967). Interaction ritual: Essays on face to face behavior. Garden City, NY: Doubleday.
Goodwin, M. H., & Goodwin, C. (1986). Gesture and copartici-pation in the activity of searching for a word. Semiotica, 62, 51–75.
GriYn, Z. (2001). Gaze durations during speech reXect word selection and phonological encoding. Cognition, 82, 1–14. Hart, J. T. (1965). Memory and the feeling-of-knowing
experi-ence. Journal of Educational Psychology, 56, 208–216. Hess, U., Kappas, A., & Scherer, K. (1988). Multichannel
Jameson, A., Nelson, T. O., Leonesio, R. J., & Narens, L. (1993). The feeling of another person’s knowing. Journal of Memory and Language, 32, 320–335.
Jordan, T., & Sergeant, P. (2000). EVects of distance on visual and audio-visual speech recognition. Language and Speech, 43(1), 107–124.
Keating, P., Baroni, M., Mattys, S., Scarborough, R., Alwan, A., & Auer, E., et al. (2003). Optical phonetics and visual per-ception of lexical and phrasal stress in English. In Proceed-ings of the International Conference of Phonetic Sciences (ICPhS) (pp. 2071–2074), Barcelona, Spain.
Kendon, A. (1994). Do gestures communicate? A review. Research on Language and Social Interaction, 27, 175–200. Kikyo, H., Ohki, K., & Miyashita, Y. (2002). Neural correlates
for feeling-of-knowing: An fMRI parametric analysis. Neu-ron, 36(1), 177–186.
Kohlrausch, A. & van de Par, S. (2005). Audio-visual interac-tion In Blauert, J. (Ed.), Communicainterac-tion acoustics. Heidel-berg: Springer (in press).
Koriat, A. (1993). How do we know what we know. The accessi-bility account of the feeling of knowing. Psychological Review, 100, 609–637.
Krahmer, E., & Swerts, M. (2004). More about brows. In ZS. Ruttkay & C. Pelachaud (Eds.), From brows to trust: Evalu-ating embodied conversational agents (pp. 191–216). Dordr-echt: Kluwer Academic Press.
Krauss, R., Chen, Y., & Chawla, P. (1996). Nonverbal behavior and nonverbal communication: What do conversational hand gestures tell us. Advances in Experimental Social Psy-chology, 28, 389–450.
Kraut, R., & Johnson, R. (1979). Social and emotional messages of smiling. An ethological approach. Journal of Personality and Social Psychology, 37, 1539–1553.
Ladd, D. R. (1996). Intonational phonology. Cambridge: Cam-bridge University Press.
Lawrence, B., Myerson, J., Ooknk, H., & Abrams, R. (2001). The eVects of eye and limb movements on working memory. Memory, 9, 433–444.
Massaro, D., & Egan, P. (1996). Perceiving aVect from the voice and the face. Psychonomic Bulletin and Review, 3, 215–221.
McGurk, H., & MacDonald, J. (1976). Hearing lips and seeing voices. Nature, 264, 746–748.
McNeill, D. (1992). Hand and mind: What gestures reveal about thought. Chicago: Chicago University Press.
Mehrabian, A., & Ferris, S. (1967). Inference of attitudes from nonverbal communication in two channels. Journal of Con-sulting Psychology, 31, 248–252.
Morgan, B. (1953). Question melodies in American English. American Speech, 2, 181–191.
Morsella, E., & Krauss, R. (2004). The role of gestures in spatial working memory and speech. The American Journal of Psy-chology, 117, 411–424.
Munhall, K., Jones, J., Callan, D., Kuratate, T., & Vatikiotis-Bateson, E. (2004). Visual prosody and speech intelligibility. Psychological Science, 15, 133–137.
Nelson, T. (1996). Consciousness and metacognition. American psychologist, 51, 102–116.
Reder, L., & Ritter, F. (1992). What determines initial feeling of knowing? Familiarity with question terms, not with the answer. Journal of Experimental Psychology: Learning, Memory and Cognition, 18, 435–452.
Sabbagh, M., & Baldwin, D. (2001). Learning words from Knowledgeable versus Ignorant Speakers: Links between preschoolers’ Theory of Mind and Semantic Development. Child Development, 72(4), 1054–1070.
Smith, V. L., & Clark, H. H. (1993). On the course of answer-ing questions. Journal of Memory and Language, 32, 25– 38.
Srinivasan, R., & Massaro, D. (2003). Perceiving prosody from the face and voice: Distinguishing statements from echoic questions in English. Language and Speech, 46, 1–22. Sumby, W., & Pollack, I. (1954). Visual contribution to speech
intelligibility. Journal of the Acoustical Society of America, 26, 212–215.
Swerts, M., & Krahmer, E. (2004). Congruent and incongruent audiovisual cues to prominence. In Proceedings of Speech Prosody (pp. 271–274), Nara, Japan.