Terakreditasi B SK Dikti No: 43/DIKTI/Kep/2008 DOI: 10.5398/medpet.2011.34.2.99
INTRODUCTION
Breed characterization of indigenous animal is the initial approach to a sustainable use of its animal genetic resource (Lanari et al., 2003). Despite the modernization
of agriculture, Minahasa local horse, in North Sulawesi plays an important role in the rural area. The horses are
Morphometric Characterization of Minahasa Horse for
Breeding and Conservation Purposes
B. J. Takaendengana, b, #, *, R. R. Noorc, #, & S. Adiania
aDepartment of Animal Production and Breeding Technology, Faculty of Animal Science, Sam Ratulangi University Manado, North Sulawesi, Manado 95115, Indonesia
bDepartment of Animal Production and Technology, Graduate School, Bogor Agricultural University cDepartment of Animal Production and Technology, Faculty of Animal Science, Bogor Agricultural University
#Jln. Agatis, Kampus IPB Darmaga Bogor 16680, Indonesia
(Received 29-10-2010; accepted 20-05-2011)
ABSTRAK
Penelitian ini bertujuan untuk melihat adanya keragaman morfometrik pada populasi kuda Minahasa. Bobot badan dan ukuran-ukuran tubuh diukur pada 505 ekor kuda Minahasa (195 betina & 310 jantan). Deskripsi bentuk dan ukuran tubuh dilakukan terhadap empat subpopulasi kuda lokal yang berada di Kota Tomohon, Kota Manado, Kabupaten Minahasa Selatan, dan Kabupaten Minahasa dengan menggunakan pendekatan analisis multivarian. Metode statistika yang digunakan adalah model linier umum, analisis diskriminan sederhana, dan analisis komponen utama untuk membuat konstruksi pohon kekerabatan. Hasil penelitian menunjukkan bahwa populasi kuda Tomohon mempunyai bobot badan dan ukuran tubuh lebih tinggi daripada subpopulasi kuda di ke-tiga daerah lainnya (Kota Manado, Kabupaten Minahasa Selatan, dan Kabupaten Minahasa). Faktor pembeda utama kuda lokal Minahasa adalah lebar pinggul. Hasil penelitian ini sangat bermanfaat dalam upaya mendukung strategi dasar dalam usaha pemanfaatan dan pengembangan kuda dari sumberdaya yang telah beradaptasi dengan lingkungan lokal setempat.
Kata kunci: morfometrik, kuda minahasa, kekerabatan
ABSTRACT
The objective of this study was to investigate morphometric variation of Minahasa horses. Body measurements and live-weight were taken on 195 mare and 310 stallion of Minahasa horse. A multivariate approach was adopted to provide description of both body shape and body size of four Minahasa local horse populations, i.e. Tomohon, Manado, South Minahasa, and Minahasa. Statistical methods employed in this study were general linear model, simple discriminant analysis, and princi-ple component analysis were used to construct phylogenic trees. The results showed that Tomohon’s horse population had higher body weights and body measurements (P<0.05) than those from three other areas (Manado, South Minahasa, and Minahasa). The hip width is the most discriminant vari-able to determine the differences among Minahasa local horse population. The results support estab -lishment of strategy to promote the use and the development of local adapted horse.
Key words: morphometric, Minahasa horses, phylogenic
mainly used in agriculture, light traction, riding and leisure activities. Recent global strategies include several techniques such as: classifying and accepting a unique genetic resource in a specific area and improving the proper use of the related variety (FAO-AAAS, 1994). In order to differentiate variation in both size and shape, body measurements of animals were used to describe morphological differentiation in large animals (Gilbert et al., 1993; Shahin et al., 1995). Analysis of morphological
traits has currently continued as an ongoing research in the fields of horse breeding and genetics, as well as the * Corresponding author:
investigation of their origin (Komosa & Purzyc, 2009). Yakubu et al. (2005) found that body measurements have
regularly been used as the weights estimation while live weight was measured along with these parameters. Analysis of variance and correlations are extensively used to characterize the phenotypic and genetic relation-ships among body measurement (Dietl et al., 2005). Yet, principal component analysis is a valuable method when physical characteristics are related. Recently, other body measurements and indices estimated from various com-binations of conventional and non-conventional body constraints are also used as indicators of type and func-tion in local animals, not merely provide superior guide to weight prediction (Salako, 2006). As the perspective of both animal genetics and animal improvement, prin-cipal components analyses are considered in clustering traits which possibly used for selection and in studying the interdependence of body size measurements of large animals, including local horses.
Nowadays, interrelationship among body size measurement of horse has not been widely exploited. Consequently, the present study was embarked upon to examine the variation of body measurements of Minahasa local horse and to study the relationship among their body measurement in order to obtain a simple method to describe their variation for genetic and breeding purposes using principal component fac-tor analysis.
MATERIALS AND METHODS
Location of Study
The study was carried out in North Sulawesi province started from June to August 2009. The chosen areas are inhabited by Minahasa horses in large number and distributed at 4 districts, namely Minahasa (H), South Minahasa (S), Tomohon (T) city, and Manado (M) city. Minahasa and Tomohon city are categorized as agriculture region with altitude is 600-700 m above sea level. Meanwhile, South Minahasa, and Manado city are categorized as coastal area.
Experimental Animals
The number of Minahasa local horses that randomly selected in the study was 505 horses (310 males and 195 females). Age was ranged between two and seven years old. The unhealthy and pregnant ones were excluded. Age was primarily determined by dentition as described by Owen & Bullock (2002).
Measured Traits
After the individual age group was confirmed, eleven different body measurements were taken on each horse population. These include: wither height (WH), the distance from the highest point of the processus spi-nalis of the vertebra thoracica to the ground; body length
(BL), measured from distance between the site of pins
(Tuber ischii) to tail drop (tuberositas humeri); chest width
(CW), measured as the distance from left to the right
upper arm (pars cranialis of the tuberculum majus humeri); chest depth (CD), measured as the distance between the highest point of the processus spinalis of the vertebra thoracica to lowest point of chest; heart girth (HG),
mea-sured as body circumference just behind the forelegs; rump height (RH), height of hip; rump length (RL), measured from hips (Tuber coxae) to pins (Tuber ischii); hip width (HW), width of rump/hip (Tuber coxae); face
length (FL), distance from between forelock to the lower lip; collar length (CL), measured from distance between the ear site to the site of pins (Tuber ischii) and face width
(FW), measured as the widest point of the head. Height measurements were assessed by using a graduated mea-suring stick, the length and circumference used a flexible tape, meanwhile calibrated wooden caliper was used for the width measurements. The procedure and anatomical reference points for the respective body measurements with fewer modifications described elsewhere by Salako & Ngere (2002). Pregnant horses data were excluded as sample due to anatomical changes (thoracic size) which can mislead the measurement. Measurements were done by the same person to avoid from human error.
Statistical Analysis
General linear model was used to analyze groups of region and sex’s association. Pearson’s coefficients of correlation (r) among the various morphometric traits were estimated. From the correlation matrix, data were generated for the principal component factor analysis. Principal component analysis according to Everitt et al. (2001) is a method for transforming the variables in a multivariate data set (X1, X2,..., XP) into new variables (Y1, Y2,…, Yp) which are uncorrelated with each other and account for decreasing proportions of the total variance of the original variables defined as:
y1 = a11 x1+ a12 x2+…+ a1pxp y2 = a21 x1+ a22 x2+…+a2pxp yp = ap1 x1+ ap2 x 2+…+appxp
The following indices were calculated from the mean values of body measurements for each area group including the gender group, based on the methods of Alderson (1999):
Weight index (WI) = body length x chest girth x (hip width + chest width)/2
Length index (LI) = body length/wither length Height slope (HS) = wither height/rump height Width slope (WS) = hip width/chest width Depth index (DI) = chest depth/wither height Foreleg length (FL) = wither height - chest depth Balance (B) = (rump length x hip width)/(chest
depth x chest width)
Cumulative index (CI) = (weight/breed average weight) + length index + balance
RESULTS AND DISCUSSION
Morphometric Parameters
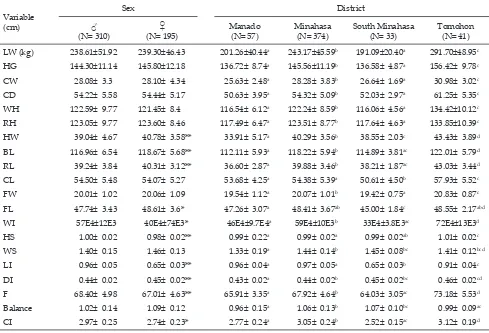
The male horses (122.59±9.77 cm) were slightly taller than female horses (121.45±8.41 cm) (Table 1). The size is almost similar to the body size of pony horses at the same age. The horse population in Tomohon city had the highest size of WH (134.42±10.12 cm), suggested that the horse’s wither height is distinctly differed from those from other localities. Most of the Tomohon sub-population horses were mixed between racehorse breed like thoroughbred and local horse. However, some local
horse populations in Minahasa were speculated that they were originated from the crossing of many breeds for centuries. Noor (2008) affirmed that the adaptation to environment which yielded a fertilized offspring were good to develop as indigenous breeds since the ability to adapt to the specific environmental pressure.
The same phenomena were found for BL, RL, FL measurements and all indices values except for WS and balance scores. Body measurements value showed a considerable high variation in all regions. The RH has a close relationship with the WH measurement. This
suggests that the animal was not sloppy on standing. Meanwhile, the HW and CW values showed that the animal was wider at the rump than at the shoulder. The average WH value across sexes was 121.45±8.4 cm and RH was 123.60±8.5 cm. The female horse was taller at the rump than at the withers. Horses were also wider at the rump (40.78±3.6 cm) than at the chest (28.10±4.3 cm). The descriptions of the populations based on the areas were presented in Table 1. In general the Tomohon horse had significantly higher value of live weight and all body measurements than those of in the other regions. This indicates that the local horses in Tomohon city were big-ger than three others area. There was a large difference between the live weights of horses from high and low altitude areas. The population that lived in higher alti-tude has bigger body size than the population in lower altitude. Considering quite a few measurements (HG, WH, RH, and FW), the horse from Manado and South Minahasa has similar body size measurement. Large body measurement variation indicates the absence of selection, and could be due to the influence of different environment. Specifically, the head length measurement exhibits very little variation because of its close asso-ciation with cranial bone. The high variability shown by
Note: Means in the same rows with different superscript differ significantly (P<0.05); (*)= significantly different (P<0.05); (**)= significantly different (P<0.01). E= exponential; cv= coefficient of variation (%); LW= live weight; HG= heart girth; CW= chest width; CD= chest depth; WH= wither height; RH= rump height; HW= hip width; BL= body length; RL= rump length; CL= collar length; FW=face width; FL= face length; WI= weight index; HS= height slope; WS= width slope; LI= length index; DI= depth index Fl= foreleg index; CI= cumulative index; ♀= female horse/ mare and ♂= male horse/ stallion.
Variable (cm)
Sex District
♂
(N= 310) (N= 195)♀ Manado(N= 57) Minahasa(N= 374) South Minahasa(N= 33) Tomohon(N= 41)
LW (kg) 238.61±51.92 239.30±46.43 201.26±40.44a 243.17±45.59b 191.09±20.40a 291.70±48.95c
HG 144.30±11.14 145.80±12.18 136.72± 8.74a 145.56±11.19b 136.58± 4.87a 156.42± 9.78c
CW 28.08± 3.3 28.10± 4.34 25.63± 2.48a 28.28± 3.83b 26.64± 1.69a 30.98± 3.02c
CD 54.22± 5.58 54.44± 5.17 50.63± 3.95a 54.32± 5.09b 52.03± 2.97a 61.25± 5.35c
WH 122.59± 9.77 121.45± 8.4 116.54± 6.12a 122.24± 8.59b 116.06± 4.56a 134.42±10.12c
RH 123.05± 9.77 123.60± 8.46 117.49± 6.47a 123.51± 8.77b 117.64± 4.63a 133.85±10.39c
HW 39.04± 4.67 40.78± 3.58** 33.91± 5.17a 40.29± 3.56b 38.55± 2.03c 43.43± 3.89d
BL 116.96± 6.54 118.67± 5.68** 112.11± 5.93a 118.22± 5.94b 114.89± 3.81ac 122.01± 5.79d
RL 39.24± 3.84 40.31± 3.12** 36.60± 2.87a 39.88± 3.46b 38.21± 1.87ac 43.03± 3.44d
CL 54.50± 5.48 54.07± 5.27 53.68± 4.25a 54.38± 5.39a 50.61± 4.50b 57.93± 5.52c
FW 20.01± 1.02 20.06± 1.09 19.54± 1.12a 20.07± 1.01b 19.42± 0.75a 20.83± 0.87c
FL 47.74± 3.43 48.61± 3.6* 47.26± 3.07a 48.41± 3.67ab 45.00± 1.84c 48.55± 2.17abd
WI 57E4±12E3 40E4±74E3* 46E4±9.7E4a 59E4±10E3b 33E4±3.8E3ac 72E4±13E3d
HS 1.00± 0.02 0.98± 0.02** 0.99± 0.22a 0.99± 0.02a 0.99± 0.02ab 1.01± 0.02c
WS 1.40± 0.15 1.46± 0.13 1.33± 0.19a 1.44± 0.14b 1.45± 0.08bc 1.41± 0.12bcd
LI 0.96± 0.05 0.65± 0.03** 0.96± 0.04a 0.97± 0.05a 0.65± 0.03b 0.91± 0.04c
DI 0.44± 0.02 0.45± 0.02** 0.43± 0.02a 0.44± 0.02b 0.45± 0.02bc 0.46± 0.02cd
F 68.40± 4.98 67.01± 4.63** 65.91± 3.35a 67.92± 4.64b 64.03± 3.05ac 73.18± 5.53d
Balance 1.02± 0.14 1.09± 0.12 0.96± 0.15a 1.06± 0.13b 1.07± 0.10bc 0.99± 0.09ac
CI 2.97± 0.25 2.74± 0.23* 2.77± 0.24a 3.05± 0.24b 2.52± 0.15ac 3.12± 0.19d
the large standard deviation values associated with the measurements can also be a reflection of wide disparity among the sample size which can not identified yet.
The low to medium coefficients of variation ob-served in all quantitative traits in both sexes and regions are attributable to the environmental sensitivity such as nutrition related conditions and temperature. Large variations within certain measurements suggest absence of selection. Sex influenced (P<0.05) the HW, BL, RL and FL measurements. Similarities between the body mea-surements of males and females have been reported in cattle (Salako & Ngere, 2002).
Morphometric Indices
The mare had values of WS, DI, and Balance while for WI, LI, HS, FL, and CI stallion had higher values (Table 1). Based on the HS index the stallion is higher in the posterior area than mare. WS value describe that mare is narrower than stallion. In this case the CI appears more realistic because it takes more param-eters into consideration more than other. Comparing the 4 regions, it can be concluded that the population in Tomohon city has the highest values of WI, HS, DI, FL, and CI. The South Minahasa population showed narrower at the fore quarter then the hind, longer and more balance bodies than three other populations based
on the WS, LI, and Balance indices. HS index indicate the horses in Tomohon are relatively sloppier than the horses in Manado, Minahasa, and South Minahasa.
Based on the calculated index the horses from Tomohon were generally has long legged and longer bodied. Phenotypically the horse is more look like race-horses. Furthermore, the horse from Manado and South Minahasa had the body proportion of working animals. The WS and LI are useful parameters for estimating balance, and could be important in the assessment of functionality. Based on this study, the WS differential in-dicated that the most of Minahasa local horses are typi-cal mild draught horse. The body form (type, structure, and proportion) supposed to be ideal parameter for the productive animals (Salako, 2006).
Canonical Analysis
The results of canonical analysis in Table 2 showed that the most discriminant variable was HW= 0.93. Other body measurements were not use as discriminate factor to all Minahasa horse populations. Mansjoer et al. (2007)
reported that a lower number obtained from canonical analysis cannot be used as discriminate variables for horse populations.
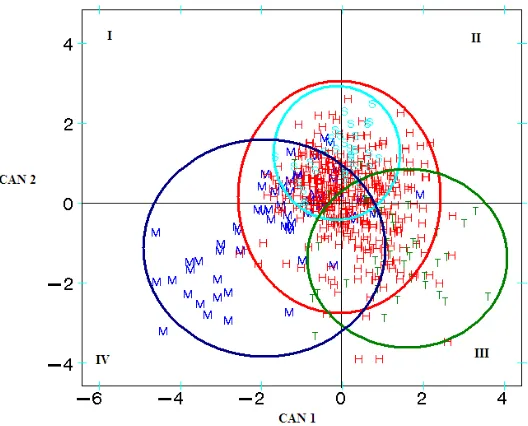
Cluster analysis in Figure 1 showed that in general the body measurements in three populations (Manado,
Note: LW= live weight; HG= heart girth; CW= chest width; WH= withers height; RH= rump height; CD= chest depth; HW= hip width; BL= body length; HL= hip length; CL= collar length; FW= face width; FL= face length; Var=variable; Can 1= morphometric related to body measurement; Can 2= morphometric related to body dimension.
Var LW WH BL HG CW CD RH HW HL CL FW FL
Can 1 0.68 0.64 0.65 0.63 0.54 0.67 0.61 0.93 0.68 0.24 0.44 0.19 Can 2 -0.55 -0.62 -0.17 -0.46 -0.27 -0.50 -0.52 -0.04 -0.28 -0.49 -0.39 -0.27
Table 2. The total canonical structures
Table 3. Eigen values and share of total variance along with 1st, 2nd and 3rd factors loading after rotation of the body measurements of
Note: Extraction method: Principal Component Analysis; N=factor; c= component; v= variance (%); E= Eigen value; LW= live weight; HG= heart girth; CW= chest width; WH= withers height; RH= rump height; CD= Chest Depth; HW= hip width; BL= body length; HL= hip length; CL= collar length; FW= face width; FL= face length; ♀= female horse/ mare and ♂= male horse/ stallion.
Tomohon, and South Minahasa) were mixed with Minahasa horses. The Minahasa horses were placed at the center of quadrants, while the Manado horse was situated outside for quadrant four and Tomohon sub-population at quadrant three. Clearly, the Minahasa horses are probably the common local horse population. It is also possible that the Manado and Tomohon sub-populations were mixed with other groups.
Principal Component Matrix
The variables which have the closest association with main factor were BL, RH, RL, WH CD, and HG represent 53.5%–69.1% of the variance in the body measurements. These variables tended to describe the main body size measurement (Table 3). Fumio et al.
(1982) and Hammock & Shrode (1986) reported that
the first principal component was a measure of overall size in Japanese black cattle performance in beef cattle. Karacaoren & Kadarmideen (2008) and Sadek et al. (2006) also reported that the first factor show the high-est variation (54.8%–70.0%). The second factor describes 8.2% to 13.1% of the total variance of FL, FW, and CL. Conformation characters are good traits for selection and genetic evaluation. Body dimensions have been used to identify breed, origin, and relationship through the medium of head measurements or to indentified size and body shapes measured could improve selection for growth by enabling the breeder to recognize early ma-turing and late mama-turing animals based on the different body size measurements (Salako & Nbera, 2002). The two factors could be used to select animals based on a group of variables rather than on separated traits.
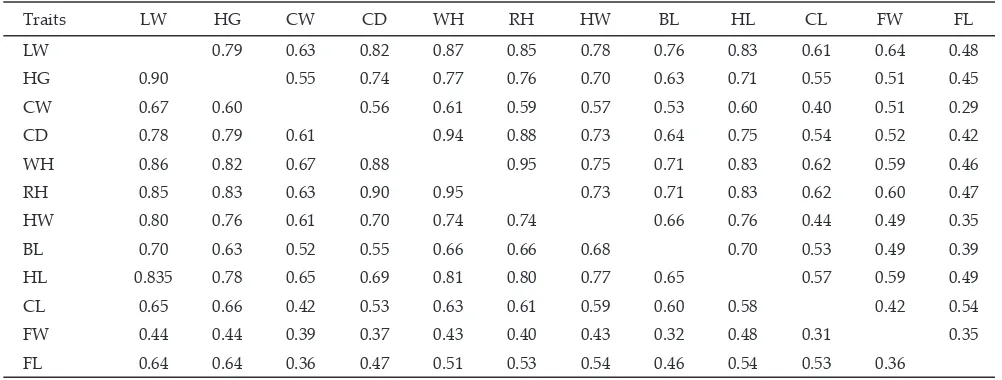
Table 4. Coefficients of correlation of the morphometric characters of Minahasa horse population
Traits LW HG CW CD WH RH HW BL HL CL FW FL
HL 0.835 0.78 0.65 0.69 0.81 0.80 0.77 0.65 0.57 0.59 0.49
CL 0.65 0.66 0.42 0.53 0.63 0.61 0.59 0.60 0.58 0.42 0.54
FW 0.44 0.44 0.39 0.37 0.43 0.40 0.43 0.32 0.48 0.31 0.35
FL 0.64 0.64 0.36 0.47 0.51 0.53 0.54 0.46 0.54 0.53 0.36
Phenotypic Correlations
Pearson’s coefficients of correlation among the vari-ous traits are presented in Table 4. Positive and highly significant (P<0.05/0.01) correlation among the ments suggests high predictability among the measure-ments although this was not tested. The coefficient ranged from 0.31 (FW/CL) to 0.95 (WH/RH) for the fe-male body size and from 0.29 (HL/HG) to 0.95 (WH/RH) for male. Correlation analysis of the morphostructure in-dices exposed strong association between all body mea-surements and weight index for both male (0.46-0.92) and female (0.25-0.90). Most of the variable pairs were significantly (P<0.05) and positively correlated. Wither height was closely correlated with rump height. Positive correlation was found among parameters measured and body weight. Conversely, the head dimension shown a moderate associated.
CONCLUSION
The cumulative index (CI) is suitable as an indicator of function, while the hip width (HW) is the appropri-ate variable to determine the differences of all Minahasa local horse populations. More importantly, there is a positive correlation between several body measurements and body weight.
REFERENCES
Alderson, G. L. H. 1999. The development of a system of linear
measurements to provide an assessment of type and fuc
-tion of beef cattle. AGRI 25: 45-55.
Dietl, G., S. Hoffmann, & N. Reinsch. 2005. Impact of trainer
and judges in the mare performance test of warm blood horses. Arch Tierz Dummerstorf. 48: 113-120.
Everitt, B. S., S. Landau, & M. Leese. 2001. Cluster Analysis. 4th
ed. Arnold Publisher, London.
FAO-AAAS (Food and Agriculture Organization-American Association for the Advancement of Science). 1994.
Implication in the Convention on Biological Diversity-Management of Animal Genetic Resources and the Conservation of Domestic Animal Diversity. Strauss, M. S. (Ed). Washington DC.
Fumio, M., N. Hideaki, & F. Toyokazu. 1982. Application
of principal component analysis for defining size and shape in Japanese black cattle sires. The Sciencereports of Faculty of Agriculture, KobeUniversity. 15:169-176.
Gilbert, R. P., D. R. C. Bailey, & N. H. Shannon. 1993. Linear
body measurements of cattle before and after 20 years of selection for post-weaning gain when fed two different diets. J. Anim Sci.71: 1712-1720.
Hammock, S. P. & R. R. Shrode. 1986. Calfhood weights, body
measurements and measures of fatness versus criteria of overall size and shape for predicting yearling perfor
-mance in beef cattle. J Anim Sci.63: 447-452.
Karacaoren, B. & H. N. Kadarmideen. 2008. Principal compo
-nent and clustering analysis of functional traits in Swiss dairy cattle. Turk. J. Vet. Anim Sci. 32: 163-171.
Komosa, M. & H. Purzyc. 2009. Konik and Hucul horses: A
comparative study of exterior measurements. J. Anim Sci.
87: 2245-2253.
Lanari, M. R., H. Taddeo, E. Domingo, M. P. Centeno, & L. Gallo. 2003. Phenotypic differentiation of exterior traits
in local Criollo goat population in Patagonia (Argentina). Arch. Tierz Dummerstorf. 46: 347-356.
Mansjoer, S. S., T. Kertanugraha, & C. Sumantri. 2007.
Estimasi jarak genetik antar domba Garut tipe tangkas
dengan tipe pedaging. Med Pet. 30: 129-138.
Nei, M., S. Kumar, K. Tamura., & J. Dudley. 2007. Molecular
Evolutionary Genetics Analysis. Center for Evolutionary Fuctional Genomics. Biodesign Institute. Ariszona State University, Arizona.
Noor, R. R. 2008. Genetika Ternak. Edisi ke-4. Penebar
Swadaya, Jakarta.
Owen, R & J. Bullock. 2002. Complete Book of The Horse and
Rider. Hamlyn Pub. Ltd. England.
Sadek, M. H., A. Z. Al-Aboud, & A. A. Ashmawy. 2006. Factor
analysis of body measurements in Arabian horses. J. Anim. Breed Genet.123: 369-377.
Salako, A. E. & L. O Ngere. 2002. Application of multifactorial
discriminant analysis in the morphometric structural dif
-ferentiation of the WAD and Yankasa sheep in the humid southwest Nigeria. Nig. J. Anim. Prod. 29: 163-167.
Salako, A. E. 2006. Application of morphological indices in the
assessment of type and function in sheep. Int. J. Morphol.
24: 13-18.
Shahin, K. A., A. M. Soliman, & A. E. Moukhtar. 1995 Sources
of shared variability for the Egyptian cattle body shape (conformation). Indian J. Anim. Sci.65: 759-764.
Yakubu, A., A. E. Salako, M. Ogah, & M. M. Ari. 2005.