PERFORMANCE ANALYSIS OF FAST AT FOR CORRIDOR AERIAL MAPPING
M. Bl´azquez, I. Colomina
Institute of Geomatics, Av. Carl Friedrich Gauss 11, Parc Mediterrani de la Tecnologia, Castelldefels, Spain [email protected]
KEY WORDS:INS/GNSS, sensor, orientation, method, aerial triangulation
ABSTRACT:
Nowadays most airborne photogrammetric and remote sensing systems are equipped with GNSS receivers and inertial sensors that allow the use of various orientation methods: from Direct Sensor Orientation (DiSO) to Integrated Sensor Orientation (ISO), all the way to “Fast Aerial Triangulation” (Fast AT), a new orientation method recently proposed by the authors of this paper. On the one hand, DiSO is the fastest method. It only needs the INS/GNSS time-position-attitude aerial control information and the previously calibrated system constants as the lever-arm vectors and boresight matrices. On the other hand, ISO is the most accurate and robust orientation and calibration method. It uses all the available information: a large number of image coordinates, some ground control points and the INS/GNSS time-position-attitude aerial control information. Fast AT is a new orientation method that combines the image measurement of few ground control points, the coordinates of these ground control points and the time-position-attitude aerial control information. Fast AT is clearly an alternative to DiSO, even an alternative to ISO depending on project specifications. Our preliminary results with regular blocks indicate that Fast AT performances are closer to the ISO than to the DiSO results. In the light of the good results for block aerial mapping, in this paper we investigate Fast AT performance for corridor aerial mapping: we briefly review the concept, discuss its geometry and analyse its potential for corridor aerial mapping.
1 INTRODUCTION
Today, photogrammetric and remote sensing sensors together with INS/GNSS equipment constitute the common data acquisition configuration for mapping systems. For this reason, Direct Sen-sor Orientation (DiSO) and Integrated SenSen-sor Orientation (ISO), that use the time, position and attitude (tPA) INS/GNSS-derived information have consolidated as the standard methods for sensor orientation and calibration (Schwarz et al., 1993).
In the case of frame cameras, DiSO provides the sensor orienta-tion parameters directly from the INS/GNSS-derived orientaorienta-tion parameters using the previously calibrated INS/GNSS lever arms and IMU-to-camera relative orientation (boresight) matrices. On the other hand, ISO provides the sensor orientation and calibra-tion parameters performing a block adjustment using the INS-/GNSS aerial control information, image coordinates and other available information as ground control points (GCPs). While DiSO is a direct orientation method, ISO is not only an orienta-tion method, but also a sensor and system calibraorienta-tion procedure. DiSO is cheaper and faster than ISO, but ISO is more precise, accurate, robust and reliable (Heipke et al., 2002, Ip et al., 2007).
In (Bl´azquez and Colomina, 2012a) we propose a new orienta-tion method, called “Fast Aerial Triangulaorienta-tion” (Fast AT) that sits halfway between DiSO and ISO. In fact, Fast AT is a particular case of ISO that allows us to orient the sensor and calibrate the system with less information. It consists of the use of image mea-surements of only few GCPs additionally to the INS/GNSS aerial control information. In general, Fast AT is more precise, accu-rate, robust, reliable and expensive than DiSO but less than ISO. In spite of the good results presented in (Bl´azquez and Colom-ina, 2012a), we do not claim that Fast AT replaces DiSO or ISO. It is just a new orientation method that depending on the project specifications can be a good alternative to ISO, for example, if image matching is difficult because of the ill-textured areas, or a good alternative to DiSO if some GCPs are available. Because of the excellent results that validate the Fast AT for block aerial mapping in (Bl´azquez and Colomina, 2012a), we investigate here the use of Fast AT for the corridor mapping application where the geometry is weaker.
In the next section, we review the concept and geometry of the Fast AT method. In the performance analysis section, the test data, the Fast AT corridor geometries and the results are dis-cussed. Last, we present the conclusions of the perfomance of Fast AT for corridor aerial mapping.
2 FAST AT
Fast AT is a particular case of ISO characterized by the use of INS/GNSS-derived position and attitude aerial control, the coor-dinates of few GCPs and its corresponding image coorcoor-dinates. All the tie points (TPs) are GCPs. The idea consists of using less information than in the classical ISO procedure.
Observations Parameters
aerial Sensor GNSS Boresight
ic GCPs control EOs TPs calibration shifts matrix
DiSO no no absolute yes no no no known
Absolute Fast AT only for GCPs few absolute yes only the GCPs no 1×sub-block yes
Relative Fast AT only for GCPs few relative yes only the GCPs no no no
Absolute ISO many few absolute yes many yes 1×sub-block yes
Relative ISO many few relative yes many yes no no
ic: image coordinates; EOs: exterior orientation parameters.
Table 1: Observables and estimable parameters for DiSO, Fast AT and ISO procedures.
The Fast AT geometry is a function of the number, quality and distribution of observations, of the mathematical models in use and of the number and distribution of unknown parameters. Re-lated to the unknown parameters, in (Bl´azquez and Colomina, 2012a) we define a sub-block as the set of images that share a common GNSS linear shift, if the INS/GNSS-derived data is pro-cessed in absolute mode. Equivalenty, if the INS/GNSS-derived data is processed in relative mode, a sub-block is defined as the set of images that are interconnected with relative aerial control observations. Both definitions are consistent. Related to the ob-servations, in (Bl´azquez and Colomina, 2012a) we propose to use of redundant GCPs at the ends of each sub-block and to measure these GCPs in as many images as possible. Therefore, we char-acterize the Fast AT geometry by the number of sub-blocks, the number of strips per sub-block and the number of images per strip, the number of GCPs per sub-block and the number of im-ages where a GCP is observed.
3 PERFORMANCE ANALYSIS
We analyse the performance of Fast AT, absolute Fast AT and relative Fast AT, through the horizontal and vertical ground accu-racy and compare the results with those of DiSO and ISO, abso-lute ISO and relative ISO. The main indicator of our analysis is the Root Mean Square Error (RMSE) of check point (ChP) co-ordinate differences as compared to their pre-surveyed reference values. We compute the RMSE of ChPs in horizontal component, RMSE-H orRH, and vertical component, RMSE-V orRV, as:
R2H=R2E+R2N, and RV =Rh
whereRE,RNandRhare the RMSE of ChPs in the east, north
and height components, respectively.
To simplify the analysis of the RMSE of ChPs obtained by dif-ferent blocks, aerial control modes (absolute and relative), orien-tation methods (DiSO, Fast AT and ISO) and components (hor-izontal and vertical), we define the improvement factor for Fast AT with respect to DiSO as
α= 1−R
whereRISO,RF astATandRDiSOare the ground accuracy mea-sures, horizontal or vertical, for the ISO, Fast AT and DiSO meth-ods, respectively. An improvement factor close to 0% means that Fast AT performs like DiSO, an improvement factor close to 100% means that Fast AT performs like ISO and an improve-ment factor larger than 100% means that Fast AT performs better than ISO.
Additionally, as it was pointed in (Bl´azquez and Colomina, 2012a), we analyse therE,rNandrhcorresponding to the GCP
redun-dancy numbers in the east, north and height components, respec-tively. These values are correlated with the ground accuracy re-sults and provide an indication of weakness in the Fast AT geom-etry.
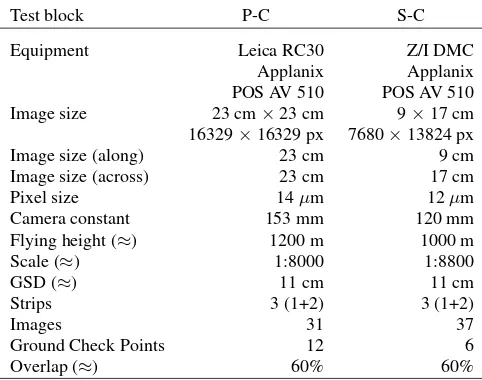
Test block P-C S-C
Equipment Leica RC30 Z/I DMC
Applanix Applanix
POS AV 510 POS AV 510
Image size 23 cm×23 cm 9×17 cm
16329×16329 px 7680×13824 px
Image size (along) 23 cm 9 cm
Image size (across) 23 cm 17 cm
Pixel size 14µm 12µm
Camera constant 153 mm 120 mm
Flying height (≈) 1200 m 1000 m
Scale (≈) 1:8000 1:8800
GSD (≈) 11 cm 11 cm
Strips 3 (1+2) 3 (1+2)
Images 31 37
Ground Check Points 12 6
Overlap (≈) 60% 60%
Table 2: Test blocks: geometric configuration.
ISO Fast AT
Test No. of No. of No. of No. of No. of
block GCPs TPs ic TPs ic
4 282 933×2 4 12×2
No.: number; ic: image coordinates.
Table 3: Test blocks: number of GCPs, image coordinate obser-vations and TPs.
3.1 Test data
This paper is focused in the performance analysis of Fast AT for corridor aerial mapping. Therefore, from two available blocks: Pavia block (P) and Salou block (S) (Bl´azquez and Colomina, 2012b), we generate two corridors: Pavia corridor (P-C) and Sa-lou corridor (S-C), respectively. The Pavia corridor was captured with an analogue Leica RC30 camera and the Salou corridor was captured with a digital large format Zeiss/Intergraph (Z/I) DMC (DMC1-0026) camera. Details on the geometric configuration of the corridors are given in Table 2. Table 3 provides the number of image coordinate observations and TPs for ISO and Fast AT methods, depending on the number of GCPs. Figure 1 and Fig-ure 2 represent the general layout of these corridors and Table 4 details the precision of their observations.
3.2 Fast AT configurations
Block
Table 4: Test blocks: precision of observables.
number of images, strips, sub-blocks, GCPs and image obser-vations of these GCPs. Because of the available Pavia and Salou block data, the Pavia and Salou corridors are composed by 3 flight lines. In the interest areas, there are 7 and 8 available GCPs for Pavia and Salou corridor, respectively. Therefore, the three pos-sible Fast AT geometries of Pavia corridor and Salou corridor are represented in Figure 1 and Figure 2, respectively.
In the case of Pavia corridor, the first flight line is the vertical-left one, FL2, the second flight line is the horizontal one, FL3, and the last flight line is the vertical-right one, FL1. The proposed Fast AT geometries for Pavia corridor are:
– 1 sub-block and 4 GCPS. For absolute Fast AT, it is 1 GNSS linear shift for all images. For relative Fast AT, it is relative orientation interconnecting images of FL2, FL3 and FL1. The GCP configuration is 2 GCPs at the beginning of FL2 and 2 GCPs at the end of FL1.
– 2 sub-blocks and 5 GCPs. For absolute Fast AT, it is 2 GNSS linear shifts: one for the images of FL2 and FL3 and another one for the images of FL1. For relative Fast AT, it is relative orientation interconnecting images of FL2 and FL3. The GCP configuration is 2 GCPs at the beginning of FL2, 1 GCPs in the intersection of FL3 and FL1 (there is only one available GCP in this area) and 2 GCPs at the end of FL1. – 3 sub-blocks and 7 GCPs. For absolute Fast AT, it is 3 GNSS
linear shifts: one for each flight line. For relative Fast AT, this means that there is not relative orientation interconnect-ing images of different flight lines. The GCP configuration is 2 GCPs at the beginning of FL2, 2 GCP in the intersection of FL2 and FL3, 1 GPCs in the intersection of FL3 and FL1 and 2 GPCs at the end of FL1.
In the case of Salou corridor, the first flight line is the oblique one, FL7, the second flight line is the horizontal one, FL5, and the last flown flight line is the vertical one, FL6. The proposed Fast AT geometries for Salou corridor are:
– 1 sub-block and 4 GCPs. For absolute Fast AT, it is 1 GNSS linear shift for all images. For relative Fast AT, it is relative
orientation interconnecting images of FL7, FL5 and FL6. The GCP configuration is 2 GPCs at the beginning of FL7 and 2 GCPs at the end of FL6.
– 2 sub-blocks and 6 GCPs. For absolute Fast AT, it is 2 GNSS linear shifts: one for the images of FL7 and FL5 and another one for the images of FL6. For relative Fast AT, it is relative orientation interconnecting images of FL7 and FL5. The GCP configuration is 2 GCPs at the beginning of FL7, 2 GCPs in the intersection of FL5 and FL6 and 2 GCPs at the end of FL6.
– 3 sub-blocks and 8 GCPs. For absolute Fast AT, it is 3 GNSS linear shifts: one for each flight line. For relative Fast AT, this means that there is not relative orientation interconnect-ing images of different flight lines. The GCP configuration is 2GCPs at the beginning of FL7, 2 GCPs in the intersec-tion of FL7 and FL5, 2 GCPs in the intersecintersec-tion of FL5 and FL6 and 2GCPs at the end of FL6.
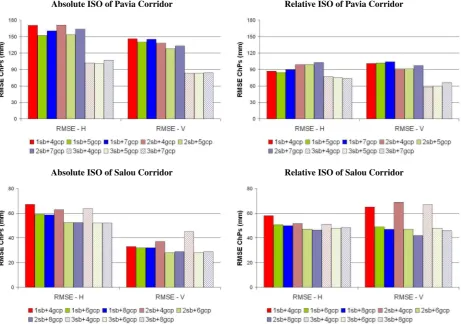
In order to determine which previous proposed geometry is more appropiate for Pavia and Salou corridors, we need to stablish the number of sub-blocks of each corridor. In terms of RMSE of ChPs for horizontal and vertical components, Figure 3 provides the absolute and relative ISO performances of the nine geometries that result from combining the three sub-block configurations by the three GCP configurations. According to the results of this figure, the best geometry of the Pavia corridor is a 3 sub-block corridor, independently of the GCP configuration, and the best geometries of the Salou corridor are a 2 block or a 3 sub-block corridor, independently of the GCP configuration. In the case of Salou corridor, even for ISO, some GCPs in the intersec-tions of different flight lines are advisable.
3.3 Fast AT results for corridor aerial mapping
After the discussion of the previous section 3.2, the selected Fast AT geometry for Pavia corridor is a 3 sub-block configuration and 7 GCPs distributed at the ends of the sub-blocks. On the other hand, in order to minimize the number of estimated parameters, the selected Fast AT geometry for Salou corridor is a 2 sub-block configuration, instead of the possible 3 sub-block configuration. In this case, the GCP configuration is 6 GCPs distributed at the ends of these 2 sub-blocks. Table 5 presents the results of these selected Fast AT geometries in terms of RMSE of ChPs for hori-zontal and vertical components compared to DiSO and ISO per-formance of the same geometries. From the results of this table, if we compute the improvement factors for absolute and relative Fast AT with respect to DiSO of the Pavia and Salou corridors in horizontal and vertical components, we realize that Fast AT performance improves 74% with respect to DiSO performance in average. For components, in the horizontal component the aver-age improvement factor is 80% and in the vertical component the average improvement factor is 68%. On the other hand, the av-erage improvement factor for absolute Fast AT is 69% while the average improvement factor for relative Fast AT with respect to DiSO is 79%.
1 sub-block and 4 GCPs 2 sub-blocks and 5 GCPs 3 sub-blocks and 7 GCPs
❝ images s ❝ photo-measurements s ground control points N check points
Figure 1: Pavia corridor: sub-block and GCP configurations.
1 sub-block and 4 GCPs 2 sub-blocks and 6 GCPs 3 sub-blocks and 8 GCPs
❝ images s ❝ photo-measurements s ground control points N check points
Figure 2: Salou corridor: sub-block and GCP configurations.
Absolute ISO of Pavia Corridor Relative ISO of Pavia Corridor
Absolute ISO of Salou Corridor Relative ISO of Salou Corridor
Absolute aerial control Relative aerial control
Pavia corridor: 3 sub-blocks and 7 GCPs
RMSE - H (mm)
Salou corridor: 2 sub-blocks and 6 GCPs
RMSE - H (mm)
Table 5: RMSE of ChPs of selected P-C and S-C configurations.
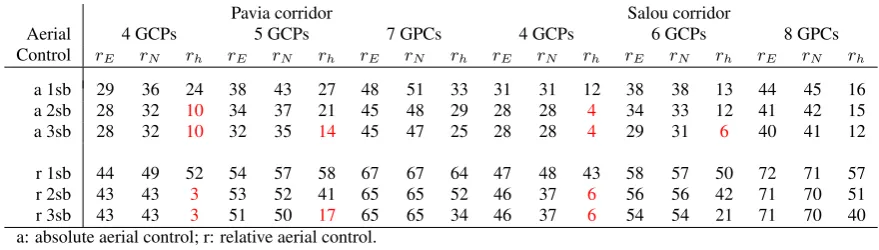
results and as we remark in (Bl´azquez and Colomina, 2012a) and section 3.2, the geometries of 2 or 3 sub-blocks with only 4 GCPs or 3 sub-blocks with less than 8 GCPs are weaker than the se-lected geometries for Fast AT. Moreover, as the GCP redundancy numbers depend on the stochastic model, the GCP redundancy numbers for relative aerial control are higher than for absolute aerial control proving the idea pointed in (Bl´azquez and Colom-ina, 2012b) about the correctness of the stochastic model for rel-ative aerial control. Without a complete study of the corridor Fast AT geometries it is risky to provide thresholds to accept or not a Fast AT configuration from the GCP redundancy numbers. How-ever, in general terms, for absolute and relative Fast AT, it seems that a GCP redundancy number in the height component lower than 20% and 10% for Leica RC30 and Z/I DMC, respectivaly, indicates a weak Fast AT geometry for corridor aerial mapping.
3.4 Fast AT results: corridor vs block aerial mapping
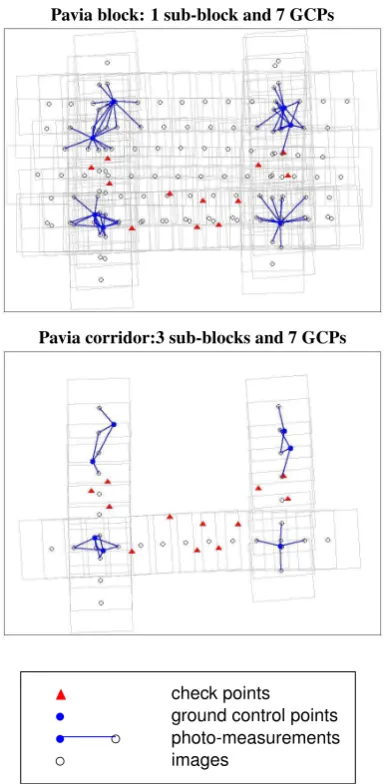
In order to illustrate the performance of the Fast AT method for corridor aerial mapping against the performance of Fast AT method for block aerial mapping, the results of Pavia corridor are com-pared to the results of Pavia block. While the selected geom-etry for the Pavia corridor is a 3 sub-block configuration, the Pavia block geometry is a 1 sub-block configuration (Bl´azquez and Colomina, 2012a). On the other hand, although the GCP configuration is the same for both data sets, the number of im-age coordinates are different: 79×2 image coordinates for Pavia block against 28×2 for Pavia corridor. Figure 4 represents the
configurations of both data sets.
Table 7 provides the ground accuracy results for absolute and rel-ative Fast AT and absolute and relrel-ative ISO for Pavia corridor and Pavia block. If we compare the Pavia block and Pavia corridor re-sults, as it was expected, the RMSE of ChPs of Pavia corridor are worse than the RMSE of ChPs of Pavia block. In average, Pavia block performance improves the Pavia corridor performance by 206%. The Pavia block ground accuracy is 212% and 201% bet-ter than the Pavia corridor ground accuracy for ISO and Fast AT methods, respectively. If we compare now, the DiSO, Fast AT and ISO results, the Fast AT Pavia corridor average improvement
Pavia block: 1 sub-block and 7 GCPs
Pavia corridor:3 sub-blocks and 7 GCPs
❝ images
s ❝ photo-measurements s ground control points N check points
Pavia corridor Salou corridor
Aerial 4 GCPs 5 GCPs 7 GPCs 4 GCPs 6 GCPs 8 GPCs
Control rE rN rh rE rN rh rE rN rh rE rN rh rE rN rh rE rN rh
a 1sb 29 36 24 38 43 27 48 51 33 31 31 12 38 38 13 44 45 16
a 2sb 28 32 10 34 37 21 45 48 29 28 28 4 34 33 12 41 42 15
a 3sb 28 32 10 32 35 14 45 47 25 28 28 4 29 31 6 40 41 12
r 1sb 44 49 52 54 57 58 67 67 64 47 48 43 58 57 50 72 71 57
r 2sb 43 43 3 53 52 41 65 65 52 46 37 6 56 56 42 71 70 51
r 3sb 43 43 3 51 50 17 65 65 34 46 37 6 54 54 21 71 70 40
a: absolute aerial control; r: relative aerial control. sb: sub-block.
Table 6: GCP redundancy numbers (%) of Fast AT for P-C and S-C depending on the sub-block and GCP configurations.
Block Pavia block Pavia corridor
Configuration RH RV RH RV
DiSO 256 242 256 242
Absolute ISO 39 40 107 84
Relative ISO 40 37 74 66
Absolute Fast AT 51 55 88 144
Relative Fast AT 45 63 80 119
Table 7: RMSE (mm) of ChPs of selected Pavia block and Pavia corridor configurations.
factor is 86%, while the average improvement factor of Fast AT Pavia block is 93%. These results are consistent with the con-clusions of (Bl´azquez and Colomina, 2012a) with respect to the performance of Fast AT method for block aerial mapping (Fast AT improves the ground accuracy of DiSO by 90% as compared to ISO) and the conclusions of the previous subsection respect to the performance of Fast AT method for corridor aerial mapping (Fast AT improves the ground accuracy of DiSO by 74% com-pared to ISO).
4 CONCLUSIONS
In this paper we review the concept and geometry of the pro-posed Fast AT orientation procedure and we validate this method for the corridor aerial mapping application. This paper is not an exhaustive study on the geometry and performance of Fast AT for corridor aerial mapping, but it presents the first results for this application.
Fast AT is a particular case of ISO where all the TPs are GCPs and there are few of them; i. e., Fast AT is an ISO adjustment characterized by the use of INS/GNSS-derived position and at-titude, coordinates of few GCPs and image coordinates of these few GCPs. Therefore to perform Fast AT instead of the tradi-tional ISO, the orientation and calibration lines do not need to be modified. The Fast AT practitioners only need to measure less observations.
This simple method was validated in (Bl´azquez and Colomina, 2012a) for block aerial mapping and the results were that Fast AT improved the ground accuracy of DiSO by 90% as compared to ISO. In this paper we test the Fast AT method for corridor aerial mapping with two different corridors and the results are that Fast AT improves the ground accuracy of DiSO by 74%. Although the results for corridor aerial mapping are not so good as the Fast AT results for block aerial mapping, the performance of Fast AT corridor is still excelent. Moreover, as in the case of block aerial mapping the GCP redundancy numbers are correlated with the ground accuracy results and they can be used as a self-diagnosis tool to detect weak Fast AT geometries.
REFERENCES
Bl´azquez, M. and Colomina, I., 2012a. Fast AT: a simple proce-dure for quasi direct orientation. ISPRS Journal of Photogram-metry and Remote Sensing 71(1), pp. 1–11.
Bl´azquez, M. and Colomina, I., 2012b. Relative INS/GNSS aerial control in integrated sensor orientation: models and performance. ISPRS Journal of Photogrammetry and Remote Sensing 67(1), pp. 120–133.
Colomina, I., Bl´azquez, M., Navarro, J. A. and Sastre, J., 2012. The need and keys for a new generation network adjustment soft-ware. In: International Archives of Photogrammetry, Remote Sensing and Spatial Information Sciences, Melbourne, Australia.
Heipke, C., Jacobsen, K. and Wegmann, H., 2002. Integrated sensor orientation: test report and workshop proceedings. In: OEEPE Official Publication, Vol. 43, pp. 31–49.
Ip, A., El-Sheimy, N. and Mostafa, M., 2007. Performance analy-sis of Integrated Sensor Orientation. Photogrammetric Engineer-ing and Remote SensEngineer-ing 73(1), pp. 89–92.
Schwarz, K., Chapman, M., Cannon, M. and Gong, P., 1993. An integrated INS/GPS approach to the georeferencing of remotely sensed data. Photogrammetric Engineering and Remote Sensing 59(11), pp. 1667–1674.
AKNOWLEDGEMENTS