SPECIAL SOFTWARE FOR PLANETARY IMAGE PROCESSING AND RESEARCH
A.E. Zubarev*, I.E. Nadezhdina, N.A. Kozlova, E.S Brusnikin, and I.P. Karachevtseva
Moscow State University of Geodesy and Cartography (MIIGAiK), MIIGAiK Extraterrestrial Laboratory (MExLab), 105064 Moscow, Russian Federation –[email protected]
Commission IV, WG IV/8
KEY WORDS: Special software, Planetary image processing, DEM/DTM, Shape parameters, Surface image modelling
ABSTRACT:
The special modules of photogrammetric processing of remote sensing data that provide the opportunity to effectively organize and optimize the planetary studies were developed. As basic application the commercial software package PHOTOMOD™ is used. Special modules were created to perform various types of data processing: calculation of preliminary navigation parameters, calculation of shape parameters of celestial body, global view image orthorectification, estimation of Sun illumination and Earth visibilities from planetary surface. For photogrammetric processing the different types of data have been used, including images of the Moon, Mars, Mercury, Phobos, Galilean satellites and Enceladus obtained by frame or push-broom cameras. We used modern planetary data and images that were taken over the years, shooting from orbit flight path with various illumination and resolution as well as obtained by planetary rovers from surface. Planetary data image processing is a complex task, and as usual it can take from few months to years. We present our efficient pipeline procedure that provides the possibilities to obtain different data products and supports a long way from planetary images to celestial body maps. The obtained data new three-dimensional control point networks, elevation models, orthomosaics provided accurate maps production: a new Phobos atlas (Karachevtseva et al., 2015) and various thematic maps that derived from studies of planetary surface (Karachevtseva et al., 2016a).
* Corresponding author
1. INTRODUCTION
Ready-made solutions in the field of digital photogrammetric systems do not provide a comprehensive solution to all problems arising in the planetary data processing. Software applications for planetary data processing such as ISIS (Anderson, et al., 2004) and VICAR (Deen, 2015) that are available only for the LINUX OS, sometimes have a closed code, as well as productivity and ergonomic user limitations. Many commercial photogrammetric systems support professional decisions for many tasks, but do not provide ready-to-use solutions for processing of planetary images which have complex geometry, different scales / times of shooting and various illumination conditions. Specially developed photogrammetric modules improve and extend possibilities of professional software and help to solve different technologic and scientific tasks: to estimate the fundamental geodetic parameters of celestial bodies and to establish the basic coordinate systems for accurate mapping; to produce calibrated and projected orthoimages based on images with global view.
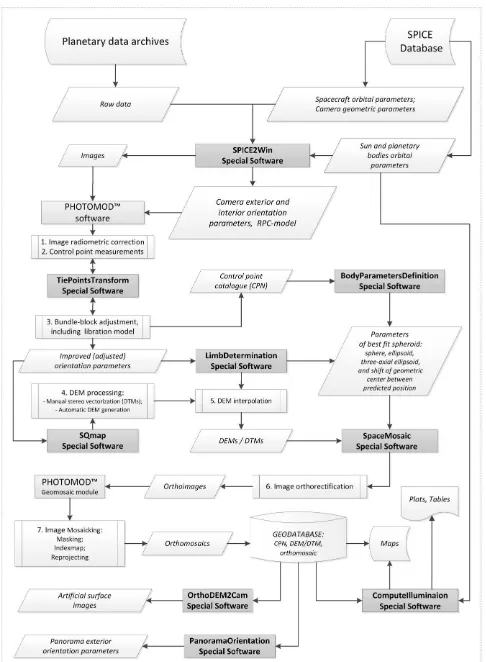
As usual planetary archives like PDS (Planetary Data System) store raw images (PDS Standards Reference, 2009), so for further analysis and cartographic tasks data should be processed, radiometrically calibrated and map projected. Here we present the workflow of planetary image processing that combines many steps and includes various specially developed software modules (Fig.1):
module SPICE2Win provides calculation of the elements of orientation and conversion of raw images to generally used format;
module TiePointsTransform carries out a semi-automatic registration of tie points in images taken at different orientation
and scale, with different illumination conditions and observation geometries;
module LimbDetermination provides measurements of images with global view;
module BodyParametersDefinition calculates best fit spheroid parameters;
module SQmap is used to search for stereo pairs, that provide the ability to create DEM according to the specified conditions of photogrammetric processing for study area;
module SpaceMosaic was developed for processing of images with global view (entire whole body);
module ComputeIlluminaion is used to calculate surface illumination and visibility conditions based on DEM;
module PanoramaOrientation provides determination of elements of orientation of panoramic surface images;
module OrthoDEM2Cam was developed for modelling of artificial surface images based on DEM.
The modules are written in C++ using the Microsoft libraries in dotNetFramework environment, and can be applied as stand-alone applications or additional modules that extend functions of commercial software packages like PHOTOMODTM (Adrov et al., 1995).
2. PRELIMINARY IMAGE PROCESSING
At first step camera navigation parameters should be obtained. For preliminary processing we developed module SPICE2Win as a Windows application which provides (Fig.2):
conversion of raw images from binary PDS-2,3,4 format (*.img) to generally used format (*.tiff);
calculation of preliminary exterior and interior orientation parameters based on SPICE-libraries (http://naif.jpl.nasa.gov/naif/).
Figure 1. The flowchart of photogrammetric image processing of planetary data based on special developed software and techniques. The International Archives of the Photogrammetry, Remote Sensing and Spatial Information Sciences, Volume XLI-B4, 2016
SPICE2Win works with images in central projection (CCD-frame) as well as with push-broom images (CCD-line). The current version of the module supports various sensors: High Resolution Imaging Science Experiment Camera (HiRISE) (McEwen et al., 2007) and Context Camera (CTX) (Malin et al., 2007) on board Mars Reconnaissance Orbiter, Narrow Angle Camera (LROC) on board Lunar Reconnaissance Orbiter (Robinson et al., 2010), High Resolution Stereo Camera (HRSC) and Super Resolution Channel (SRC) on board Mars Express (Jaumann et al., 2007), Cassini Wide Angle Camera (WAC) and NAC (Knowles, 2012), Voyager-1,-2 WAC and NAC cameras (Benesh and Jepsen, 1978), and Galileo solid state imaging subsystem instrument (Belton et al.,1992).
Figure 2. User interface of the module SPICE2Win for calculations of orientation parameters.
Using SPICE database kernels
(http://naif.jpl.nasa.gov/naif/data.html) SPICE2Win module provides spacecraft navigation data (position at the selected time, exterior orientation parameters) and camera elements (interior orientation parameters) combining them to RPC-model (Grodecki and Dial, 2003). Finally, images in TIFF-format, accompanied with orientation parameters as metadata in ready-to-use text format (RPC-model for push-broom images) can be uploaded to any professional system for further processing.
3. BUNDLE-BLOCK ADJUSTMENT
PHOTOMOD software provides radiometric image calibration, tie-point measurements and their adjustment by a least-squares technique. A bundle block adjustment should be carried out to receive the improved image orientation parameters. For this purpose coordinates of tie-points that provide triangulation network covering all images are measured based on semi-automatized correlation method in PHOTOMOD software. The PHOTOMOD implementation of the block adjustment is based on the RPC model, which is characterized by an effectively reduced number of adjustment parameters (6 per image) providing a numerically stable solution (Adrov and Titarov, 2004).
Specialized module TiePointsTransform (Fig.3) provides the possibilities to increase productivity and to decrease the errors of tie-point measurements in case of using oblique view images with different resolution and illumination conditions like Voyager-1,-2 and Galileo images. The bundle block adjustment runs repeatedly to identify, possibly re-measure, to remove
gross outliers after each step (see Zubarev et al., 2016 for details).
Figure 3. User interface of the module TiePointsTransform for optimization of tie-point measurements.
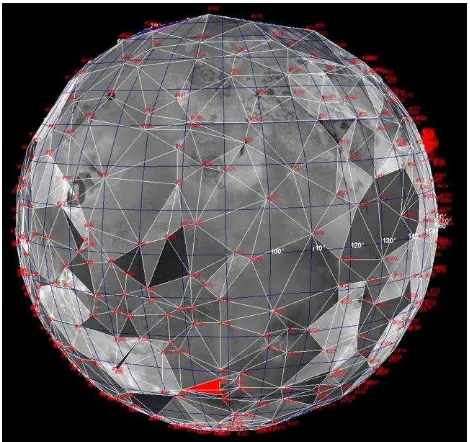
As a result three-dimensional coordinates of tie-points and improved navigation parameters can be obtained. TiePointsTransform module was used for producing new Ganymede control point network (CPN) (Zubarev et al., 2015a), as well as CPNs of other Galilean satellites, for example, for Io (Fig.4) and for Enceladus in Saturn system (Nadezhdina et al., 2016, this issue).
Figure 4. Control point measurements for Galilean satellite Io based on images with various conditions obtained by Voyagers
and Galileo at different time, and preliminary processed in TiePointsTransform module.
4. PLANETARY BODY BASIC GEODETIC PARAMETERS
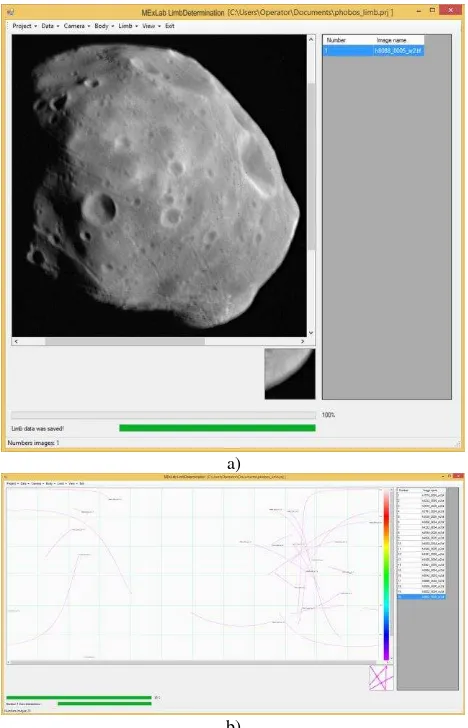
Basic geodetic parameters like shape models are very important for accurate planetary mapping. The data can be obtained based on image processing techniques using two methods: control point and limb measurements. The techniques are difficult tasks due to many reasons: the need in full coverage by images of the whole celestial body; differences in image quality; irregular form or small size of many planetary bodies. Limb data is obtained as profiles measured on images with global view. For automatic limb measurements and their adjustment we The International Archives of the Photogrammetry, Remote Sensing and Spatial Information Sciences, Volume XLI-B4, 2016
implement special developed module LimbDetermination (Fig.5). Limb profiles can be used independently from control point measurements or complement them after adjustment.
a)
b)
Figure 5. User interface of the module LimbDetermination: a) Mars Express-SRC image of Phobos uploaded for measurements; b) limb profiles as results of Phobos image
measurements.
Based on bundle block adjustment of coordinate measurements using limb determination or large numbers of overlapping stereo images basic geodetic parameters can be obtained (Nadezhdina and Zubarev, 2014). BodyParametersDefinition module (Fig.6) was developed to calculate shape parameters (main axis). Based on the adjusted CPNs or limb profiles it allows to find a best fit spheroid and shift of the geometric centre from predicted position.
Figure 6. User interface of the module
BodyParametersDefinition: determination the main axis of one of the Galilean satellite Io.
The input data are three-dimensional coordinates on planetary surface and their accuracy assessment; output file in simple text format contains a table of parameters of the spheroids: size of sphere, ellipsoid, three-axial ellipsoid with the accuracy estimation of each parameter as well as the displacement of the centre of the planetary body within defined coordinate system.
Using BodyParametersDefinition module the updated geodetic parameters of Galilean satellites (Zubarev et al., 2015a), Enceladus (Nadezhdina et al., 2016, this issue) and Phobos (Oberst et al., 2014) were obtained.
5. DEM AND ORTHOMOSAIC PROCESSING
Accurate topographic information is essential for geomorphologic analysis and mapping, but many spacecrafts on planetary orbits have not carried out dedicated stereo imaging; therefore, selection of image pairs with defined requirements (Becker et al., 2015) for generation of detailed topographic models is not a trivial task. To solve this problem, special software that takes into account image stereo quality (SQmap module) was developed (Fig. 7).
Figure 7. User interface of the SQmap module.
As input data can be used improved image exterior and interior orientation parameters, body shape parameters defined by user or derived from BodyParametersDefinition module. If for the study area a global elevation model is already available, it also can be uploaded to the module as additional information. Output file in ASCII-format for vector data and attribute provide footprints of image pairs with suitable stereo parameters that cover the study regions. With the SQmap module, many new stereo pairs were identified for producing digital elevation and terrain models (DEM/DTM), e.g., DTMs for Galilean satellite Ganymede based on Galileo and Voyager-1,2 NAC images (Zubarev et al., 2015b) and DTMs for Mercury using MESSENGER MDIS NAC images (Zharkova et al., 2015).
Stereo images with suitable parameters and preliminary calculated orientation elements (RPC-model) are ready for further processing DEM and orthomosaic generation; for these purposes we use PHOTOMOD software (Fig. 1) step by step: 1) the measurements of the tie-points of the overlapping images (by 25-50 points per stereo pair), 2) the subsequent relative adjustment of the measurements, which allows to determine an error in the position of each of the tie-points; 3) the repeated measurements of the points, where the errors exceed the assumed maximum (2-3 pixels) per stereo pair, and the repeated their adjustment; 4) the formation of improved orientation parameters for each stereo-pairs and their bundle-The International Archives of the Photogrammetry, Remote Sensing and Spatial Information Sciences, Volume XLI-B4, 2016
block adjustment; 5) the automatic or manual measurements of the 3D points and interpolation of elevations; 6) image orthorectification based on the created elevation or terrain model; for frame images, especially with global view, we use SpaceMosaic module (see description below).
PHOTOMOD implementations for topographic modelling are based on standard image matching techniques and algorithms of automatic relief generation by using two different methods (Hirschmuller, 2005): the iterative-deformation technique and semi-global matching. Automatic image correlation and matching can be performed for every pixel in the image to create a dense digital elevation model (DEM), but in case of noisy images it is better to use manual matching based on specific points or lines of surface objects like rim of craters or grooves (Fig.8), to produce terrain model (DTM).
Figure 8. Triangulated Irregular Network generated from manually measured tie-points along structure lines of Mercury
terrain objects (in white box – a studied flat-floor crater). Background: derived DTM with resolution 50 m/pixel and elevation accuracy ±10 m based on MESSENGER MDIS NAC
stereo pair (EN0243797099M, EN0243883525M).
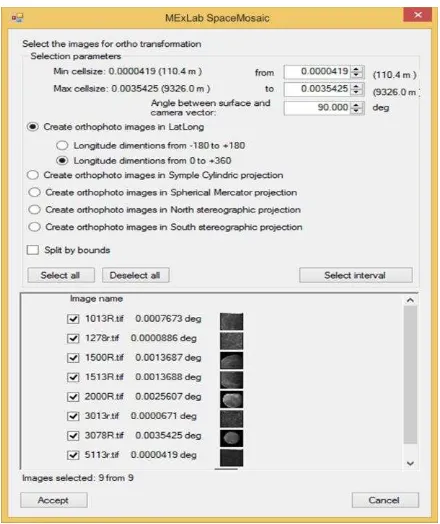
Figure 9. User interface of the SpaceMosaic module implemented for orthorectification of Ganymede images.
Orthorectified images are created using PHOTOMOD Mosaic module upon completion of the DEM/DTM, but this module
cannot support orthorectification of the global view images that covered whole planetary body or hemisphere (see example of global Phobos image on Fig. 5a). Special developed module SpaceMosaic works with CCD-frame images and have extended possibilities of orthotransformation that are not supported in professional software: a) orthorectification of images of entire body; b) “slicing” one orthoimage on the 2 hemispheres; c) support of image orthorectification on three-axial ellipsoid. The input data for SpaceMosaic module are CCD-frame images with adjusted navigation elements, camera parameters, body shape parameters and DEM (Fig.9).
5.1 Applications
High resolution DEMs/DTMs are important instrument for scientific exploration of planetary surface. Following the above presented approach, we processed stereo images of different celestial bodies. Based on obtained topographic data at different level of details quantitative morphometric measurements for analysis of regions of interests are made.
5.1.1 Stereo processing of Mercury data (frame images)
To study Mercury surface we applied DTMs (Fig.8) derived from MDIS NAC images with pixel scale 20 m obtained by MESSENGER (Hash et al., 2012). Using manual matching technique we produced more than 30 DTMs with various resolutions (30-100 m/pixel) and elevation accuracy (±10-50 m) that depends on operator error (0.5-1 pixel) which is influenced by imaging geometry and pixel scale. The DTMs were implemented to estimate the thickness of Mercury regolith (Zharkova et al., 2015) based on measurements of the depth of the flat-floor craters recently identified on Mercury surface (Blewett et al., 2011). Our observations indicate that a 20-40 m thick regolith layer is often present in smooth plains in contrast to thinner (several meters thick) regolith in the lunar maria. Despite the fact that internal precision of the DTMs is comparable to the actual regolith thickness, using topography information is more preferably. The obvious advantage of the photogrammetric elevation data is involvement of explicit topographic information from stereo imaging and the absence of any poorly grounded assumptions.
5.1.2 Stereo processing of Mars data (push-broom images)
MRO HiRiSE images have unprecedently highest resolution (up to 25 cm/pixel) and quality that provided the study of interesting martian phenomena at large scale, for example, slope streaks that have no direct analogs on the Earth. Slope streaks are albedo features on slopes that extend along the topographic gradient and have very sharp edges. Quantitative estimation based on stereo images provides understanding of the mechanisms of slope streaks formation, and thus the climate of Mars. According to (Kreslavsky and Head, 2009) proposed a “wet” mechanism (contrast theory “dry” mechanism supported by Sullivan et al., 2011), the streaks should not form when the subsurface seasonal temperature is below the year-average temperature. To provide slope streaks studies about 20 stereo pairs were processed with generation of 6 DEMs based on HiRiSE images (Fig.10). Based on large series of experiments including more than 1500 measurements it was found that streaks can initiate only on slopes steeper than ~20º (Brusnikin et al., 2016). The results contribute to the documentation of the nature of slope streaks and their environment. Unique spatial database of streaks is currently extended using more measurements on HiRiSE stereo images to The International Archives of the Photogrammetry, Remote Sensing and Spatial Information Sciences, Volume XLI-B4, 2016
support distinguishing between the two mechanisms of formation (“wet” or “dry”).
Figure 10. Portion of HiRiSE DEM generated from stereo pair (PSP_009371_1800, PSP_009516_1800) with automated correlation method implemented in PHOTOMOD to measure
slope streaks (red lines) in crater Nicholson on Mars.
5.1.3 The Moon data stereo processing (push-broom images)
Lunar landing sites as LROC priority targets have been imaged many times, including areas studied by the Soviet rovers (Lunokhods) during two missions (Luna-17 and Luna-21) as well as Apollo sites. Based on about 60 processed LROC NAC images and 6 stereo pairs were generated 2 DEMs to reconstruct and map the traverses and working areas of the Lunokhod-1 (Karachevtseva et al., 2013) and Lunokhod-2 (Karachevtseva et al., 2016b). These results give us not only new insights into previous missions achievements, but provide support for selection of candidate landing sites of future Russian mission Luna-25 (Luna-Glob) to the Moon south polar area (probably, within crater Boguslawsky). To avoid hazard in a shaded polar region a method of estimating the distribution of slopes measured in the images acquired at different solar incidence angles was suggested (Abdrakhimov et al., 2015). This method was calibrated on analog regions in Lunokhod-1 and 2 areas based on the high resolution DEMs and many processed LROC NAC images with various illumination conditions.
6. ILLUMINATION AND VISIBILITY ANALYSIS
The Sun and the Earth visibility from a selected sites as well as parameters of illumination on the planetary surface are need for planning of future missions. To support the calculation of surface illumination and visibility conditions special module ComputeIllumination was developed. Both algorithms are used the SPICE data and DEM for study area. The results are presented in the form of plots and time dependencies accompanied by a description of the local configuration of the horizon line in the vicinity of the point of interest (Fig.11).
To support planning of future missions based on engineering safety criteria (De Rosa et al., 2012) and to provide charging solar panels or communication with Earth, simulation for the investigated terrain for selected site within crater Boguslawsky (72.9°S, 41.3°E) was made using LOLA DEM (LDEM 1024)
with resolution 30 m/pixel
(http://ode.rsl.wustl.edu/moon/productPageAtlas.aspx?product_id =LDEM_1024_75S_60S_030_060&product_idGeo=20762484). The developed software allowed us to model the positions of the Sun and the Earth above the horizon seen from a specified
point in the time period chosen for start of future mission Luna-Glob on November, 2018. In the plot and table (Fig. 11) the trajectory of the Sun during the specified time interval is shown, the sunset and sunrise points are indicated, as well as the position of the Earth. Additionally, the illumination raster maps can be generated to demonstrate shaded surface.
Figure 11. User interface of the ComputeIllumination module with results of Sun illumination and Earth visibility modelling for proposed candidate landing sites of future Russian mission Luna-Glob within crater Boguslawsky (72.9° S, 41.3° E).
7. SURFACE PANORAMIC IMAGE PROCESSING
7.1 Determination of exterior orientation parameters
Module PanoramaOrientation can be implemented for various types of cameras. We applied the software to determine exterior orientation parameters of Lunokhod-1,-2 archive panoramas that were lost after Soviet lunar missions Luna-17 and Luna-21 (Kozlova et al., 2014). It helps to recover rover tilts using the skyline visible in panoramic images.
a)
b)
Figure 12. a) User interface of the PanoramaOrientation module; b) Lunokhod-2 archive panorama (# 6-405) corrected for the determined Lunokhod tilts (horizontal tilt – 2.3, vertical
tilt – 14.5).
The software calculates geometric skyline and constructs a distance grid based on camera parameters and entered by user values of tilts (Fig. 12a). The grid is automatically placed onto the panorama, so we can visually compare if it fits to the real horizon or not. In the latter case, user can iteratively change the tilts to get good agreement with the skyline. Then obtained values of tilts allow us to bring assembled Lunokhod panoramas to the horizon (Fig. 12b).
7.2 Artificial surface image modeling
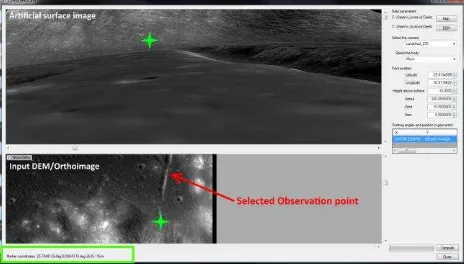
Module OrthoDem2Cam computes artificial surface images based on DEM using orthomosaic as image texture. Any virtual observation points can be selected on orthomosaic (in the lower window) or by inputting their coordinates, as well as height and angle orientation parameters on the right panel (Fig. 13). The user can also use different cameras (Lunokhod and Apollo as well as modern types of cameras); a result is an artificial surface image that could have been obtained by the selected camera. Thus, the artificial image keeps 3D-information: every pixel corresponds with the certain position on DEM and orthomosaic (e.g. green marks in Fig. 13). Such modeling also helps to determine rover locations for the surface images, for example, the panoramas that have been transmitted from the Moon surface by the Soviet planetary rovers Lunokhod-1 and -2 (Kozlova et al., 2015).
Figure 13. User interface of the OrthoDem2Cam module with example of artificial lunar surface image (upper window) based on LROC NAC DEM on Lunokhod-2 area: observation point is
near Fossa Recta groove in Le Monnier crater.
ACKNOWLEDGEMENTS
This work was carried out at MIIGAiK and supported by Russian Science Foundation, project #14-22-00197.
REFERENCES
Abdrakhimov A.M., Basilevsky A.T., Ivanov M.A., Kokhanov A.A., Karachevtseva I.P., Head J.W. Occurrence probability of slopes on the lunar surface: estimate by the shaded area percentage in the LROC NAC images. 2015, Solar System Research, V. 49, N. 5, pp. 285-294, DOI: 10.1134/S0038094615050019.
Adrov V. and Titarov P. 2004, Photogrammetric processing of satellite scanner imagery. http://www.racurs.ru/?page=256.
Adrov V.N, Chekurin A. D, Sechin A. Yu, Smirnov A. N, Adam-Guillaume J.-P, Quessete J.-P. 1995, Program PHOTOMOD: digital photogrammetry and stereoscopic image synthesis on a personal computer. Digital Photogrammetry and Remote Sensing. Ed.: Fedosov E.A. Proc. SPIE, 2646, pp. 89-96. DOI: 10.1117/12.227853.
Anderson J.A., Sides S.C., Soltesz D.L., Sucharski T.L. and Becker K.J. Modernization of the Integrated Software for Imagers and Spectrometers. 2004, Lunar Planet. Sci. XXXV,
Houston, Texas, Abstract #2039.
http://www.lpi.usra.edu/meetings/lpsc2004/pdf/2039.pdf.
Becker K.J., Archinal B.A., Hare T.M., Kirk R.L., Howington-Kraus E., Robinson M.S., Rosiek M.R. 2015, Criteria for automated identification of stereo image pairs. 46th Lunar and Planetary Science Conference, Abstract #2703. http://www.hou.usra.edu/meetings/lpsc2015/pdf/2703.pdf.
Belton M.J., Klaasen K.P., Clary M.C., Anderson J.L., Anger C.D., Carr M.H., Chapman C.R., Davies M.E., Greeley R., Anderson D., Bolef L.K., Townsend T.E., Greenberg R., Head III J.W., Neukum G., Pilcher C.B., Veverka J., Gierasch P.J., Fanale F.P., Ingersoll A.P., Masursky H., Morrison D., Pollack J.B. The Galileo Solid-State Imaging experiment. 1992, Space Science Reviews, Vol. 60, Issue 1, pp. 413-455. DOI: 10.1007/BF00216864.
Benesh M. and Jepsen P. Voyager. Imaging Science Subsystem, Calibration report. 1978, Jet Propulsion Laboratory. http://pds-rings.seti.org/voyager/iss/Benesh_Jepsen_1978.pdf.
Blewett D.T., Chabot N.L., Denevi B.W., Ernst C.M., Head J.W, Izenberg N.R., Murchie S.L., Solomon S.C., Nittler L.R., McCoy T.J., Xiao Z., Baker D.M.H., Fassett C.I., Braden S.E., Oberst J., Scholten F., Preusker F., Hurwitz D.M., 2011. Hollows on Mercury: MESSENGER evidence for geologically recent volatile-related activity. Science, 333, 1856; DOI: 10.1126/science.1211681.
Brusnikin E.S., Kreslavsky M.A., Zubarev A.E., Patratiy V.D., Krasilnikov S.S., Head J.W. and Karachevtseva I.P. Topographic measurements of slope streaks on Mars using HiRISE stereo images. 2016, Icarus (in press).
Cavanaugh J.F., Smith J.C., Sun X., Bartels A.E., Izquierdo L.R., Krebs D.J., Novo-Gradac A.M., McGarry J.F., Trunzo R.,. Britt J.L., Karsh J., Katz R.B., Lukemire A., Szymkiewicz R., Berry D.L., Swinski J.P., Neumann G.A., Zuber M.T., Smith D.E. 2007, The Mercury Laser Altimeter Instrument for the MESSENGER Mission. Space Science Reviews, Volume 131, Issue 1, pp. 451-479. DOI: 10.1007/s11214-007-9273-4.
De Rosa D., Bussey B., Cahill J.T., Lutz T., Crawford I.A., Hackwill T., Van Gasselt S., Neukum G., Witte L., McGovern A., Grindrod P.M., Carpenter J.D. Characterisation of potential landing sites for the European Space Agency’s lunar lander project. 2012, Planetary and Space Science. Vol.74, Issue 1, pp. 224-246. DOI: 10.1016/j.pss.2012.08.002.
Deen R. VICAR: Quick-Start Guide. 2015, California Institute
of Technology.
http://www- mipl.jpl.nasa.gov/vicar_os/v1.0/vicar-docs/VICAR_guide_1.0.pdf.
Grodecki J. and Dial G. Block adjustment of high-resolution satellite images described by rational polynomials. 2003, Photogrammetric Engineering & Remote Sensing, Vol. 69, No. 1, pp. 59-68. DOI: http://dx.doi.org/10.14358/PERS.69.1.59.
Hash C., Espiritu R., Malaret E., Prockter L., Murchie S., Mick A., Ward J. 2012, MESSENGER: Mercury Dual Imaging
System (MDIS)
http://pds-imaging.jpl.nasa.gov/documentation/MDISEDRSIS.PDF.
Hirschmuller H. Accurate and efficient stereo processing by semi-global matching and mutual information. 2005, IEEE Conference on Computer Vision and Pattern Recognition
(CVPR), San Diego, USA,
http://www.dlr.de/rm/Portaldata/52/Resources/dokumente/mode ler/cvpr05hh.pdf.
Jaumann R. and 25 co-authors, and the HRSC Co-Investigator Team. The High-Resolution Stereo Camera (HRSC) experiment on Mars Express: Instrument aspects and experiment conduct from interplanetary cruise through the nominal mission. 2007, Planetary and Space Science 55, pp. 928-952. DOI: 10.1016/j.pss.2006.12.003.
Jet Propulsion Laboratory, California Institute of Technology, Pasadena. 2009, Planetary Data System Standards Reference. https://pds.nasa.gov/documents/sr/StdRef_20090227_v3.8.pdf.
Karachevtseva I., Kokhanov A., Rodionova J., Konopikhin A., Zubarev A., Nadezhdina I., Mitrokhina L., Patratiy V., Oberst J. Development of a new Phobos Atlas based on Mars Express image data. 2015, Planetary and Space Science, 108, pp. 24-30. DOI: 10.1016/j.pss.2014.11.024.
Karachevtseva I., Oberst J., Scholten F., Konopikhin А., Shingareva K., Cherepanova E., Gusakova E., Haase I., Peters O., Plescia J., Robinson M. 2013, Cartography of the Lunokhod-1 Landing Site and Traverse from LRO Image and Stereo Topographic Data. Planetary and Space Science, Vol. 85, p. 175-187, DOI:10.1016/j.pss.2013.06.002.
Karachevtseva I.P., Kokhanov A.A., Rodionova J.F., Zharkova A.Yu., Lazareva M.S. Mapping of inner and outer celestial bodies using new global and local topographic data derived from photogrammetric image processing. 2016a, The International Archives of the Photogrammetry, Remote Sensing and Spatial Information Sciences (this issue).
Karachevtseva I.P., Kozlova N.A., Kokhanov A.A., Zubarev A.E, Nadezhdina I.E., Patratiy V.D., Konopikhin A.A., Basilevsky A.T. Oberst J., Haase I., Joliff B., Plescia J., Robinson M. Cartography of the Luna-21 landing site and Lunokhod-2 traverse area based on Lunar Reconnaissance Orbiter camera images and surface archive TV-panoramas. 2016b, Icarus, Special LRO issue (in press).
Knowles B. Cassini Imaging Science Subsystem (ISS) Data User's Guide. 2012, Space Science Institute. http://pds-rings.seti.org/cassini/iss/ISS_Data_User_Guide_120703.pdf.
Kokhanov A.A., Kreslavsky M.A., Karachevtseva I.P. Small impact craters in the polar regions of the Moon: peculiarities of morphometric characteristics. 2015, Solar System Research, V.49, No.5, pp. 295-302. DOI: 10.1134/S0038094615050068.
Kozlova N., Zubarev A., Karachevtseva I., Nadezhdina I., Kokhanov A., Patraty V., Mitrokhina L. and Oberst J. Some aspects of modern photogrammetric image processing of Soviet Lunokhod panoramas and their implementation for new studies of lunar surface. 2014, The International Archives of the Photogrammetry, Remote Sensing and Spatial Information Sciences, Vol. XL-4, pp. 121-126. DOI: 10.5194/isprsarchives-XL-4-121-2014.
Kozlova N., Zubarev A., Solodovnikova A., Rybakin Yu., Garov A., Abdrakhimov A., Karachevtseva I. Lunar rovers and archive panoramas: Past for the Future. 2015, EPSC Abstracts,
Vol. 10, EPSC2015-532-1.
Malin M.C., Bell III J.F., Cantor B.A., Caplinger M.A., Calvin W.M., Clancy R.T., Edgett K.S., Edwards L., Haberle R.M., James P.B., Lee S.W., Ravine M.A., Thomas P.C., Wolff M.J. Context Camera Investigation on board the Mars Reconnaissance Orbiter. 2007, Journal of Geophysical Research, vol. 112, E05S02, DOI: 10.1029/2006JE002808.
McEwen A.S., Eliason E.M., Bergstrom J.W., Bridges N.T., Hansen C.J., Delamere W.A., Grant J.A., Gulick V.C., Herkenhoff K.E., Keszthelyi L., Kirk R.L., Mellon M.T., Squyres S.W., Thomas N., Weitz C.M. Mars Reconnaissance Orbiter’s High Resolution Imaging Science Experiment (HiRISE). 2007, Journal of Geophysical Research, vol. 112, E05S02. DOI: 10.1029/2005JE002605.
Nadezhdina I.E., Zubarev A.E. Formation of a reference coordinate network as a basis for studying the physical parameters of Phobos. 2014, Solar System Research, Vol. 48, No. 4, pp. 269-278. DOI: 10.1134/S003809461404008X.
Nadezhdina I.E., Zubarev A.E., Brusnikin E.S., Oberst J. Libration model for Enceladus based on geodetic control point network. 2016, The International Archives of the Photogrammetry, Remote Sensing and Spatial Information Sciences (this issue).
Oberst J., Zubarev A., Nadezhdina I., Shishkina L., Rambaux N. The Phobos geodetic control point network and rotation model. 2014, Planetary and Space Science, 102, Special Issue, pp. 45-50. DOI: 10.1016/j.pss.2014.03.006.
Robinson M.S., Brylow S.M., Tschimmel M., Humm D., Camera (LROC) instrument overview. Space Sci. Rev. 150, pp. 81-124. DOI: 10.1007/s11214-010-9634-2
Zharkova A.Yu., Kreslavsky M.A., Brusnikin E.S., Zubarev A.E., Karachevtseva I.P., Head III J.W. Morphometry of small flat floored craters on Mercury: implications for regolith
thickness. 2015, AGU Abstracts.
https://agu.confex.com/agu/fm15/webprogram/Paper62434.html
Zubarev A.E., Nadezhdina I., Oberst J., Hussmann H., Stark A. New Ganymede control point network and global shape model. 2015a, Planetary and Space Science. Volume 117, pp. 246–249. DOI:10.1016/j.pss.2015.06.022.
Zubarev A.E., Nadezhdina I.E., Brusnikin E.S., Karachevtseva I.P. and Oberst J. Methodology of image processing using the inhomogeneies data for estimation of basic parameters of celestial bodies (the example of Ganymede). 2016, Solar System Research, No. 5 (in press).
Zubarev A.E., Nadezhdina I.E., Brusnikin E.S., Kokhanov A.A., Lazareva M.S., Karachevtseva I.P. and Oberst J. Studies of basic geodetic parameters and mapping of Galilean Satellites. 2015b, ISPRS meeting, Berlin. Commission IV, WG IV/8. http://www.dlr.de/pf/Portaldata/6/Resources/dokumente/abt_pd/ isprs/berlin_2015/Zubarev_ISPRS_IV8_2015.pdf.