USING GEOMETRY-BASED METRICS AS PART OF FITNESS-FOR-PURPOSE
EVALUATIONS OF 3D CITY MODELS
K. Wongaand C. Ellulb
a
Department of Computer Science, University College London, UK - [email protected]
bDepartment of Civil, Environmental and Geomatic Engineering, University College London, UK - [email protected]
KEY WORDS:3D GIS; 3D geoinformation; geometric complexity; 3D data quality; 3D fitness-for-purpose; 3D city models
ABSTRACT:
Three-dimensional geospatial information is being increasingly used in a range of tasks beyond visualisation. 3D datasets, however, are often being produced without exact specifications and at mixed levels of geometric complexity. This leads to variations within the models’ geometric and semantic complexity as well as the degree of deviation from the corresponding real world objects. Existing descriptors and measures of 3D data such as CityGML’s level of detail are perhaps only partially sufficient in communicating data quality and fitness-for-purpose. This study investigates whether alternative, automated, geometry-based metrics describing the variation of complexity within 3D datasets could provide additional relevant information as part of a process of fitness-for-purpose evaluation. The metrics include: mean vertex/edge/face counts per building; vertex/face ratio; minimum 2D footprint area and; minimum feature length. Each metric was tested on six 3D city models from international locations. The results show that geometry-based metrics can provide additional information on 3D city models as part of fitness-for-purpose evaluations. The metrics, while they cannot be used in isolation, may provide a complement to enhance existing data descriptors if backed up with local knowledge, where possible.
1. INTRODUCTION
Three-dimensional geospatial information (3D GI) is being in-creasingly used in a large range of tasks beyond visualisation, with an expectation of 3D capability both among specialist users and the general public (Ellul and Wong, 2015). 3D GI offers additional functionality not available in 2D, in particular when analysing visibility, surface, sub-surface and shadowing (Zlatanova et al., 2002). Other 3D specific applications include volumet-ric calculations which allow for accurate assessment of build-ing capacity as well as forest size (Rahlf et al., 2014; Vanegas et al., 2012). 3D city models initially focused on visualisation and geometry (Batty et al., 2000) rather than on its geometric-topological structure (Gr¨oger and Pl¨umer, 2012). In recent years, governments and councils around the world have been extend-ing their 2D GIS implementations in cities to 3D (Albrecht and Moser, 2010). The availability of open 3D city models has over-come the cost barrier of data, allowing for many new applications that can be supported by this technology. These datasets, how-ever, are created in isolation, by different producers, and may be created to a local specification for a specific purpose. This leads to variations in the models’ geometric and semantic complexity, as well as the degree of deviation from the corresponding real world objects (L¨owner and Gr¨oger, 2016). Further inconsisten-cies in these datasets may include: the choice of features mod-elled; the level of geometric detail features are modelled at; the level of semantics; the inclusion of textures; the choice of rep-resentation; the file formats used and the delivery mechanisms to potential users. Although applications such as environmen-tal analysis (Ngo et al., 2014), navigation (Musliman et al., 2006) and cadastre and land management (Jazayeri et al., 2014) increas-ingly call for standardized 3D models with consistent topology, many visually convincing datasets show weak or invalid geome-try (Zhao et al., 2014). In practice, 3D city models focus on the recreation of correct geometry and visual satisfaction, with little to no consideration on attributes or semantics.
As 3D datasets vary intrinsically and extrinsically, there is a need to be able to quantify and describe these datasets to users in or-der to enable them to make informed choices where multiple 3D
datasets exist and for when selecting a dataset for a specific visu-alisation or analytical task. Existing measures of 3D data such as CityGML’s concept of level of detail (LoD) (Kolbe et al., 2005) are perhaps only partially sufficient in fully communicating data quality and fitness-for-purpose as the specification is not unam-biguous (Biljecki et al., 2016). This allows for a high freedom of interpretation resulting in potential inconsistencies and mis-understanding. There is therefore a need to explore alternative measures to describe complexity levels, which may allow users to better assess the suitability of data for specific applications.
In this paper, two aspects of the problem are considered. Firstly, alternative, automated and geometry-based metrics to analyse the variation of complexity within 3D city datasets are investigated. As a trusted source of 3D ground-truth data is often not available for 3D city datasets, the descriptive metrics explored in this study aim to operate without reference to validation data. Further, the metrics are intended to be independent of any particular 3D for-mat and should be applicable to any 3D boundary-representation of building models. Secondly, the paper also investigates whether automated metrics can better describe 3D data to users, provid-ing additional information on the dataset and thus allowprovid-ing for a more effective assessment of fitness-for-purpose. The simplicity of the metrics should ensure ease of understanding for the users. The study also looks to understand if the above metrics are useful in comparing different 3D city models.
2. BACKGROUND
2.1 3D city models and 3D representations
algorithms available for computing physical properties from that representation (Haala et al., 1998). BRep defines spatial objects by their bounding elements such as planar faces, with vertices and edges defined by the intersection of the bounding planes. Different methods can be used to create BRep models, from semi-automated methods such as photogrammetry to manual modelling based on computer-aided design (CAD) (D¨ollner and Buchholz, 2005). The methodologies vary in their aims where semi-automated methods seek to produce large coverage datasets with least man-ual effort, CAD-based modelling allows for much finer detail at a smaller coverage. These different methodologies introduce dif-ferent sources of errors and artefacts into the 3D data.
2.2 3D data quality
Data quality is defined by the degree to which a set of inher-ent characteristics fulfils requireminher-ents (ISO, 2005). Specifically, geographic information data quality is expressed by multiple el-ements including completeness, logical consistency, positional accuracy, thematic accuracy, temporal quality and usability el-ement (ISO, 2013). As yet, no standard approaches to measuring 3D data quality have been developed, although 3D city models are being produced worldwide at an increasing rate (Stoter et al., 2016).
Existing methodologies in evaluating GI quality can be split into two general approaches: extrinsic (comparison with external data); and intrinsic (evaluation derived from the data itself). For extrin-sic evaluations, Akca et al. (2010) assessed the geometric accu-racy of the model generation process from LiDAR data, compar-ing the generated models to a validation dataset. Haala and Kada (2010) provides a state of the art review of 3D building recon-struction methods identifying that the development of fully au-tomatic algorithms is still required to overcome the considerable manual operations. Cheng et al. (2015) proposed a framework using a fuzzy realistic index to evaluate the visual and geometric quality of 3D models. Haithcoat et al. (2001) examined geometric fidelity by subdividing the model and verifications data into vox-els to calculate omission (missing data) and commission (false positives) within 3D datasets. Kr¨amer et al. (2007) describes a quality model for 3D city models by translating the six criteria for 2D quality measurements: positional accuracy; completeness; semantic accuracy; correctness; temporal conformance and; log-ical consistency. These measures, while they may apply to 3D in theory, cannot always be generated in practice. For 2D qual-ity assessments, a verification dataset may be available from an existing external source or collected using ground-based survey methods. In comparison, an external 3D dataset may not exist and to capture primary verification data in 3D is arguably more difficult and time consuming. Methods comparing between ver-ification and input 3D datasets to assess measures such as refer-ence system accuracy, positional accuracy and completeness are therefore not always possible in practice. On a more subjective basis, Durupt and Taillandier (2006) provided a visual evaluation of automatic building reconstruction methods, using an opera-tional approach.
For intrinsic evaluations, Wagner et al. (2013a) explored 3D ge-ometric quality and outline several metrics as part of the City-Doctor tool including planarity, self-intersection, surface orien-tation error and duplicated points. The tool and its validation process provides an error report which is useful for healing in-valid geometries but it does not provide a general statement on the grade of compliance with data specifications or usability of the model (Wagner et al., 2013a). Ledoux (2013) presented a prototype methodology to validate individual solids according to international standards for geographic information. The proto-type is able to inform the user of the nature of the errors and of
their locations, but requires manual effort to modify and correct the geometry. Alam et al. (2013) looked at validation and healing of CityGML while similarly Zhao et al. (2014) developed a repair framework for the geometric repair of CityGML models.
2.3 Level of detail, geometric and semantic complexity
Level of detail (LoD) is a term and concept adopted by a wide range of disciplines, from building information modelling to com-puter graphics, each with its nuances in its definition (Bolpagni, 2016). Within GIS, the concept is most commonly used in 3D city modelling to represent different levels of geometric and se-mantic complexity. A practical implementation is within the Open Geospatial Consortium’s CityGML standard (Kolbe et al., 2005) which uses five LoDs to indicate how much detail should be mod-elled, ranging from simple 2.5D model of footprints to detailed interiors (further details can be found in L¨owner et al. (2013)). It is important to note that the level of detail does not explicitly convey data quality as defined by the ISO (2013). For example, it is possible to have a LoD1 block model which is accurate and a LoD3 model which is of poorer quality (Biljecki et al., 2015). The current measures of level of detail, however, should not be discounted entirely as they are still useful in the wider context of data quality and within fitness-for-purpose evaluations. Descrip-tors of geometric and semantic complexity can provide general information from which quality-related knowledge may be de-rived. Users can therefore assess the suitability of a dataset and ascertain if it is able to satisfy the requirements of the user’s appli-cation e.g. selecting LoD2 or higher if roof geometry is required.
Since its introduction, the concept of LoD has become increas-ingly inadequate in communicating to users the geometric and semantic qualities of 3D models in an unambiguous way (Bil-jecki et al., 2014). Shortcomings specific to the CityGML stan-dard include, but are not limited to, the coupling of indoor objects with the highest LoD, lack of multiple indoor LoDs, lack of ex-plicit representation of windows until LoD3 and the freedom of interpretation at each LoD (L¨owner and Gr¨oger, 2016). Addition-ally, many datasets may in fact consist of buildings at different LoD, with modelling focus on important buildings (landmarks) as opposed to suburban areas. It should be noted that efforts are underway in refining and updating the CityGML standard for version 3.0 to overcome these deficiencies (Benner et al., 2013; Machl, 2013; Biljecki et al., 2016; L¨owner et al., 2013; L¨owner and Gr¨oger, 2016).
In summary, while some 3D data quality assessments may be au-tomated, others may still contain manual elements which may be laborious and time-consuming. Further problems include the fact that detailed reference datasets might not be available yet at a large scale for extrinsic data quality assessment (Elberink and Vosselman, 2011). The remainder of this paper presents alter-native, simpler, intrinsic and automated metrics for communicat-ing the usefulness of a 3D dataset. The metadata or descriptors could provide additional and supplementary quality-related infor-mation which users could utilise within data selection processes and fitness-for-purpose evaluations.
3. METHODOLOGY
3.1 Data
Busi-ness Location Center, 2016); 2) Frankfurt1, Germany [city cen-tre only2] (Stadtvermessungsamt Frankfurt am Main, 2016); 3) Toronto, Canada (City of Toronto, 2016); 4) Washington D. C., USA (District of Columbia, 2016); 5) Adelaide, Australia (Ade-laide City Council, 2016) and; 6) Rotterdam, The Netherlands (Geemente Rotterdam, 2016). While it is recognised that this is not an exhaustive list of 3D datasets available, the datasets were generated using a variety of methodologies (see Table 1 for ref-erences) providing a range of potential 3D modelling artefacts to test the proposed metrics.
3.2 Metrics
Six metrics are investigated in this study: Mean number of ver-tices/edges/faces per building (Metrics 1, 2 and 3); Mean number of vertices per face (4); Frequency distribution of 2D footprint area (5) and; Frequency distribution of feature length (6). The metrics selected are intentionally simple to ensure ease of under-standing by the user. The first three are simple geometry metrics normalised by the total number of buildings to create three com-plexity measures. They provide an indication of the detail and complexity of the buildings within the dataset but are strongly de-pendent on the architecture of the modelled area3. Mean number of vertices per face metric provide an indication of the efficiency of the vertices in modelling. For example if a representation can define a building with fewer nodes without losing detail, then it is more efficient. While it is relatively easy to understand and could potentially identify representations with a large amount of redundant vertices and collinear points, the metric is dependent on the specific modelling process chosen. Lastly, two minimum size metrics are included. Under a revised LoD specification for 3D building by Biljecki et al. (2016), the inclusion of minimum size was suggested to help users identify the selection criteria for objects to be acquired during modelling. Minimum size could be defined by either the minimum footprint area or minimum feature length. Both variations are implemented and tested in this study. A mean value of each metric was also produced for each dataset to provide a city-scale measure. Frequency distributions of the minimum size metrics were also calculated.
3.3 Method
Each dataset was converted from its delivery format and stored in an Oracle Spatial Database 11g using FME 2014 SP1. The storage in a spatial database with a spatial index allowed for effi-cient interrogation of the geometry at the city scale. It also pro-vided consistency between datasets when querying the geometry. Following conversion, a custom Java parser generated the met-rics, storing the results back to the database. For the minimum 2D footprint, only the polygon representing the ground surface was evaluated. Where datasets were structured as CityGML, the elements were differentiated as Roof Surface, Wall Surface or Ground Surface allowing for simple extraction. For the remain-ing datasets, a parser extracted 2D footprints from the 3D models. Finally, for minimum feature length, a parser decomposed every feature into an edge component to calculate its length and was stored with the building identifier in an output table. The min-imum value was then extracted for each building to provide the shortest 3D length of each building.
1
This dataset was obtained free of charge from the Frankfurt Univer-sity of Applied Sciences for purposes of research.
2
The City Surveying Office of Frankfurt has a maximum data size limit of 10km2for the 3D city model. Therefore, only the city centre was evaluated in this study
3
For example, there are areas with complex buildings that require more faces to be modelled, while other areas may contain simple build-ings in which a simple representation is sufficient and additional geometry does not pertain to additional detail.
3.4 Validation of method and potential sources of error
Zhao et al. (2014) identifies four main sources of error within 3D city models: 1) choice of modelling tools; 2) model optimiza-tion; 3) conversion; 4) and semantics editing. As the datasets were converted and stored into an Oracle spatial database, it was important to ensure that additional geometry errors were not in-troduced into the data during the database conversion process. There may be, however, errors inherent in the data derived from any conversion processes carried out by the data producer e.g. conversion from CAD models. The validation of the data con-version process ensures that any subsequent errors discovered within the data is not related to the database conversion. A vertex count, edge count, face count and coordinates comparison was conducted on samples of each of the six datasets, before (in the native format as delivered) and after the conversion process, to ensure there was no loss of information, distortions or artefacts. The process of storing into the Oracle spatial database filters out any invalid geometries, excluding them from analysis.
4. RESULTS
The focus of all six datasets was predominantly on geometric de-tail. Where attributes were present, they may have been incom-plete or inconsistent. The geometric detail focused on detail of roof surfaces rather than fac¸ade detail – none of the six datasets sampled contained representations of windows or doors. This may have been due to the use of airborne data acquisition meth-ods as all six datasets employed aerial photography, LiDAR or a combination of both to create the 3D city models. Some inconsis-tencies were found when processing the geometry. For example, where buildings were composed of multiple polyhedrons using a parent-child identifier relationship (e.g. GML PARENT ID and GML ID), there were instances where the parent identifier was mislabelled or omitted. This lead to omission or commission er-rors when analysing a building as a single entity. The results of the metrics analysis are presented below (Tables 1 & 2).
5. DISCUSSION
In this study intrinsic, automated, geometry-based metrics were analysed. This is because: 1) there is a lack of external, ground-truth 3D data; 2) assessing data at a city wide coverage is labo-rious and time-consuming and; 3) existing 3D datasets focus on geometry, with incomplete or no attributes.
The metrics described in section 3 were developed in absence of any ground-truth data for 3D and relied solely on the interroga-tion of the geometry. The aim was to investigate whether these automated, geometry-based metrics could provide users with ad-ditional relevant information as part of the fitness-for-purpose evaluation. These metrics are city-wide in coverage, rather than focusing on individual geometry and are descriptive.
City name Adelaide Frankfurt (city
centre) Washington, D.C. Rotterdam Toronto Berlin Year created 2015 2009 2015 2011 2015 2009
Formats available Autodesk 3DS CityGML
Spreadsheet, Google
123 MB (CityGML) 559 MB (ESRI Shapefile)
Number of buildings 4,569 10,588 51,886 181,686 397,602 537,208
Total no. of vertices 932,142 245,455 4,408,678 4,894,975 10,917,879 10,553,991
Total no. of edges 2,445,284 365,862 7,259,299 7,761,599 21,787,065 15,811,582
Total no. of faces 1,505,950 143,284 2,762,051 2,548,795 3,546,117 6,411,443
Mean no. of vertices
per building 204.014 23.182 84.969 26.942 27.459 19.646 Mean no. of edges per
building 535.19 34.554 139.909 42.72 54.796 29.433 Mean no. of faces per
building 329.602 13.533 53.233 14.029 8.919 11.935 Mean no. of vertices
per face 0.619 1.713 1.596 1.921 3.079 1.646
Table 1. Summary of the 3D datasets and metrics
City name Adelaide Frankfurt (city
centre) Washington, D.C. Rotterdam Toronto Berlin Frequency distribution of 2D footprint area
0 to 1 m2 0.59% 0.03% 0.21% 0.02% 0.00% 0.00%
1 to 10 m2 1.44% 7.84% 5.31% 24.24% 0.02% 3.09%
10 to 100 m2 0.74% 48.74% 23.79% 60.20% 0.16% 58.70%
100 to 1,000 m2 60.82% 42.26% 58.98% 13.96% 83.16% 35.96%
1,000 to 10,000 m2 35.65% 1.11% 11.28% 1.51% 16.05% 2.19%
10,000+ m2 0.74% 0.02% 0.42% 0.07% 0.60% 0.05%
Frequency distribution of minimum feature length by percentage of buildings
0 to 1m 89.10% 39.70% 73.10% 71.90% 85.90% 28.30%
1 to 5m 10.70% 49.90% 26.10% 25.60% 13.90% 59.50%
5 to 10m 0.20% 9.70% 0.70% 2.50% 0.20% 11.20%
10+ m 0.00% 0.80% 0.00% 0.00% 0.00% 1.00%
Frequency distribution of minimum feature length under 1m by percentage of buildings
0 to 0.2m 51.90% 14.20% 23.50% 62.40% 25.10% 11.90%
0.2 to 0.4m 25.30% 8.40% 25.20% 4.20% 31.30% 5.60%
0.4 to 0.6m 6.90% 7.60% 12.60% 2.20% 17.10% 4.70%
0.6 to 0.8m 2.60% 5.10% 7.10% 1.50% 8.10% 3.40%
0.8 to 1m 2.50% 4.40% 4.70% 1.60% 4.30% 2.70%
Absolute count and proportion of buildings with at least one edge<0.5m # with at least one
edge<0.5m 3,745 2,862 29,055 123,209 71,008 107,651
% with at least one
short edge 82% 27% 56% 68% 18% 20%
Frequency distribution of edge<0.5m count by percentage of buildings
1 0.60% 0.00% 8.30% 1.20% 0.00% 0.30%
2 to 10 11.10% 19.20% 29.50% 46.90% 11.20% 13.10%
11 to 100 45.20% 5.10% 17.00% 18.90% 6.60% 6.00%
101 to 1000 22.90% 2.70% 1.20% 0.80% 0.00% 0.50%
1000+ 2.20% 0.10% 0.00% 0.00% 0.00% 0.00%
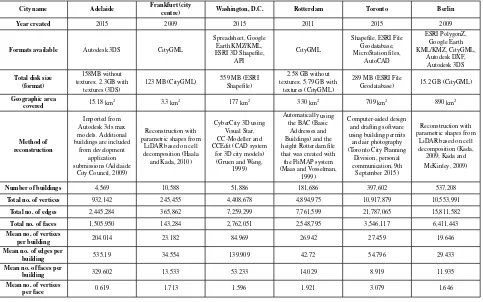
Figure 1. Excerpts of the six datasets (clockwise from top-left: Adelaide, Berlin, Frankfurt, Rotterdam, Toronto and Washington D.C.)
scale. The metrics could also be normalised by other geomet-ric attributes such as volume or size of footprint area but these are not investigated in this study. Lastly, the metrics are depen-dent on local architecture thus comparison between multiple 3D datasets from different locales is not possible.
5.1 Simple geometry metrics
The simple geometry metrics (mean number of vertices/edges/faces per building) provide an indication of detail and complexity of the buildings with a dataset. All three measures indicate a similar pattern in the results. Specifically, the mean number of vertices per building measure reveals Adelaide (204.014) and Washing-ton D.C. (84.969) have significantly higher values than any of the other datasets. Referring back to the method of generation in Table 1, the high values are most likely attributed to the choice of CAD-based modelling tools. One exception from this is the Toronto dataset which, while created using CAD-based software, has a relatively low mean number of vertices per building. This is due to the dataset being composed of predominantly LoD1 block buildings. As suggested by Zhao et al. (2014), to produce visu-ally satisfying 3D models with the least effort, interactive mod-elling tools can be used to shape the appearance of models. The freedom these tools provide, however, may lead to error-prone meshes (Botsch et al., 2010) which can contain excessive and re-dundant detail. A 3D city model with a high number of vertices per building could affect the subsequent 3D spatial analyses. A trade-off must be made between the adequacy of 3D detail, the visual impact of the resulting 3D dataset, the suitability of the response times and the overall usability of the 3D model (Ellul and Altenbuchner, 2014). For example, within the application of 3D noise mapping, Deng et al. (2016) argues that having more detailed and complex geometry is, in fact, not beneficial.
The mean number of vertices per face metric was intended to provide a measure of efficiency and detail in a model where the lower the ratio, the less efficient the model. For example, it is
possible for a building model to have a large amount of vertices, and therefore seemingly more detail, but for these vertices to provide no additional information. The extra vertices could be collinear points which are therefore redundant within the repre-sentation. With this measure, Adelaide presents the lowest score (0.619) which could, on first inspection, be a result of the super-fluous complexity introduced by CAD modelling tools, indicating a lack of efficiency. However, Washington D.C.’s score (1.596) is in line with other, non-CAD software generated datasets pos-sessing a value between 1.59 and 1.91. This metric is dependent on both the local architecture and the specific modelling process chosen. The metric may be more effective and provide more util-ity if measured as a frequency distribution rather than as a nor-malised, single value, city-wide metric.
5.2 Minimum size metrics
Two interpretations of minimum size were investigated in this study: minimum footprint area and minimum feature length. Both metrics, however, had issues when calculating a single city-wide value. Errors within the modelling process from small parcels and short edges meant that values generated were not represen-tative e.g. very small<0.001m or null values. The frequency distribution for both measures was therefore investigated.
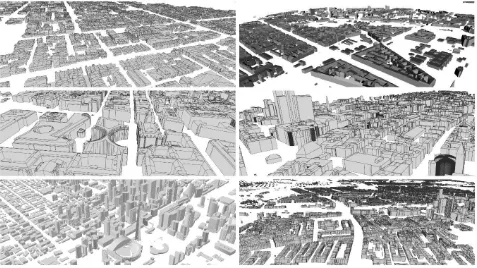
which were attributed with its own unique parent building iden-tifier (Figure 2). These may also be shared features between two separate buildings e.g. a shared entrance. Further inspection into the 44,078 features in the Rotterdam dataset of buildings with footprints less than 10m2in area showed that 929 (2.1%) shared a common boundary with two or more buildings with an area 10m2 or larger. The ambiguity in assigning building parent identifiers for shared features in this instance has rendered the metric less effective. Additional work is required to identify and quantify whether these features are standalone, small, subsidiary struc-tures or misattributed components of a larger building. There is also a need in future standards to explicitly define the consistent handling of shared building parts and the subsequent assignment of the parent building identifiers. This is a practical demonstra-tion of the requirement for semantic checks on the relademonstra-tionship between building and building parts as described by Wagner et al. (2013b). In summary, the metric is useful in revealing the min-imum dimensions of a modelled feature if the data is relatively clean and consistent, but by assessing the frequency distribution, it is useful for identifying inconsistencies and errors derived from the modelling process.
Figure 2. Shared features such as overhangs found in Rotterdam with its own unique parent identifier
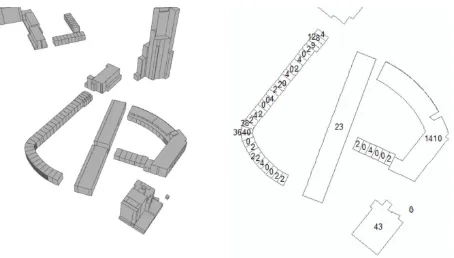
Figure 3. An example of short edges in Adelaide dataset
Table 2 shows the frequency distribution of minimum feature length across the six datasets. In this study, the metric is defined as the shortest edge length of any 3D edge of each building. With the exception of Berlin and Frankfurt, over 70% of the build-ings in the other datasets contained at least one edge of between 0 and 1m in length. Further inspection at the frequency distri-bution between 0 and 1m of the minimum feature length shows that Adelaide (51.9%) and Rotterdam (62.4%) have a very large number of very short edges of up to 20cm long. The sources of these short edges include: the method of building reconstruc-tion (e.g. manual, automatic or semi-automatic); the choice of modelling tools e.g. CAD modelling; derived detail from 2D footprint; straight line representation of curved surfaces or; er-roneous short edges (e.g. from collinear points). Regardless of the source, the presence of these short edges vastly increase the computation load required to store, visualise and analyse these
Figure 4. Curved surfaces represented by multiple short straight segments in Rotterdam
datasets. An absolute count of short edges (defined as any edge with a length less than 0.5m) was conducted for every building (Table 2). It can be see that both Adelaide (82%) and Rotter-dam (68%) have a large proportion of buildings with at least one short edge. Toronto (18%) and Berlin (20%) contain the fewest buildings with at least one short edge. Deconstructing it further, it shows that 70.3% of buildings in Adelaide possess 11 or more short edges and almost half (46.91%) of buildings in Rotterdam have between two to ten short edges. It must be noted, how-ever, the sources of these short edges are different. For Ade-laide, the short edges are derived from the choice of modelling tools as the dataset was created from Autodesk 3ds max mod-els (Figure 3). For Rotterdam, the high frequency of short edges was due to a large number buildings with curves represented as multiple short, straight segments (Figure 4). This is an inherent inadequacy of BRep models. For example, although CityGML contains an abstract class for curves, features composed of multi-ple curves are not recommended within the modelling guidelines (SIG3D, 2014). Similarly, Oracle Spatial is able to store MUL-TICURVE, but this was not used in order to not distort or alter the original geometry prior to analysis. It is therefore important to consider the local architectural style when choosing the 3D representation used to model the area.
The poor attribution of building parts to buildings and artefacts of the creation process that exist within the datasets biased the metric, making it difficult to use and interpret. It does, however, allow users to identify models which may be overly complex due to a proliferation of short edges within its representation. These redundant short edges renders the datasets larger than necessary, without providing additional detail and therefore less efficient to use. Further work is required to clarify and define minimum fea-ture length as an indication of the lowest level of modelling as it is not possible to calculate a metric retrospectively. Alternative definitions of feature lengths could be considered, such as the di-agonal of the minimum bounding rectangle and require further investigation.
5.3 Applying the metrics in practice
areas due to architectural variation. Beyond the users, these met-rics could allow data producers to compare geometric qualities between different iterations of the same 3D dataset produced.
5.4 Recommendations and future work
Several recommendations arise from this study. Firstly, the in-corporation of simple geometry measures within metadata could provide better contextual information for potential users when carrying out fitness-for-purpose evaluations. Secondly, explo-rations into existing 3D city models shows in practice that there is a need for clearer and less ambiguous 3D specifications and detailed clarification in exception cases such as shared building parts. Thirdly, there is a need to consider the impact of the choice of modelling tools on visual satisfaction and the performance of a model. There is a need to quantify and communicate if a 3D model is better suited for visualisation or analysis purposes.
Further work is required in identifying and quantifying the differ-ent sources of 3D error utilising a larger sample set. The metrics investigated in this study focused on BRep models. Additional work on the potential application of the metrics to different forms of data such as voxels and point clouds is required. Other geome-try measures could also be investigated, such as minimum height, minimum bounding volume, the ratio between roof and ground vertices, and assessing surface normal vectors. Investigating the spatial variation of geometric complexity and of the other met-rics may also be of use. Exploring existing algorithms and 3D data quality measures from other fields such as geometry pro-cessing could avoid duplication of effort. Testing the usability of the metrics with real users could also be of benefit.
6. CONCLUSION
This study provides an alternative and automated approach in de-scribing the variation of complexity within 3D city models in the absence of ground-truth data. It demonstrates that a wealth of in-formation can be derived and extracted solely from the geometry, providing additional information on the 3D city models relevant to the users as part of a process of fitness-for-purpose evalua-tion. These metrics, although they cannot be used in isolation, may provide a complement to enhance existing data descriptors if backed up with local knowledge, where possible. Further work is required on quantifying sources of 3D error and continued im-provement in data quality assessment methods.
References
Adelaide City Council, 2009. Development informa-tion guide of the Adelaide 3D City Model: Fre-quently asked questions for architects, designers and developers. http://www.adelaidecitycouncil.com/assets/ 3d city model faqs.pdf [18 May 2016].
Adelaide City Council, 2016. 3D City Model.
http://www.adelaidecitycouncil.com/planning-development/city-planning/3d-city-model/ [18 May 2016].
Akca, D., Freeman, M., Sargent, I. and Gruen, A., 2010. Quality assessment of 3D building data.The Photogrammetric Record
25(132), pp. 339–355.
Alam, N., Coors, V. and Zlatanova, S., 2013. Detecting shadow for direct radiation using CityGML models for photovoltaic potentiality analysis.Urban and Regional Data Management; Ellul, C., Zlatanova, S., Rumor, M., Laurini, R., Edspp. 191– 196.
Albrecht, F. and Moser, J., 2010. Potential of 3D city models for municipalities - the user-oriented case study of salzburg. In:
Geospatial Crossroads @ GI Forum ’10. Proceedings of the
Geoinformatics Forum Salzburg.
Batty, M., Chapman, D., Evans, S., Haklay, M., Kueppers, S., Shiode, N., Smith, A. and Torrens, P. M., 2000. Visualizing the city: communicating urban design to planners and decision-makers.
Benner, J., Geiger, A., Gr¨oger, G., H¨afele, K. and L¨owner, M., 2013. Enhanced LoD concepts for virtual 3D city models.
In:ISPRS annals of the photogrammetry, remote sensing and
spatial information sciences. Proceedings of the ISPRS 8th3D GeoInfo conference & WG II/2 workshop, pp. 51–61.
Berlin Business Location Center, 2016. 3D City Model of Berlin. http://www.businesslocationcenter.de/en/berlin-economic-atlas/the-project [18 May 2016].
Biljecki, F., Heuvelink, G. B., Ledoux, H. and Stoter, J., 2015. Propagation of positional error in 3D GIS: estimation of the solar irradiation of building roofs. International Journal of
Geographical Information Science29(12), pp. 2269–2294.
Biljecki, F., Ledoux, H. and Stoter, J., 2014. Redefining the level of detail for 3D models. GIM International: the worldwide
magazine for geomatics 28 (November), 2014.
Biljecki, F., Ledoux, H. and Stoter, J., 2016. An improved LoD specification for 3D building models.Computers, Environment
and Urban Systems59, pp. 25–37.
Bolpagni, M., 2016. The many faces of ’LoD’. http://www.bimthinkspace.com/2016/07/the-many-faces-of-lod.html [19 July 2016].
Botsch, M., Kobbelt, L., Pauly, M., Alliez, P. and L´evy, B., 2010.
Polygon mesh processing. CRC press.
Cheng, L., Zhang, W., Zhong, L., Du, P. and Li, M., 2015. Frame-work for evaluating visual and geometric quality of three-dimensional models.Selected Topics in Applied Earth
Obser-vations and Remote Sensing, IEEE Journal of8(3), pp. 1281–
1294.
City of Toronto, 2016. 3D Massing - Data catalogue. http://www1.toronto.ca/wps/portal/contentonly?vgnextoid= d431d477f9a3a410VgnVCM10000071d60f89RCRD [18 May 2016].
Deng, Y., Cheng, J. C. and Anumba, C., 2016. A framework for 3D traffic noise mapping using data from BIM and GIS integration. Structure and Infrastructure Engineeringpp. 1– 14.
District of Columbia, 2016. 3D Buildings. http://dcatlas.dcgis.dc.gov/metadata/BldgPly 3D.html [18 May 2016].
D¨ollner, J. and Buchholz, H., 2005. Continuous level-of-detail modeling of buildings in 3D city models. In: Proceedings of
the 13th annual ACM international workshop on Geographic
information systems, ACM, pp. 173–181.
Durupt, M. and Taillandier, F., 2006. Automatic building recon-struction from a digital elevation model and cadastral data: an operational approach.International Archives of
Photogramme-try, Remote Sensing and Spatial Information Sciences36(Part
3), pp. 6.
Elberink, S. O. and Vosselman, G., 2011. Quality analysis on 3D building models reconstructed from airborne laser scanning data. ISPRS Journal of Photogrammetry and Remote Sensing
Ellul, C. and Altenbuchner, J., 2014. Investigating approaches to improving rendering performance of 3D city models on mobile devices.Geo-spatial Information Science17(2), pp. 73–84.
Ellul, C. and Wong, K., 2015. Advances in 3DGIS agi fore-sight report 2020 - the association of geographic information. http://www.agi.org.uk/news/foresight-report [18 May 2016].
Geemente Rotterdam, 2016. Rotterdam 3D - Cityportal Rotter-dam. http://www.rotterRotter-dam.nl/rotterdam 3d [18 May 2016].
Gr¨oger, G. and Pl¨umer, L., 2012. CityGML - interoperable se-mantic 3D city models. ISPRS Journal of Photogrammetry
and Remote Sensing71, pp. 12–33.
Gruen, A. and Wang, X., 1999. CyberCity Modeler, a tool for interactive 3-D city model generation. In: Photogrammetric Week, Vol. 99, pp. 317–327.
Haala, N. and Kada, M., 2010. An update on automatic 3D build-ing reconstruction.ISPRS Journal of Photogrammetry and
Re-mote Sensing65(6), pp. 570–580.
Haala, N., Brenner, C. and Anders, K.-H., 1998. 3D urban GIS from laser altimeter and 2D map data. International Archives
of Photogrammetry and Remote Sensing32, pp. 339–346.
Haithcoat, T. L., Song, W. and Hipple, J. D., 2001. Build-ing footprint extraction and 3-D reconstruction from LIDAR data. In:Remote Sensing and Data Fusion over Urban Areas,
IEEE/ISPRS Joint Workshop 2001, IEEE, pp. 74–78.
ISO, 2005. ISO 9000 Quality management systems – fundamen-tals and vocabulary. Standard, International Organization for Standardization.
ISO, 2013. ISO 19157 Standard: Geographic information – data quality. Standard, International Organization for Standardiza-tion.
Jazayeri, I., Rajabifard, A. and Kalantari, M., 2014. A geometric and semantic evaluation of 3D data sourcing methods for land and property information.Land Use Policy36(0), pp. 219–230.
Kada, M., 2009. The 3D Berlin project. In: Photogrammetric week, Vol. 2009, pp. 331–340.
Kada, M. and McKinley, L., 2009. 3D building reconstruction from LiDAR based on a cell decomposition approach. Int.
Arch. Photogramm. Remote Sens. Spat. Inf. Sci38, pp. W4.
Kolbe, T. H., Gr¨oger, G. and Pl¨umer, L., 2005. CityGML:
Inter-operable access to 3D city models. Springer, pp. 883–899.
Kr¨amer, M., Haist, J. and Reitz, T., 2007. Methods for spatial data quality of 3D city models. In: Eurographics Italian chapter conference, pp. 167–172.
Ledoux, H., 2013. On the validation of solids represented with the international standards for geographic information.
Computer-Aided Civil and Infrastructure Engineering28(9),
pp. 693–706.
L¨owner, M. O. and Gr¨oger, G., 2016. Evaluation crite-ria for recent LoD proposals for City-GML buildings.
Photogrammetrie-Fernerkundung-Geoinformation 2016(1),
pp. 31–43.
L¨owner, M.-O., Benner, J., Gr¨oger, G. and H¨afele, K.-H., 2013.
New concepts for structuring 3D city models - an extended
level of detail concept for CityGML buildings. Springer,
pp. 466–480.
Maas, H.-G. and Vosselman, G., 1999. Two algorithms for ex-tracting building models from raw laser altimetry data.
IS-PRS Journal of photogrammetry and remote sensing54(2),
pp. 153–163.
Machl, T., 2013. Minutes of the International OGC, SIG 3D and TUM Workshop on Requirements for CityGML 3.0. In: Inter-national OGC, SIG 3D and TUM workshop on requirements for CityGML, Vol. 3, pp. 1–28.
Musliman, I. A., Rahman, A. A. and Coors, V., 2006. 3D nav-igation for 3D-GIS - initial requirements. Proceedings from
3DGeoInfo 2006.
Ngo, L. K., Tsang, T. S. and Wong, Charles, Y., 2014. 3-dimensional EIA - a greener tool to plan and design.
Ohori, K. A., Ledoux, H. and Stoter, J., 2015. An evaluation and classification of nD topological data structures for the repre-sentation of objects in a higher-dimensional GIS.International
Journal of Geographical Information Science29(5), pp. 825–
849.
Rahlf, J., Breidenbach, J., Solberg, S., Næsset, E. and Astrup, R., 2014. Comparison of four types of 3D data for timber volume estimation.Remote Sensing of Environment155, pp. 325–333.
Stadtvermessungsamt Frankfurt am Main,
2016. Digital 3d city model of frankfurt. https://www.frankfurt.de/sixcms/detail.php?id=3027&
ffmpar%5B id inhalt
Stoter, J. and Zlatanova, S., 2003. 3D GIS, where are we
stand-ing? In: ISPRS Joint Workshop on’Spatial, Temporal and
multi-dimensional data modelling and analysis’, Quebec, Oc-tober, 2003.
Stoter, J., Vallet, B., Lithen, T., Pla, M., Wozniak, P., Kellen-berger, T., Streilein, A., Ilves, R. and Ledoux, H., 2016. State-of-the-art of 3D national mapping in 2016. Int. Arch.
Pho-togramm. Remote Sens. Spatial Inf. Sci.XLI-B4, pp. 653–660.
Tuan, A. N. G., 2013. Overview of three-dimensional GIS data models. International Journal of Future Computer and
Com-munication2(3), pp. 270.
Vanegas, C. A., Aliaga, D. G. and Benes, B., 2012. Auto-matic extraction of manhattan-world building masses from 3D laser range scans.Visualization and Computer Graphics, IEEE
Transactions on18(10), pp. 1627–1637.
Wagner, D., Alam, N. and Coors, V., 2013a. Geometric valida-tion of 3D city models based on standardized quality criteria.
Urban and Regional Data Management: UDMS Annual.
Wagner, D., Wewetzer, M., Bogdahn, J., Alam, N., Pries, M. and Coors, V., 2013b. Geometric-semantical consistency
valida-tion of CityGML models. Springer, pp. 171–192.
Zhao, J., Stoter, J. and Ledoux, H., 2014.A framework for the
au-tomatic geometric repair of CityGML models. Springer Berlin
Heidelberg, pp. 187–202.
Zlatanova, S., Rahman, A. and Pilouk, M., 2002. 3D GIS: current status and perspectives. International Archives of
Photogram-metry Remote Sensing and Spatial Information Sciences34(4),