GEOVISUALIZATION OF LOCAL AND REGIONAL MIGRATION USING WEB
DEMOGRAPHICS
R. T. Schuermann a, T. E. Chow a*
a Texas Center for Geographic Information Science, Department of Geography - (rts, chow)@txstate.edu
Technical Commission II
KEY WORDS: Geography, Data Mining, Visualization, Animation, Spatial, Temporal
ABSTRACT:
The intent of this research was to augment and facilitate analyses, which gauges the feasibility of web-mined demographics to study spatio-temporal dynamics of migration. As a case study, we explored the spatio-temporal dynamics of Vietnamese Americans (VA) in Texas through geovisualization of mined demographic microdata from the World Wide Web. Based on string matching across all demographic attributes, including full name, address, date of birth, age and phone number, multiple records of the same entity (i.e. person) over time were resolved and reconciled into a database. Migration trajectories were geovisualized through animated sprites by connecting the different addresses associated with the same person and segmenting the trajectory into small fragments. Intra-metropolitan migration patterns appeared at the local scale within many metropolitan areas. At the scale of metropolitan area, varying degrees of immigration and emigration manifest different types of migration clusters. This paper presents a methodology incorporating GIS methods and cartographic design to produce geovisualization animation, enabling the cognitive identification of migration patterns at multiple scales. Identification of spatio-temporal patterns often stimulates further research to better understand the phenomenon and enhance subsequent modeling.
1. INTRODUCTION
Identifying patterns within social and ethno-cultural demographics, based on surname analysis, have been used to explore and further understand change in social patterning, ethno-cultural structure, and genetics (Cheshire and Longley, 2011; Mateos et al., 2011; Winney et al., 2012). While it is challenging to analyze a big data set consisting of an entire population’s demographics, focusing on a small subset through confining space and ethnicity provides the ability to test microdata mining methods and produce meaningful analytical results within in a reasonable timeframe. According to the U.S. Census, there were over 26 million persons estimated to be living in the State of Texas in 2012. Of that population, 4.2%, or roughly 1 million, were estimated to be of Asian ethnicity (U.S. Census Bureau, 2014). Using a web-based data extraction tool that leveraged a list of popular Vietnamese surnames, Chow et al. (2011) acquired demographic data for 40.3% of the estimated Vietnamese-American (VA) population in Texas as reported by the American Community Survey 2009. Chow et al. (2012) used this data set to model population change during the period between 2000 and 2009 at both the county and census tract levels. Additionally, web-based VA demographic data was mined during the following years: 2010 and 2012.
Expanding on this research, this paper presents a methodology incorporating GIS methods and cartographic design to produce geovisualizations concerning the 2010 data set. Enabling the
cognitive identification of migration patterns at multiple scales often stimulate further research to better understand ethno-cultural phenomenon and enhance subsequent modeling. In order to produce meaningful visualizations of movement pattern, we applied the process of Knowledge Discovery in Database (KDD) for data exploration. This ensures that useful information is derived from data through a holistic approach involving data preparation, selection, cleaning, inclusion of prior knowledge, mining, and proper interpretation (Fayyad et al., 1996a; Fayyad et al., 1996b).
As the web-based mining algorithm produces a data set comprised of a specific population, the data were processed though a forward chaining inference engine. Specifically, expert knowledge was consulted to derive rules in isolating and exposing potential non-VA records. Multiple records of the same entity (i.e. person) over time were resolved and reconciled into a database through string matching across all demographic attributes, including full name, address, date of birth, age and phone number. An individual with different addresses over time indicate a person who moved during this time period (section 2). Finally, we leveraged available GIS functions to develop animated geovisualizations of migration trajectories using 2D sprites by connecting the different addresses associated with the same person and segmenting the trajectory into small fragments (section 3).
2. DATA PROCESSING
during the KDD data pre-processing step reduced noise, decreasing uncertainty in identified geovisualization patterns. Through the application of heuristics, private knowledge concerning the legitimacy of a record, we implemented a forward chaining expert system. Heuristics and expert systems allowed us to make educated guesses to effectively deal with the erroneous data (Hayes-Roth, 1983). A visual inspection of a random sampling of the records resulted in the construction of a dictionary containing frequently occurring keywords and word patterns associated with erroneous records. This dictionary serves as the foundation for rules to the identification of additional frequently occurring words and phrases unique to the false-positives. An inference engine written in Python iterated the process, generating new rules until a minimum number of new rules per iteration threshold was reached. This resulted in the removal of 0.19% (493) from the initial 257,135 web-mined VA records.
The next step in pre-processing was to convert the VA data set into a migration data set through an application of a cost-sensitive alternating decision tree (CS-ADT) (Chen et al., 2011). The CS-ADT identified sets of records representing unique individuals. It classified records within each set as same or different, based on variability within demographic attributes,
including full name, address, date of birth, age and phone number. An individual with different addresses would indicate a person who moved during this time. The web-based data extraction tool developed by Chow et al. (2011) did not capture the information concerning when a person's demographic information was recorded, if it existed at all. Due to the absence of this temporal information, the process of determining which records received a migration label of 'Move From' or 'Move To' operated under three assumptions. The first assumption was that the record's age attribute field was accurate across all databases mined. Records with an older age, or age range, were assigned the 'Move To' label. If more than two records comprised a set, the least frequently occurring record was assigned the 'Move To' label, based on the second assumption that a more recent address would have less time to be reflected in the databases. Additionally, a third assumption relied on spatial autocorrelation. A record that was farthest (Euclidean distance) from the set's geographic centroid was labeled "Move To" based on Tobler's (1970) first law of geography, that locations nearby are like each other, temporally, than a more distant location, insinuating a greater investment in migration. Although the assumptions introduce error in migration vector direction, accuracy in distance and overall patterning is acceptable for geovisualization purposes.
3. GEOVISUALIZING MIGRATION TRAJECTORIES
Introducing temporal information to 2D and 3D spatial data creates pseudo-3D and 4D spatio-temporal data respectively. Geovisualization has been shown as an emerging tool in the conceptualization of 3D and 4D spatial information (Feng et al. 2011; Resch et al. 2013). Delivery of movement distance, routes and vectors of a population, goods, services, technology and ideas allows for the recognition of geographic phenomena. With the introduction of dynamic variables, duration, rate of change, and order, we can emphasize spatio-temporal changes in VA demographics (DiBiase et al., 1992).
Order of visualization was kept consistent throughout all scales of analysis. First, the move-from locations were displayed, indicating the initial spatial distribution of VAs. Then the vectors were displayed in equal interval segments, indicating the Euclidean movement pattern for each individual. Finally, the move-to location is displayed, conveying the change in distribution. Duration was kept at a constant time throughout all animations. The specific time duration was adjusted to best
fit each researcher’s cognitive preference. Other cartographic
(visual) variables introduced by Bertin (1983) such as hue, size,
and shape were likewise adjusted based on the viewer’s
preferences.
The methodology of creating animated Euclidean vectors representing individual movement leveraged basic functions and features in most GIS software. For all individuals, a line feature was generated with a direction based on the move-from and move-to points, then segmented into 24 equal-length parts. Although web-mining provided neither a high degree of temporal precision concerning the move event, nor the spatial knowledge of route taken (length and duration of travel), general migration patterns can be interpreted through the geovisualization of movement data as contemporaneous and Euclidean. Each section becomes an animation sprite, subjected to the visual and dynamic variables. Each segment is assigned an incremental and arbitrary time stamp to be stored in a time attribute field. By enabling a time slider feature, the software can be configured to display each sprite in chronological order. A complete or partial animation can then be saved in video format, modifiable through video editing programs. Concurrently displaying all vector sprites leverages our cognitive ability to identify and discover relationships (Blok et al., 1999). Figure 1 shows a selection of animated sprite. Animated geovisualizations can be viewed at
https://www.youtube.com/channel/UCmTswjVnw1Kjk_EkNl1 W_nQ/videos. Make sure to enable HD by setting the Quality to 1080p in the video Settings.
Figure 1. Geovisualization Sprite Frames
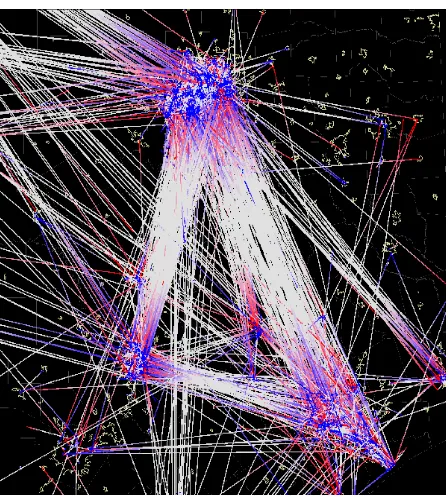
Applying variables in creative ways offers distinct visual experiences (DiBiase, 1992). For example, assigning solid versus transitioning color schemes to each segment may alter the manner in which the data is perceived. When all visual components of migration are presented in monochromatic fashion, an overall view of VA migration is presented (Figure 2). In comparison, a three primary color transition, for instance red-white-blue, creates unique effects at varying scale. State wide, areas of purple appear where move-from and move-to clustering coincides. At local scale (e.g. metropolitan area),
move-from and move-to vectors appear distinct, highlighting the difference between emigration and immigration (Figure 3). Visual recognition of hotspots can assist in the development of focused spatial analysis and model development within big data. By viewing the animations at varying scale, geovisualizations exposed movements in intra-metropolitan and metropolitan-to-metropolitan patterns. Using a static weight for
each individual’s movement vector, spatially related
movements merge to form vectors with a perceived increased weight, highlighting spatio-temporal clustering.
Figure 2. State-wide monochrome vector map of migration
4. CONCLUSION
At the state level, these geovisualizations exposed major regional migration corridors among Houston, Dallas and Austin in Texas, a slight deviation from the more well-known
“transportation triangle” that would have included San Antonio
instead of Austin (Zhang et al. 2007) (Figure 4). In addition, it was observed that there were minor migration pathways connecting smaller metropolitan areas, including El Paso, Beaumont, Amarillo, Lubbock and Corpus Christi, to these major hubs. Intra-metropolitan migration patterns were also detected at the local scale within many metropolitan areas. For instance, Austin appears to have a migration hotspot in the NE portion of the metropolitan area (Figure 5). At the scale of metropolitan area, varying degrees of immigration and emigration at a place manifest different types of migration clusters. Inter-metropolitan movement within the greater Dallas/Fort Worth Metroplex area accounted for over 50% of all migration (Figure 6). The present study explored the ability of geovisualizations to produce identifying patters in ethno-cultural demographic data. These patterns will be used to better understand descriptive statistic, develop further research to better understand phenomenon, and enhance modeling.
Future work includes the addition of the 2009 and 2012 web demographics. The results of this research will be applied to a larger data set containing multiple years, producing
geovisualizations of population change over a longer temporal period. This will allow for the continued research into predicting areas of significant population change, resource allocation during census events, and predict growth and decline of ethno-cultural populations as outlined by Chow et al. (2012).
Figure 4. ‘Texas Triangle’ map
Figure 5. Austin metropolitan area
Figure 6. Dallas/ Fort Worth metropolitan area
5. ACKNOWLEDGEMENTS
The authors are thankful to colleagues and fellow students, including David Parr, Nathaniel Dede-Bamfo, Drs. Youliang Qiu, Yan Lin, Niem Huynh, John Davis and Anne Ngu, on
projects related to web demographics and are instrumental to the ideas articulated in this manuscript.
6. REFERENCES
Bertin, J. (1983). Semiology of Graphics, William J. berg (trans.). Madison; University of Wisconsin Press.
Blok, C., B. Kobben, T. Cheng, and A. A. Kuterema. (1999). Visualization ofrelationships between spatial patterns in time by cartographicanimation. Cartography and Geographic Information Science, 26(2), 139-151.
Chen, S., A. Borthwick, V.R. Carvalho, 2011. The Case for Cost-Sensitive and Easy-To-Interpret Models in Industrial Record Linkage, ACM-9th International Workshop on Quality in Databases, August 29, 2011, Seattle, WA.
Cheshire, James A and Paul A. Longley. (2012). Identifying spatial concentrations of surnames. International Journal of Geographical Information Science, 26(2), 309–325.
Chow, T. Edwin, Y. Lin, and W. D. Chan. (2011). The Development of a Web-basedDemographic Data Extraction Tool for
Population Monitoring.Transactions in GIS, 15(4), 479-494.
Chow, T. Edwin, Y. Lin, N. T. Huynh, and J. M. Davis. (2012). Using web demographics to model population change of Vietnamese-Americans in Texas between 2000 and 2009. GeoJournal, 77, 119-134.
DiBiase, D., MacEachren, A. M., Krygier, J. B., & Reeves, C. (1992). Animation and the role of map design in scientific visualization. Cartography and geographic information systems, 19(4), 201-214.
Fayyad, U., G. Piatetsky-Shapiro, and P. Smyth. (1996a). From Data Mining to Knowledge Discovery in Databases. AI Magazine, 17(3), 37-54.
Fayyad, U., D. Haussler, and P. Stolorz. (1996b). Mining Scientific Data. Communications of the ACM, 39(11), 51-57.
Feng, L., C. Wang, C. Li, and Z. Li. (2011). A Research for 3D WebGIS Based on WebGL, Proceedings of the International Conference on Computer Science and Network Technology. Harbin, December 24–26, 348–351.
Hayes-Roth, F., D. A.Waterman, and D. B. Lenat. (1983). Building expert systems. Teknowledge Series in Knowledge Engineering, Reading: Addison-Wesley, edited by Hayes-Roth, Frederick; Waterman, Donald A.; Lenat, Douglas B., 1.
Mateos P, Longley PA, O’Sullivan D (2011) Ethnicity and
Population Structure in Personal Naming Networks. PLoS ONE 6(9): e22943. doi:10.1371/ journal.pone.0022943.
Resch, B., F. Hillen, A. Reimer, and W. Spitzer. (2013). Towards 4D Cartography – Four-Dimensional Dynamic Maps for Understanding Spatio-Temporal Correlations in Lightning Events. The Cartographic Journal, 50(3).
Tobler W., (1970). A computer movie simulating urban growth in the Detroit region. Economic Geography, 46(2): 234-240
U.S. Census Bureau. (April 19th, 2014) State and County Quickfacts. Retrieved from
http://quickfacts.census.gov/qfd/states/48000.html
Winney, B., A. Boumertit, T. Day, D. Davison, C. Echeta, I. Evseeva, K. Hutnik, S. Leslie, K. Nicodemus, E. C. Royrvik, S. Tonks, X. Yang, J. Cheshire, P. Longley, P. Mateos, A. Groom, C. Relton, D. T. Bishop, K. Black, E. Northwood, L. Parkinson, T. M. Frayling, A. Steele, J. R. Sampson, T. King, R. Dixon, D. Middleton, B. Jennings, R. Bowden, P. Donnelly, and W. Bodmer. (2012).People of the British Isles: preliminary analysis of genotypes and surnames in a UK-control population. European Journal of Human Genetics, 20, 203-210.