SEMANTIC SEGMENTATION AND DIFFERENCE EXTRACTION VIA TIME SERIES
AERIAL VIDEO CAMERA AND ITS APPLICATION
S.N.K. Amit a, *, S. Saitoa, S.Sasakib,c, Y. Kiyokib, Y. Aokia
a
Keio University, Graduate School of Science and Technology, 3-14-1 Hiyoshi, Kohoku-ku, Yokohama, Kanagawa, 223-8522 Japan –{sitinork, ssaito} @aoki-medialab.org, [email protected]
b
Keio University, Graduate School of Media and Governance, 5322 Endo, Fujisawa-shi, Kanagawa, 252-0882 Japan – [email protected], [email protected]
c
Chulalongkorn University, 254 Phayathai Road, Pathumwan, Bangkok 10330, Thailand – [email protected]
KEY WORDS: difference extraction, semantic segmentation, aerial images, convolution neural networks
ABSTRACT:
Google earth with high-resolution imagery basically takes months to process new images before online updates. It is a time consuming and slow process especially for post-disaster application. The objective of this research is to develop a fast and effective method of updating maps by detecting local differences occurred over different time series; where only region with differences will be updated. In our system, aerial images from Massachusetts’s road and building open datasets, Saitama district datasets are used as input images. Semantic segmentation is then applied to input images. Semantic segmentation is a pixel-wise classification of images by implementing deep neural network technique. Deep neural network technique is implemented due to being not only efficient in learning highly discriminative image features such as road, buildings etc., but also partially robust to incomplete and poorly registered target maps. Then, aerial images which contain semantic information are stored as database in 5D world map is set as ground truth images. This system is developed to visualise multimedia data in 5 dimensions; 3 dimensions as spatial dimensions, 1 dimension as temporal dimension, and 1 dimension as degenerated dimensions of semantic and colour combination dimension. Next, ground truth images chosen from database in 5D world map and a new aerial image with same spatial information but different time series are compared via difference extraction method. The map will only update where local changes had occurred. Hence, map updating will be cheaper, faster and more effective especially post-disaster application, by leaving unchanged region and only update changed region.
* Corresponding author. This is useful to know for communication with the appropriate person in cases with more than one author. 1. INTRODUCTION
1.1 Background
Many people misunderstood satellite imagery on Google Earth is real time imagery. Actually once the imagery is taken, commercial provider like GeoEye will takes time to process the data before providing it to the customer such as Google. Google has to evaluate the new imagery with the current imagery to determine whether the new one is better than the current. One an image is selected, it has to be processed into the format and coordinate system of Google Earth’s databases. Then it has to undergo a quality control process and fed into a processing system before it gets distributed to the live Google Earth database server. Hence, imagery on Google Earth is usually more than 6 months old. And updates only happen about once every 60 days. Each updates covers a very small portion of the globe. For example, only 4-6 cities are updated in United States, or maybe just a single state, and other countries receive similar minor updates.
As a general rule, Google tries to keep every area updated to within around three years old. The exception to that is when there is a major disaster, such as earthquake in Haiti, or tsunami in Fukushima, Japan. During and after an event like that, Google posts fresh imagery as quickly as possible to emergency workers and concerned residents of the affected areas. However, this is still a slow process especially for big disaster that occurred, even 1 minute of tsunami, everything on Fukushima prefecture, Japan is gone. Furthermore, it will be helpless
situation if the emergency workers and other related people just have an old imagery, which is not up-to-date, and they are not images and infrared satellite images before a disaster occurred, to compare with aerial images after a disaster occurred with the help of digital elevation model by using simple difference extraction method to detect blocked road blockage.
This method is able to detect road blockage in mountainous area precisely up to 80%, however it has a lot of premises such as limited to sunny day, imagery taken only in the morning and road is clearly seen from satellite. Besides, this method is only suitable for road detection on mountainous area, which is limited and unable to be used globally for other geographical changes.
1.3 Research Objective
Hence, we would like to propose a new framework to detect geographical changes to keep Google imagery up-to-date by using image processing, and able to process the latest imagery within a few hours especially after a disaster occurred.
The International Archives of the Photogrammetry, Remote Sensing and Spatial Information Sciences, Volume XL-7/W3, 2015 36th International Symposium on Remote Sensing of Environment, 11–15 May 2015, Berlin, Germany
This contribution has been peer-reviewed.
2. PROPOSED FRAMEWORK
2.1 Aerial Images
2 aerial images taken on exactly same spatial information (same coordinate, same height, and same camera angle) but different time series information are used as the input images. In this research, aerial images of Saitama District, Japan taken in year 2007 (figure 1) and 2012 (figure 2) are used.
Figure 1. Aerial images in Saitama District year 2007
Figure 2. Aerial images in Saitama District year 2012
2.2 Semantic Segmentation
Input images are then undergone semantic segmentation process. Semantic segmentation or pixel classification associates one if the pre-defined class labels to each pixel. The input images are divided into the regions, which correspond to the object of the scene. This process is important for scene understanding, it automatically extracting objects with high precision such as roads, building and trees from aerial images via convolutional neural network (CNN). For the current state we focus on building detection and other than road only.
The characteristic of CNN is alternatively stacked convolutional layers and spatial polling layers often followed by one or more fully connected layers as in multi-layer perception. Figure 3 shows the base architecture of our CNN. A convolutional layer has a number of filters and convolves them on an input image for extracting features. A pooling layer applies subsampling to the output of the next lower layer for achieving translational invariance.
CNN is chosen as one of the method in semantic segmentation because we do not need to design images features manually and train multiple classifiers independently for each terrestrial object to be extracted. Furthermore, we do not need to consider
multiple decisions, because the output of the CNN already constructs two channel label images (Road – otherwise).
Figure 3. The base architecture of CNN
2.3 Mapping Onto 5D World Map
Next, images which undergone semantic segmentation is map onto 5D world map as database according to each category. This medium is very useful to compare and understand the changes occurred in a specific area by shifting the time series.
5D world map is a multimedia sharing system which enables semantic, temporal and spatial analysis of multimedia, integrates and visualizes the analysed results as a 5 dimensional dynamic historical atlas. 5 dimensions include spatial dimensions (3D), temporal series (1D) and degenerated dimensions of semantic and colour combination (1D). The base architecture of 5D world map is shown in figure 4.
Figure 4. The base architecture of 5D world map
2.4 Difference Extraction
Last, images with the same spatial information but different time series are undergone difference extraction method to understand the changes occurred in an area and estimate the tendency of a changes or disaster to occur in near future.
For the current state, we use simple Euclidean distance and subtraction method to get the difference between 2 images of same spatial information but different time series. Euclidean distance is the shortest distance between 2 pixels in a picture. Meanwhile, subtraction method is subtracting pixel value from estimated result year 2012 to year 2007. Then, we normalized the result. Lastly, we detect the changes of newly constructed building in year 2012, building destroyed or gone in year 2012 and other changes such as changing of roof top and rebuilt same building in the same spot.
The International Archives of the Photogrammetry, Remote Sensing and Spatial Information Sciences, Volume XL-7/W3, 2015 36th International Symposium on Remote Sensing of Environment, 11–15 May 2015, Berlin, Germany
This contribution has been peer-reviewed.
3. RESULT
3.1 Semantic segmentation
Figure 5. Predicted map patch in Saitama District year 2007 after undergone semantic segmentation by CNN
Figure 6. Predicted map patch in Saitama District year 2012 after undergone semantic segmentation by CNN
3.2 Mapping onto 5D world map
Figure 7. Upload results onto 5D world map
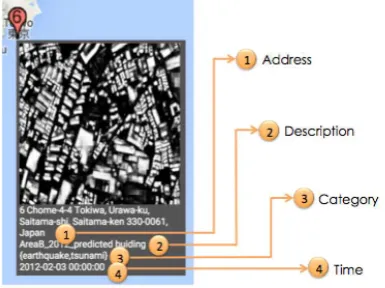
Figure 8. Zoom in: details of output predicted building image
Figure 9. Temporal series information year 2012
Figure 10. Temporal series information year 2007
3.3 Difference Extraction
Figure 11. Difference extraction via Euclidean distance method
Figure 12. Difference extraction via subtraction distance method
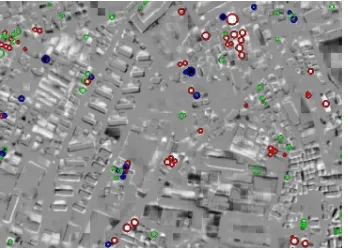
3.4 Final Change Detection
Red: New building are built in year 2012
Blue: Buildings are destroyed/ gone in year 2012
Green: Other changes (change roof top, rebuilt houses on same spot)
The International Archives of the Photogrammetry, Remote Sensing and Spatial Information Sciences, Volume XL-7/W3, 2015 36th International Symposium on Remote Sensing of Environment, 11–15 May 2015, Berlin, Germany
This contribution has been peer-reviewed.
Figure 13. Red blue and green marks show changes detected
Figure 14. Overlay changes detection marks onto expected result year 2012
Our system shows very high accuracy (almost 100% correct change detection) and very fast processing time compare to the previous method. Hence we believe the proposed method is highly evaluated and will be greatly used in remote sensing area especially geographical changes and estimation of disaster occur.
REFERENCES
Sasaki, S., Takahashi,Y. and Kiyoki,Y., "FuturisText: The 4D World Map System with Semantic, Temporal and Spatial Analyzers," Proc. of the IADIS e-Society 2008 Conference, Algarve, Portugal, pp. 162-170, April 2008
Sasaki, S., Takahashi, Y, Kiyoki, Y., “The 4D World Map System with Semantic and Spatiotemporal Analyzers,” Information Modelling and Knowledge Bases, Vol.XXI, IOS Press, pp.1- 18, 2010.
Kiyoki, Yasushi, and Xing Chen. “Contextual and Differential Computing for the Multi-Dimensional World Map with Context-Specific Spatial- Temporal and Semantic Axes.” Information Modelling and Knowledge Bases XXV 260 (2014): 82.
A. Krizhevsky, I. Sutskever, and G. E. Hinton, “Imagenet classification with deep convolutional neural networks,” in Advances in neural infor- mation processing systems, 2012, pp. 1097–1105.
C.Farabet,C.Couprie,L.Najman,andY.LeCun,“Learninghierarchi cal features for scene labeling,” Pattern Analysis and Machine Intelligence, IEEE Transactions on, vol. 35, no. 8, pp. 1915– 1929, 2013
G. E. Hinton, N. Srivastava, A. Krizhevsky, I. Sutskever, and R. R. Salakhutdinov, “Improving neural networks by preventing co-adaptation of feature detectors,” arXiv preprint arXiv:1207.0580, 2012.
Y. Jia, E. Shelhamer, J. Donahue, S. Karayev, J. Long, R. Girshick, S. Guadarrama, and T. Darrell, “Caffe: Convolutional architecture for fast feature embedding,” arXiv preprint arXiv:1408.5093, 2014
The International Archives of the Photogrammetry, Remote Sensing and Spatial Information Sciences, Volume XL-7/W3, 2015 36th International Symposium on Remote Sensing of Environment, 11–15 May 2015, Berlin, Germany
This contribution has been peer-reviewed.